


Forecasts: How might these stocks react to earnings?

Check out the forecasts for the % moves, up or down, for these big-name stocks:
NOTES:
- Forecasted % price move refers to the market's implied percentage move for the US trading session following the earnings announcement.
- It is not a prediction of direction or a guarantee of future performance.
- Actual price moves may be smaller, larger, or in the opposite direction.
- Tables below to be updated on Mondays.
Earnings Forecasts: This Week (July 14-17)
EXPECTED EARNINGS DATE | STOCK NAME | FORECASTED % MOVE: UP or DOWN (when US markets reopen post-earnings) |
14 July 2026 | 3.1% | |
14 July 2026 | 3.1% | |
14 July 2026 | 4.7% | |
14 July 2026 | 3.6% | |
14 July 2026 | 3.6% | |
15 July 2026 | 2.8% | |
15 July 2026 | 4% | |
16 July 2026 | 6.9% |
Earnings Forecasts: Biggest Stocks
STOCK NAME | EXPECTED EARNINGS DATE | FORECASTED % MOVE: UP or DOWN (when US markets reopen post-earnings) |
22 July 2026 | 5.3% | |
22 July 2026 | 5% | |
29 July 2026 | 6.5% | |
30 July 2026 | 3.4% | |
30 July 2026 | 7.9% | |
31 July 2026 | 5.8% | |
17 August 2026 | 1.5% | |
26 August 2026 | 5.6% | |
4 September 2026 | 8.1% |
3 Easy Steps: How can traders use the data above?
1) Check Ahead
Review latest market forecasts in the tables above PRIOR to the company's earnings release.
2) DYOR: Do Your Own Research
The data in the tables above are just one source of information.
Also, read Bybit Learn's "Market Pulse" reports. Conduct additional analysis through various sources.
Form your own opinion and view on the upcoming earnings:
Is your selected company's earnings announcement likelier to outperform expectations (shares tend to go UP) or disappoint markets (shares tend to go DOWN)?
3) Plan your Trade, Set your Target, Manage your Risk
For traders looking to capitalize on short-term, post-earnings volatility, the % moves listed in the tables above may be used as a guide for setting TP (Take Profit) and SL (Stop Loss) price levels.
Example (for illustration only):
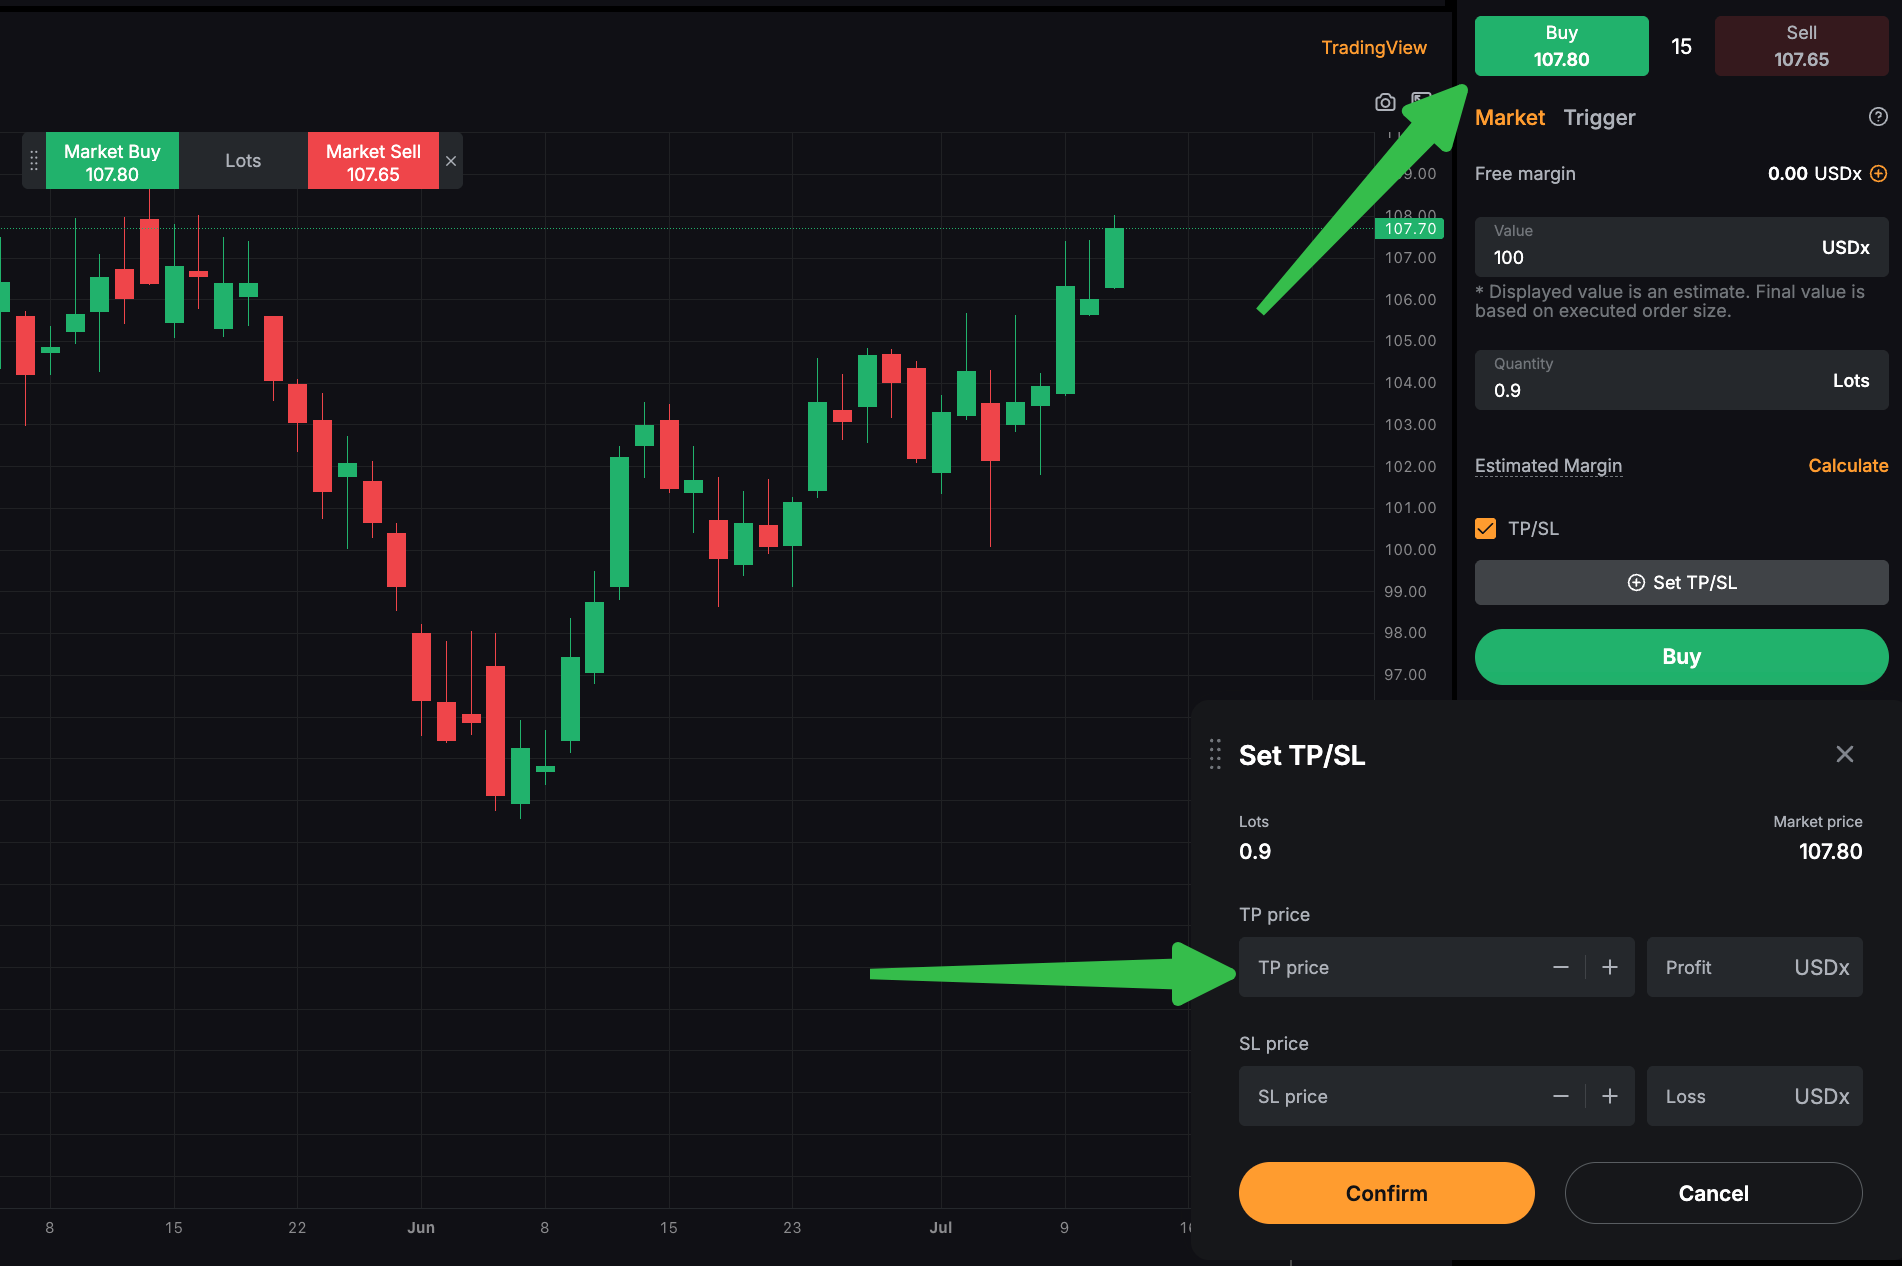
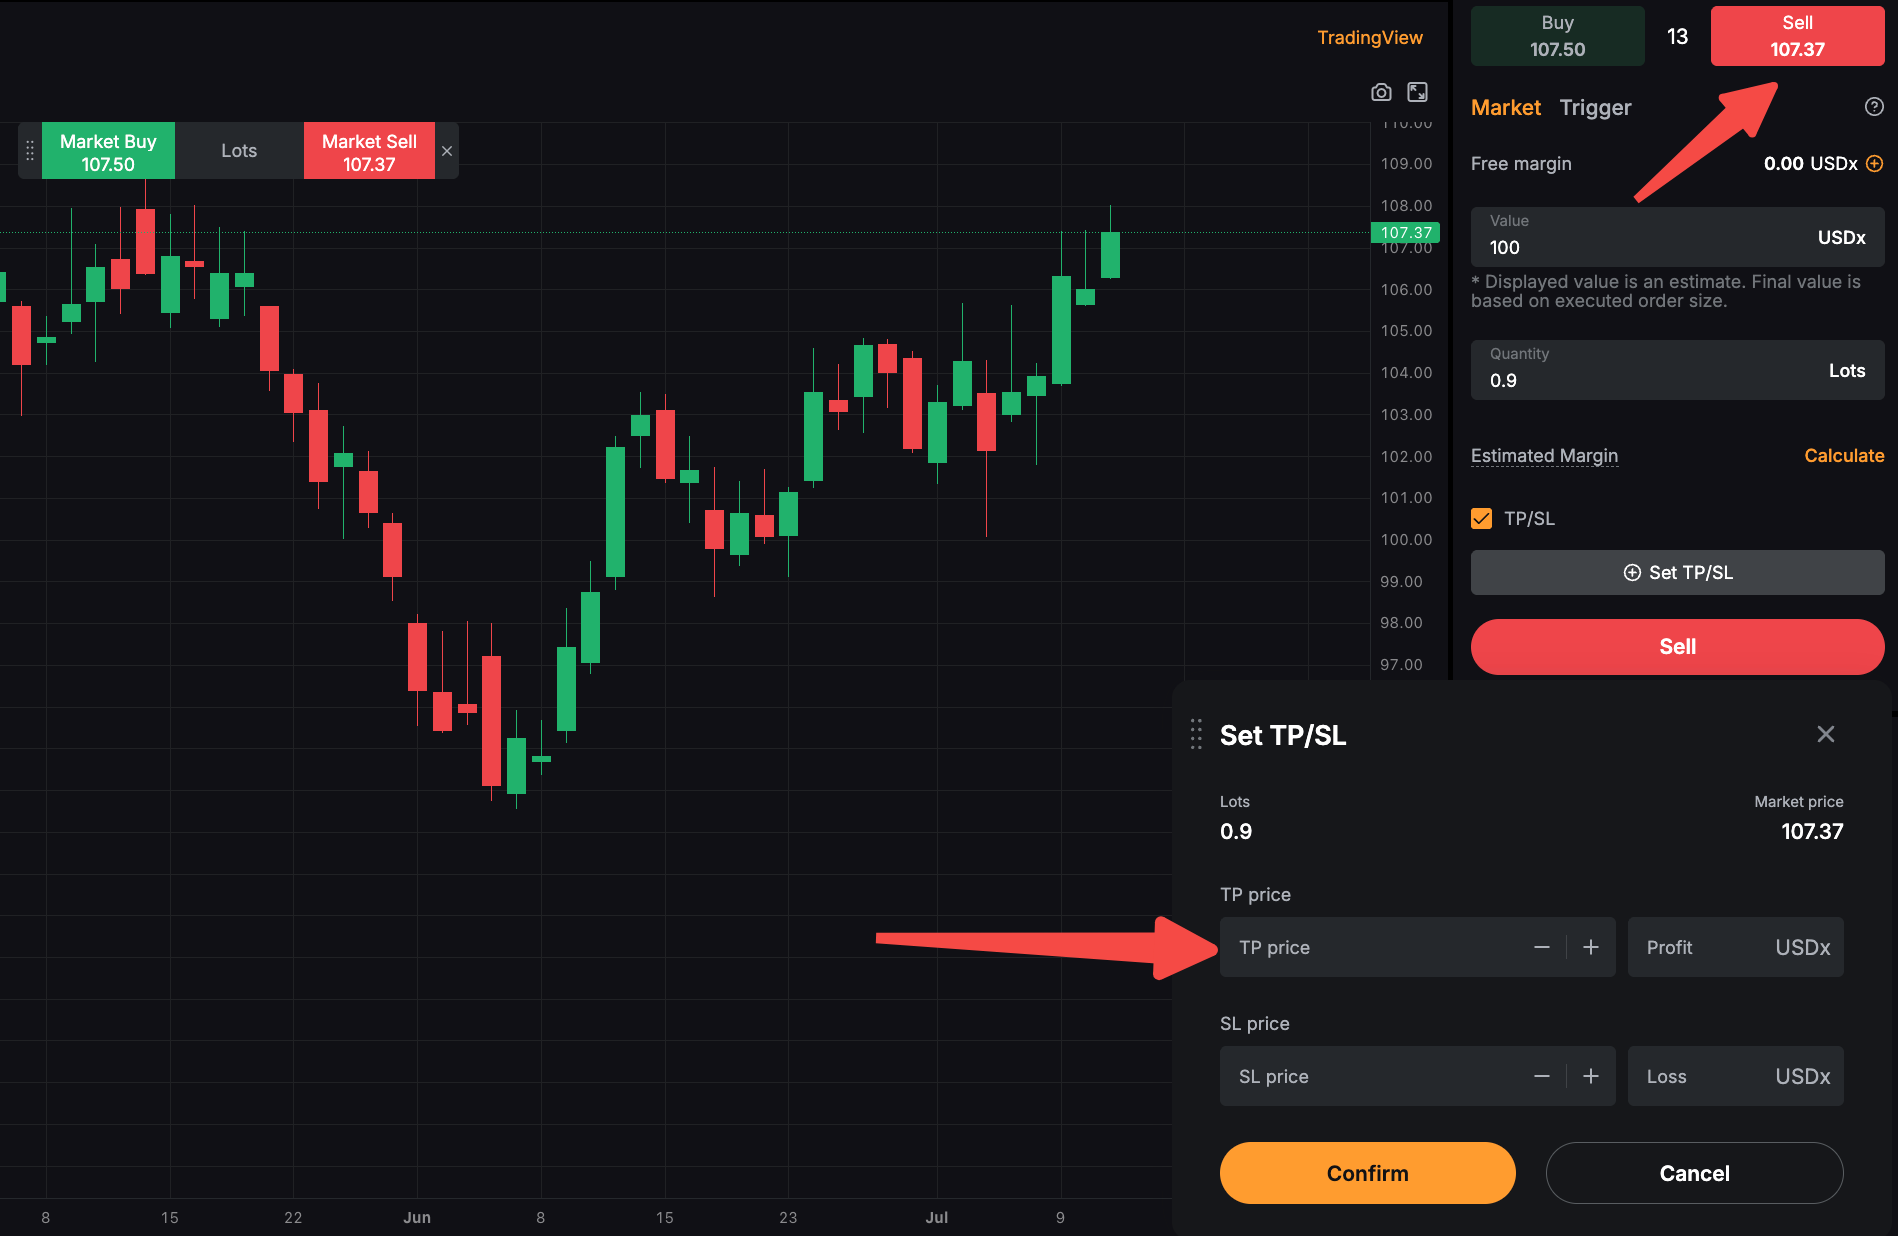
A stock is currently trading around $100, and is forecasted to rise/fall 3% after its earnings announcement.
If the trader is looking to enter a market order:
- BUY orders (hoping the price will go UP after earnings announcement): The TP could be set around $103 - if the trader chooses to rely on market forecasts.
- SELL orders (hoping the price will go DOWN after the earnings announcement): The TP could be set around $97 - if the trader chooses to rely on market forecasts.
IMPORTANT: Know your risk appetite!
Before placing the trade, review the estimated Profit and Loss amounts that's auto-calculated in the "Set TP/SL" form.
"Take Profit" and "Stop Loss" levels should be set based on your trading strategy, and risk tolerance (how much capital the trader is willing to risk, for potential profits).
DISCLAIMER:This article is provided for general information and reflects the author’s views only. It does not constitute investment advice, nor an offer or solicitation to buy or sell any financial instruments or digital assets. Your ability to access or use any products or services mentioned may be subject to the laws and regulatory requirements of your jurisdiction.