
NFT 2024 Annual Review: Overview of NFT Ecosystem and Market Performance

Guest Author: Elsa, NFTGo Research Head
Author intro: Elsa is the head of research at NFTGo, which is the #1 insight-driven gateway to the NFT ecosystem.
NFT Ecosystem Overview
NFT Landscape
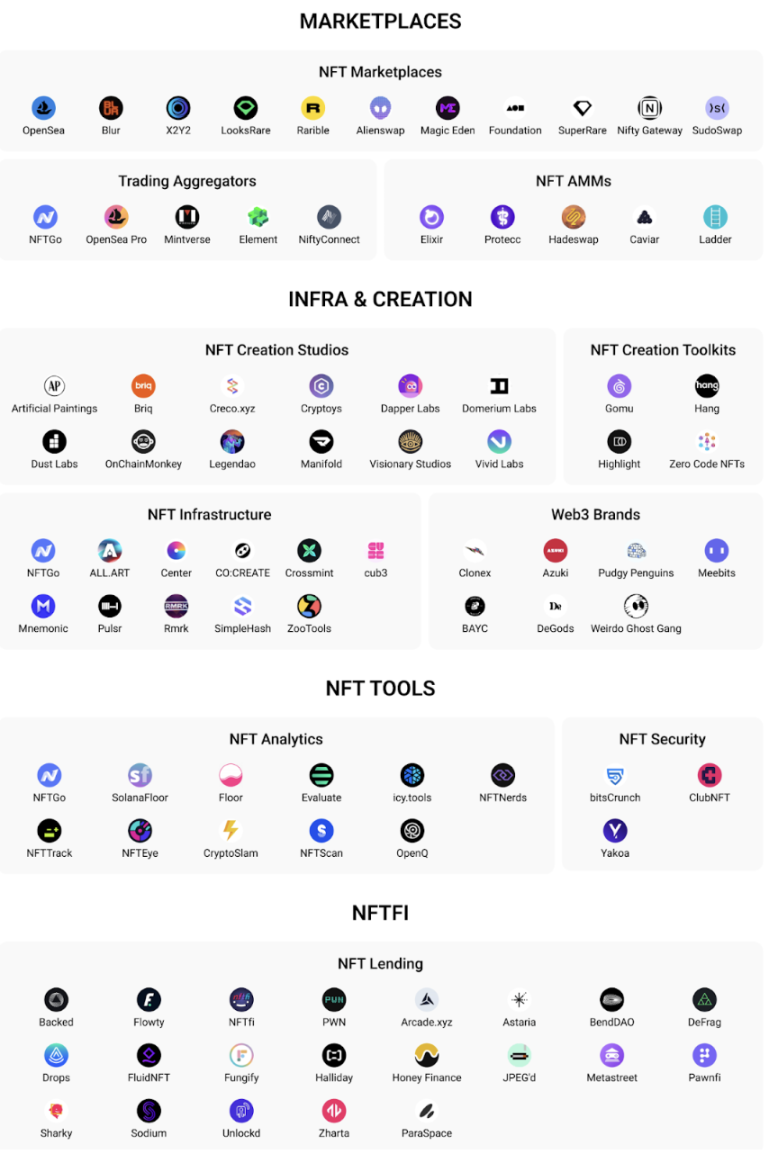
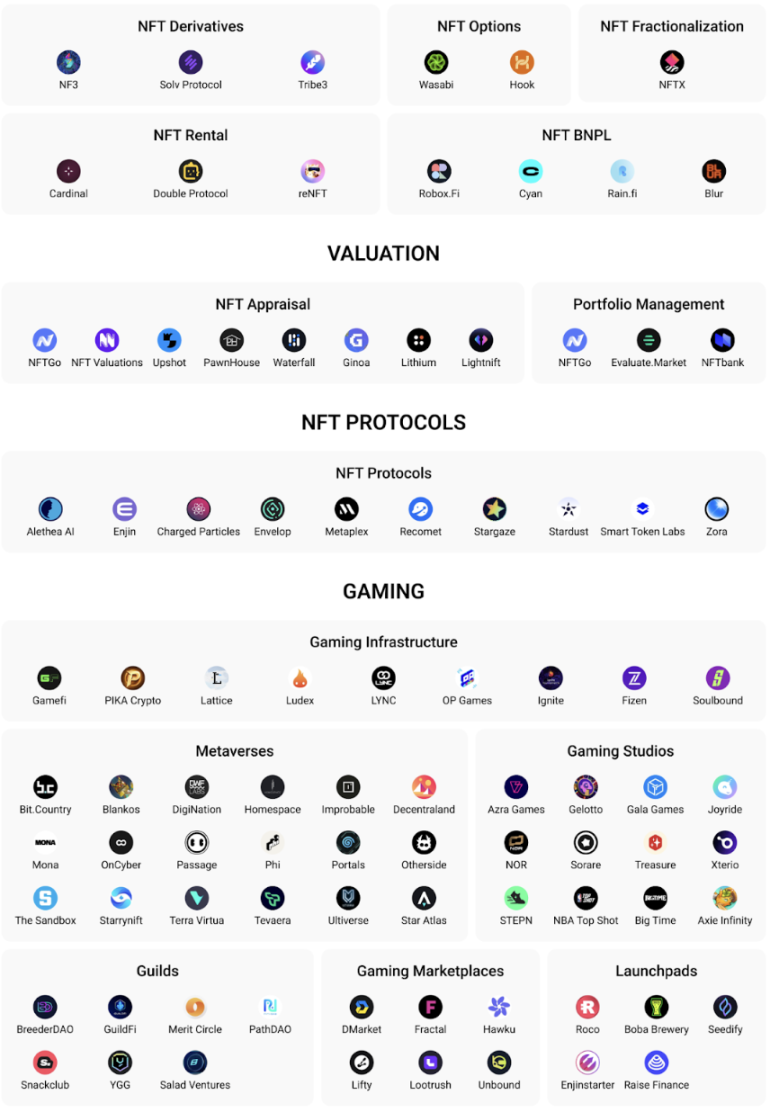
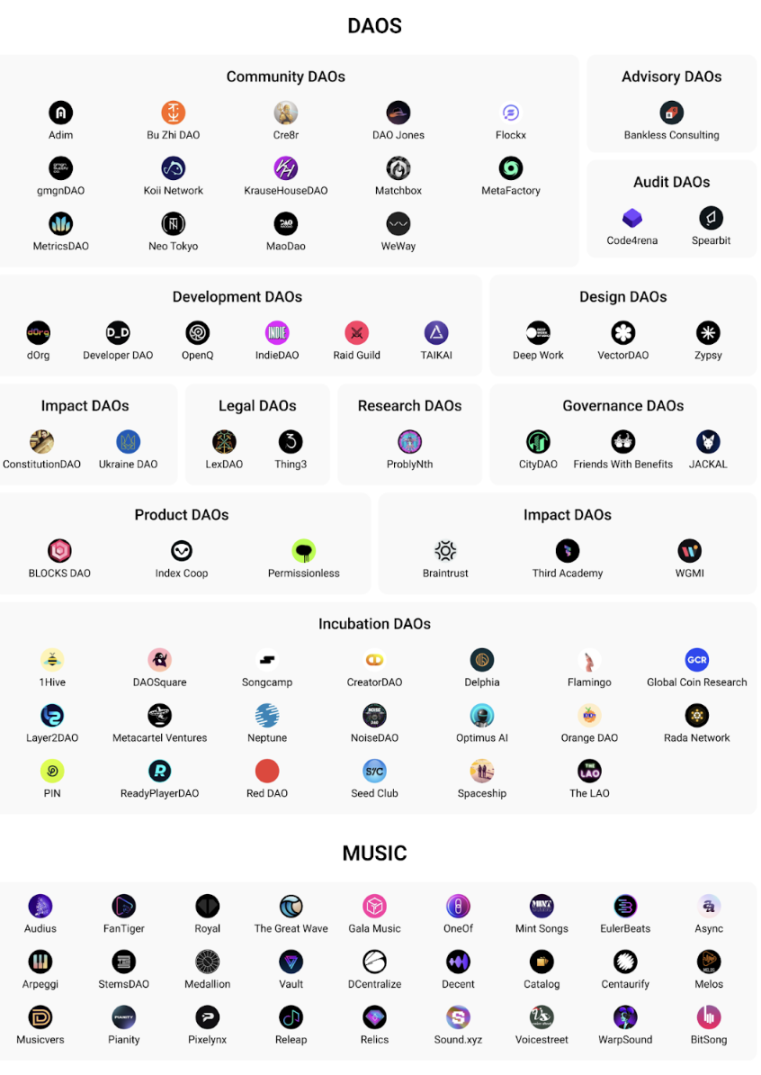
As we enter 2024, the NFT space continues to evolve. We can observe most NFT-based applications gathering around the following points.
Metaverse Interoperability — In 2023, many brands and creators launched proprietary virtual worlds and NFTs, but they remained fragmented. By 2024, cross-platform ecosystems could achieve unified digital identities and assets across different metaverses, driving transferable virtual experiences across the world.
Evolution of Gaming NFTs — While the "play-to-earn" model faced criticism in 2023, gaming NFTs will evolve into tools for creation, customization and governance. User-generated game metaverses leverage NFTs to prove ownership of digital assets.
Social Tokens — Social NFTs allow rapid social media growth by establishing exclusive channels with creators. However, in 2024, we may see a shift from NFT speculation to models that directly share revenue through tokens, such as Farcaster’s DEGEN. These tips may provide creators with monetization in a more sustainable manner.
Market Overview
Market Cap and Trading Volume — Signs of Recovery
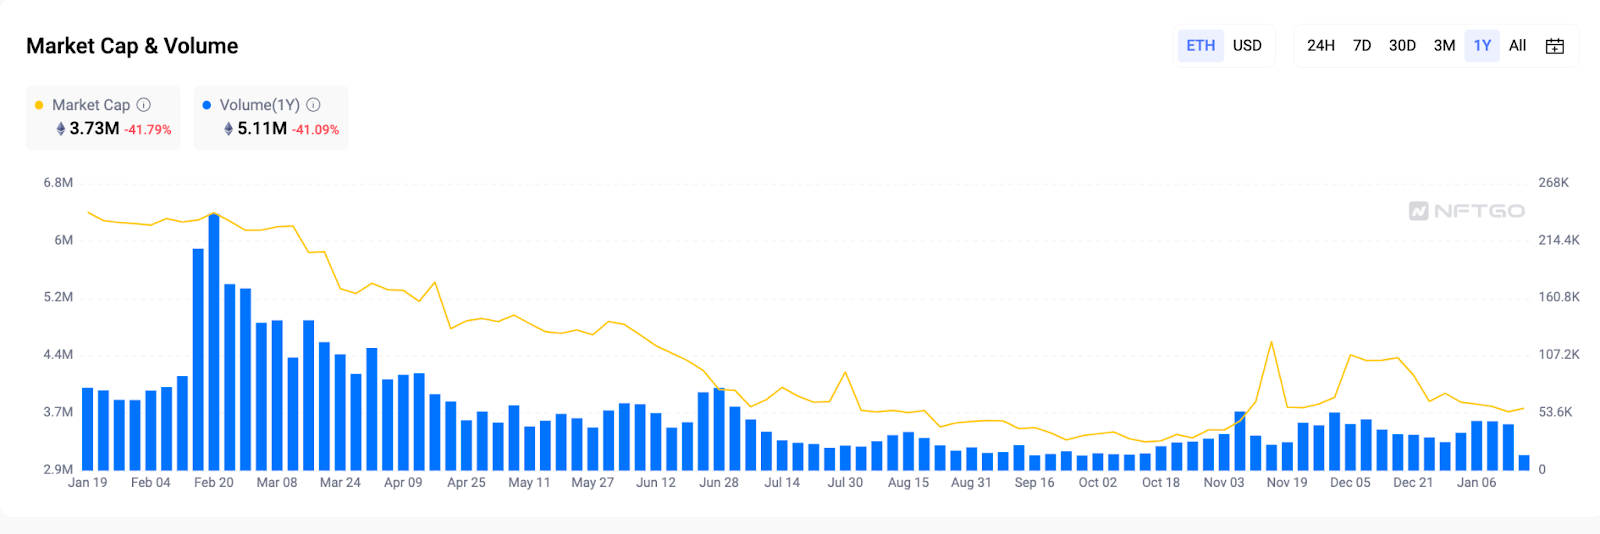
According to data, it’s evident that both market cap and trading volume have decreased as compared to the previous year. Market cap experienced a significant decline, dropping by 41.79% and reaching a low of 3.3 million ETH. Peak trading activity occurred on February 20, with daily trading volume soaring to an annual high of 240,000 ETH. However, this momentum didn’t sustain itself throughout the year. Anticipated updates and releases of games like Legends of the Mara, new series like Azuki Elementals, and DeGods failed to meet community expectations, leading to a cooling of market enthusiasm. As a result, trading volume remained subdued mid-year. Nonetheless, signs of rebound began to appear from November onward.
Blue Chip Index — Continued Blue Chip Dominance

Entering 2023, the expected value of blue chip NFTs underwent an adjustment of about 70%, indicating an overall suppression. However, toward the end of 2023, some persistent signs of resilience appeared as the index rebounded from its low of 4,488 points in October 2023 to 5,000 points by the end of the year. This may indicate that demand for high-quality collectibles still exists.
Looking ahead to 2024, there’s a collection leading the NFT bull market: Pudgy Penguins. The market may oscillate as a result of speculation and be accompanied by temporary volatility spikes.
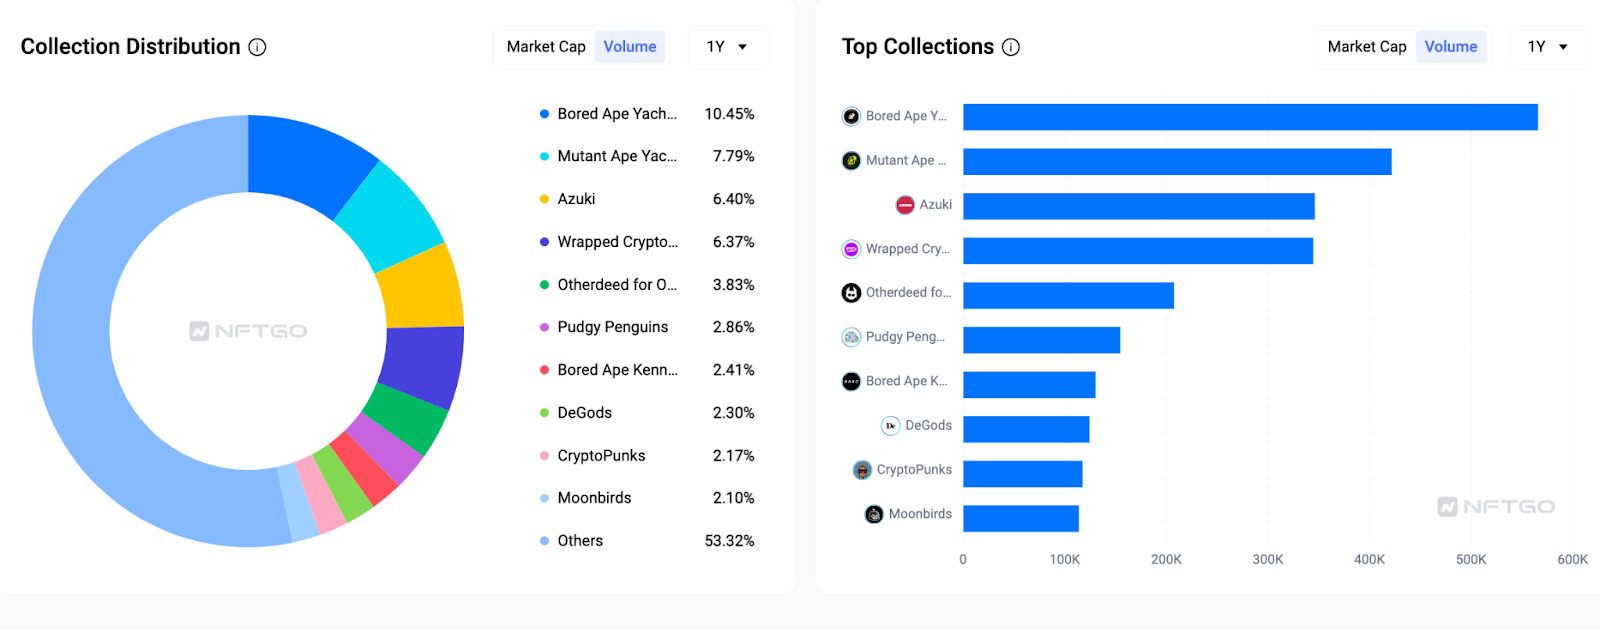
A deep dive into the 2023 NFT trading volume reveals that blue-chip collectibles still dominate the market. Bored Ape Yacht Club (BAYC) alone accounted for 10.45% of the total trading volume, with Mutant Ape Yacht Club and Azuki ranking second and third, respectively. The combined trading volume of the top nine collectibles accounts for nearly 50% of overall trading activity. While new collectibles frequently emerge, data indicates that the most reliable blue-chip NFTs continue to drive the majority of trading activity.
Categories — PFP Remains Key to NFTs
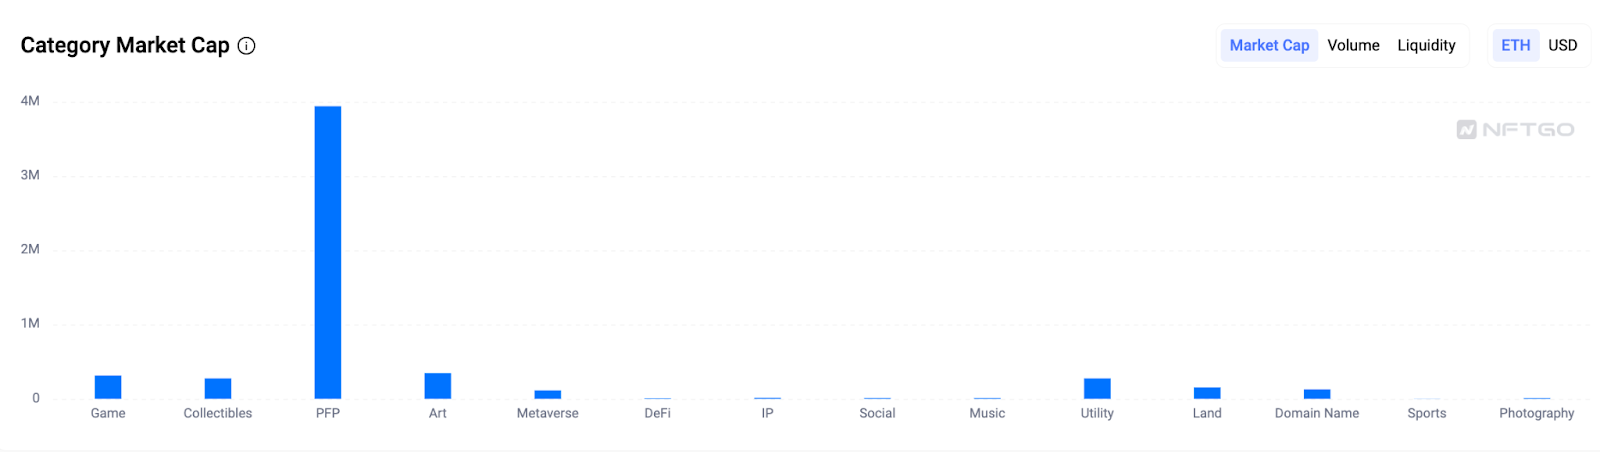
The chart above shows that PFP remains the cornerstone of NFT applications, with a total market value of about 4 million ETH. In contrast, the art category surpasses gaming, collectibles and utility, rising in the NFT space with a market value approaching 500 million ETH. This surge is likely driven by significant advancements in AI, significantly boosting the market. Additionally, domain categories have become more prominent in the NFT space since last year.
PFP will continue to be the cornerstone of the NFT industry, providing a foundation for various NFT collectibles to expand their influence. Notable developments include Yuga Labs launching new games, innovative collections and elements introduced by Azuki and DeGods, and the collaboration between Pudgy Penguins and Walmart.
The integration of AI technology injects new momentum into the industry, promoting an increase in video and generative art NFTs. Looking ahead to 2024, we expect to see more innovative efforts to further activate the market.
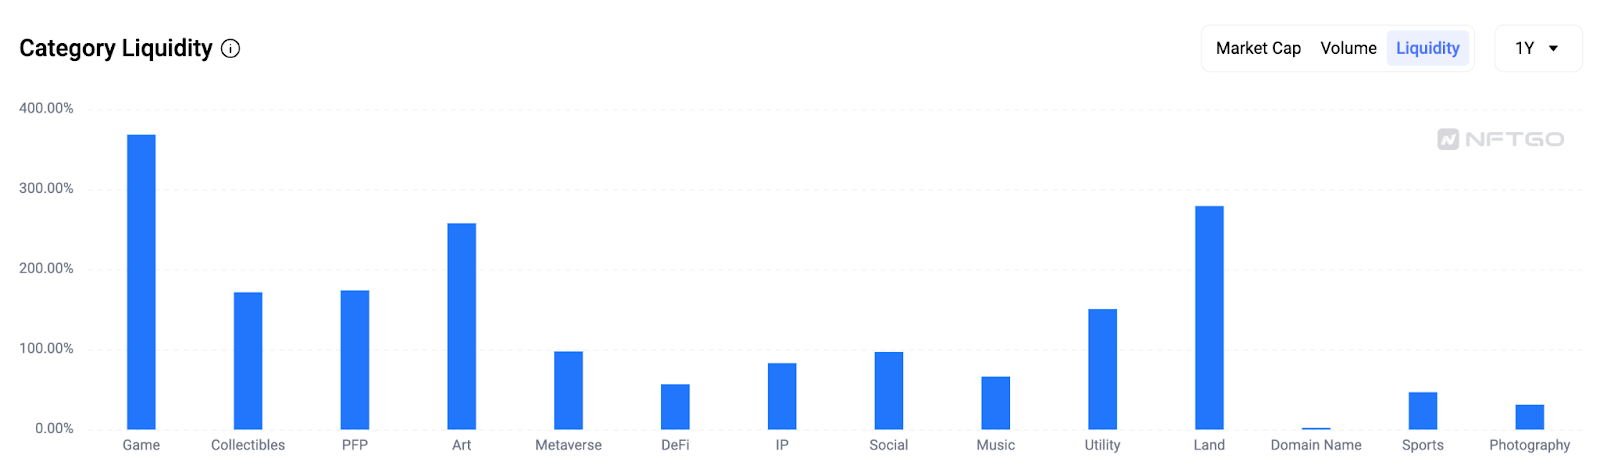
The gaming category has the highest liquidity, having risen by about 380%. The issuance of NFTs for classic games like OVERWORLD INCARNA and Pixelmon further activates the market. Liquidity in the art and land categories is also significant, both of which exceeded 200% of other categories.
Holders and Traders — From Volatile Markets to Stable Markets
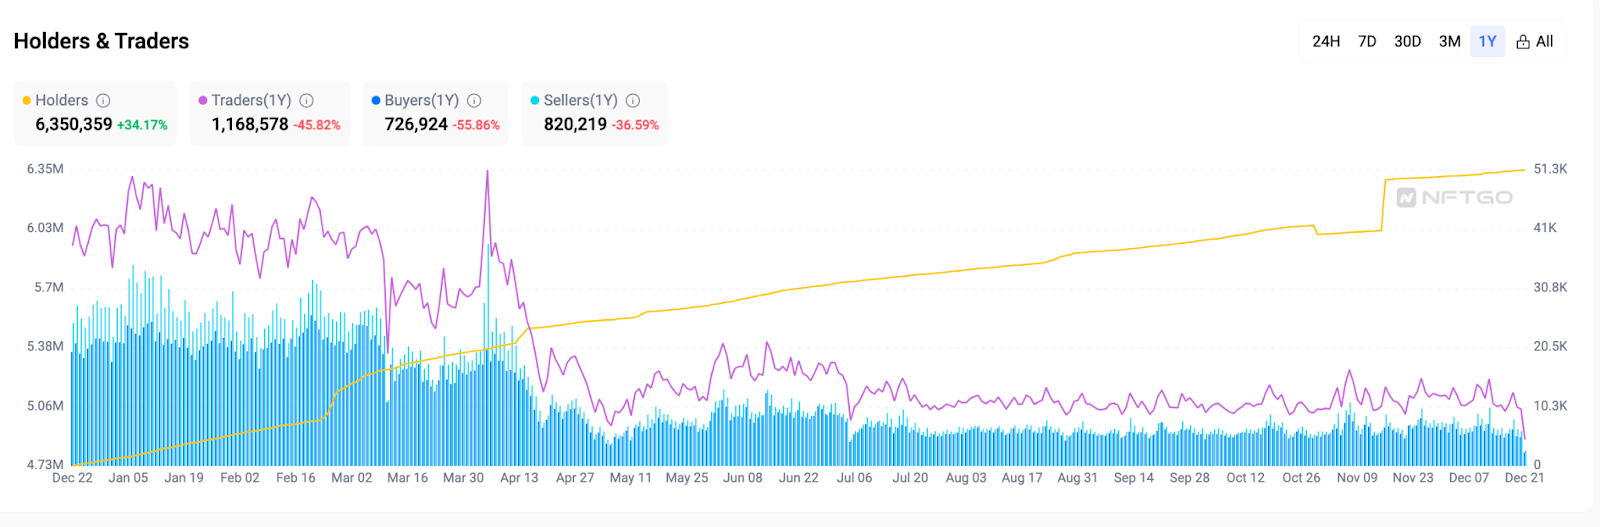
As 2023 came to a close, the NFT market experienced less volatility as compared to the previous year. The first four months were characterized by increased activity. NFTGo's data shows a decrease in overall market activity in 2023, while active traders decreased significantly, down 47.51% from 2022. Despite this decrease in trading activity, the number of NFT holders saw significant growth, increasing by 132.44 over the previous year and reaching a total of 6.42 million.
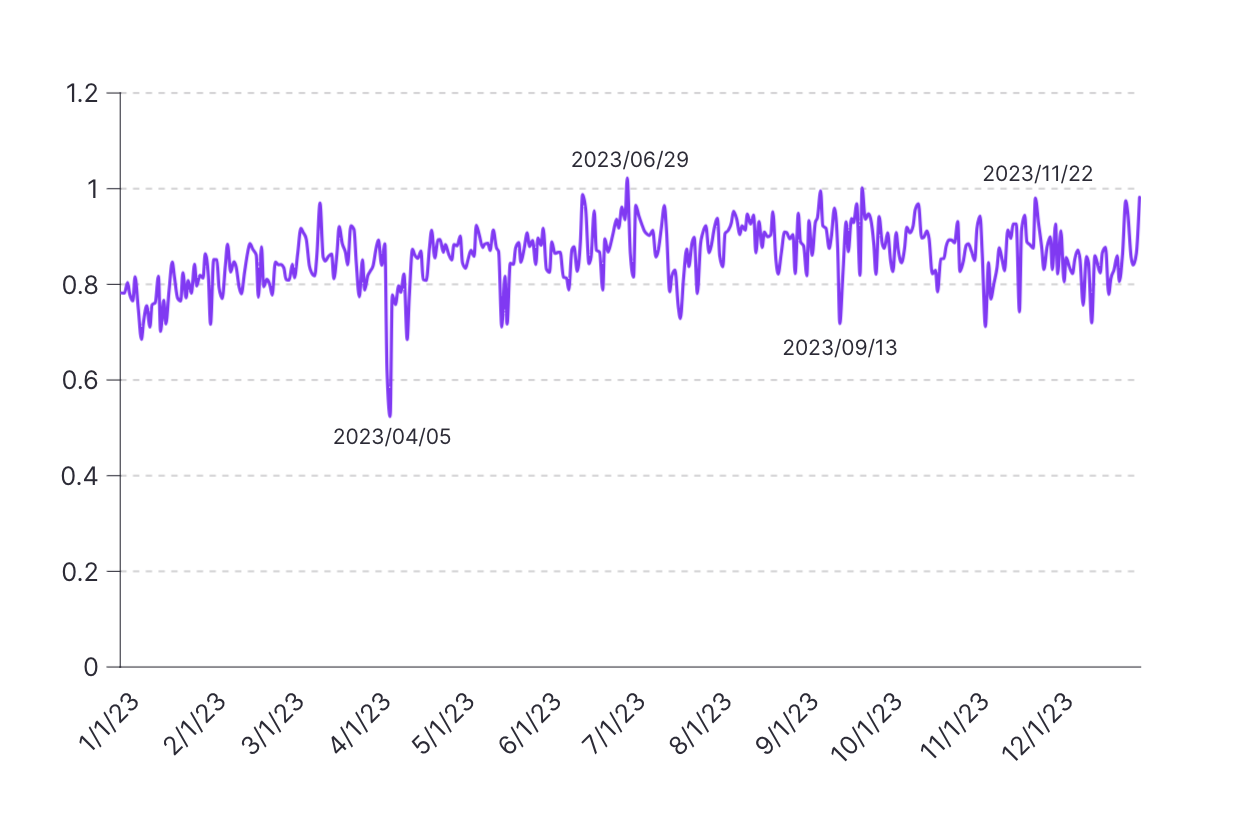
The above data shows that the ratio of daily buyers to sellers in 2023 ranged from 0.52 to 1.02, with an overall average of 0.85, indicating a relatively balanced market between buyers and sellers. September had the highest monthly average ratio (0.92), indicating the upcoming "Uptober."
NFT Market — Blur vs. OpenSea: Who Wins?
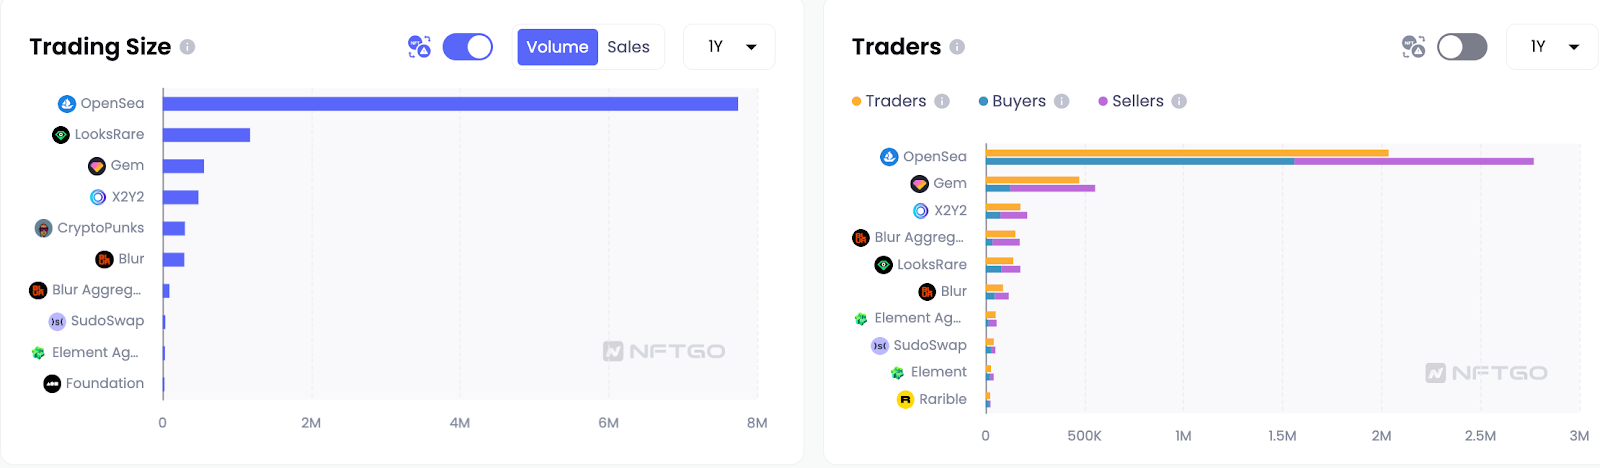
In 2022, OpenSea dominated the market with a trading volume of 7.74M ETH, six times higher than its next competitor. However, Blur, a newcomer, saw explosive traffic growth after its release in October 2022, surpassing OpenSea's daily trading volume by December.
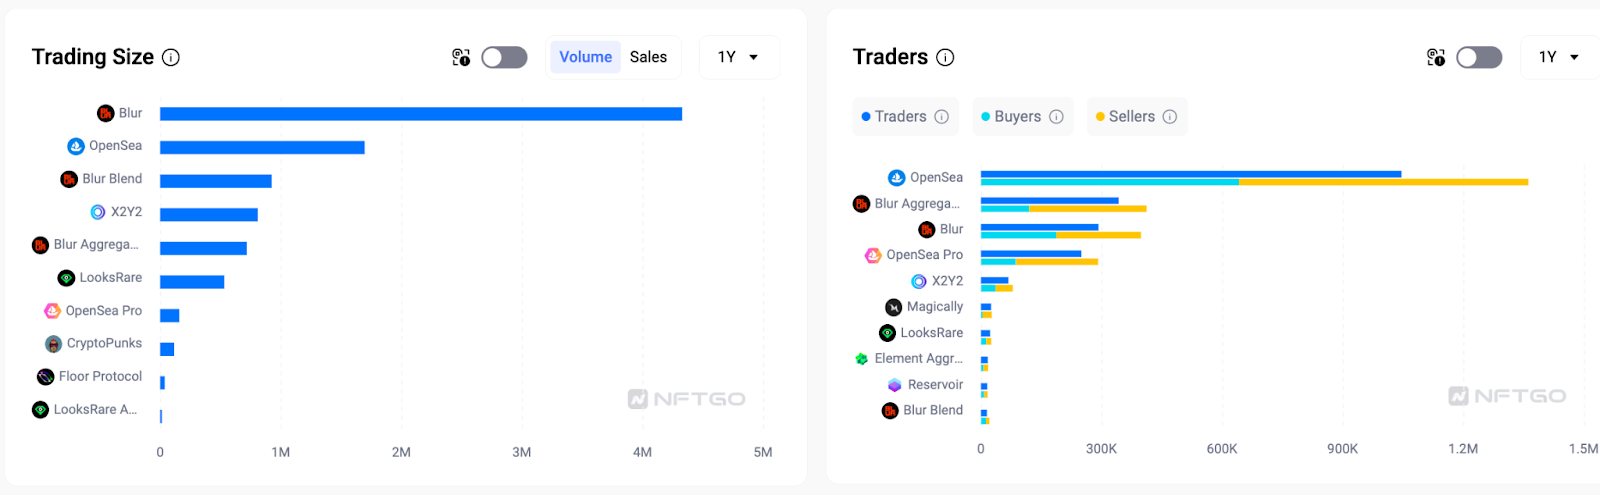
This growth continued more steadily in 2023, with Blur accumulating a total trading volume of 4.33M ETH, 2.5 times that of OpenSea's 1.7M ETH. However, OpenSea maintained its lead in terms of sales volume with 7.9 million, compared to Blur's 4.1 million. This suggests a higher average transaction value on Blur.
In the past month, Blur has had 292,000 active traders, including 187,000 buyers and 210,000 sellers. OpenSea had a total of 642,000 buyers and 719,000 sellers, but Blur attracts more high-value whale traders.
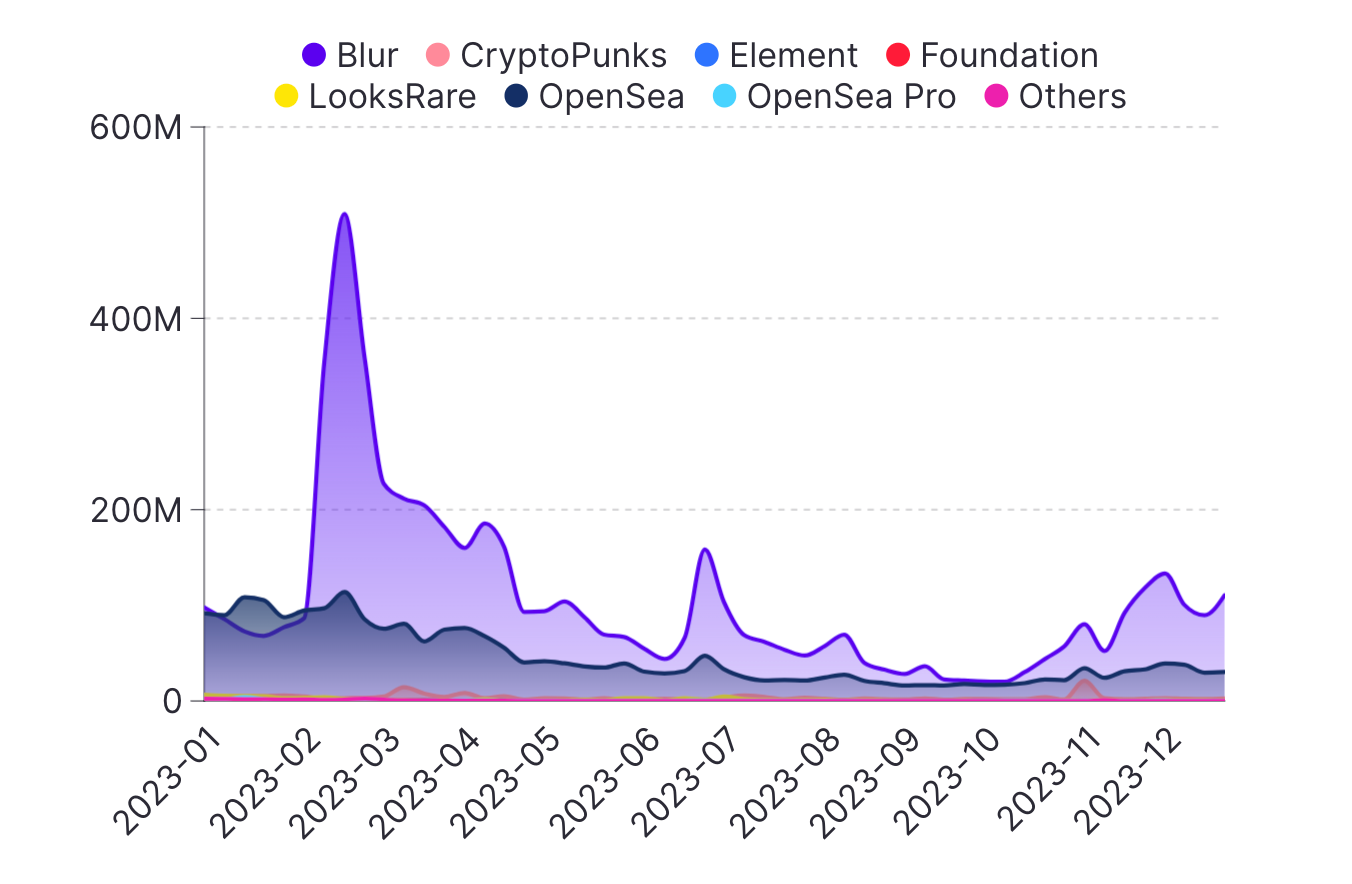
Key factors contributing to Blur's growth include its zero platform fees, token incentives and features catering to professional traders, such as bulk purchasing. Traders are more inclined toward markets with features like multi-chain trading, highest liquidity and security.
Solana and BTC — Emerging Markets in 2024
Overall trading volume and number of traders have significantly increased over 2023, indicating a growing interest in Solana NFTs. Weekly total trading volume between the two markets increased from approximately $1.5 million at the beginning of January to over $11 million by the end of December. The number of active weekly traders increased from about 80,000 to over 110,000 during the same period.
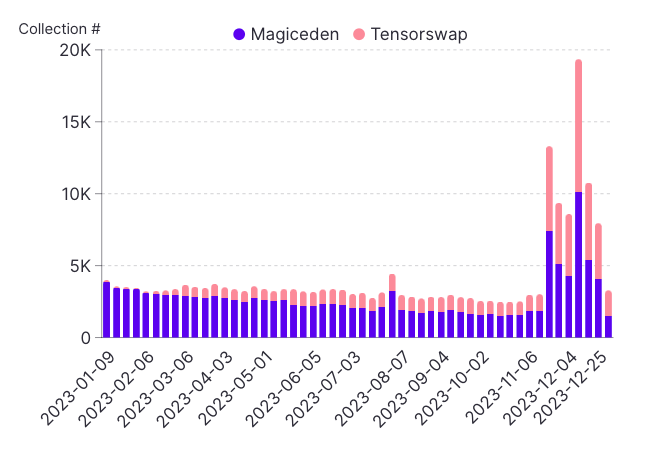
The number of unique collections traded weekly increased from around 5,000 in January to over 15,000 in December, indicating a growing diversity of NFTs traded on Solana.
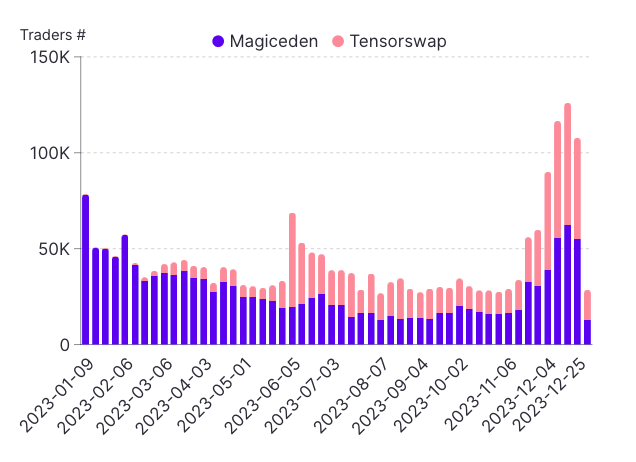
Meanwhile, the number of active traders of NFTs on Solana surged in 2023, with total weekly traders on Magic Eden and TensorSwap more than tripling from January to December and surpassing 100,000 by December.
Average weekly transaction size decreased over the year, from approximately $850 in January to $550 in December, with Magic Eden’s average transaction size consistently larger than that of TensorSwap.
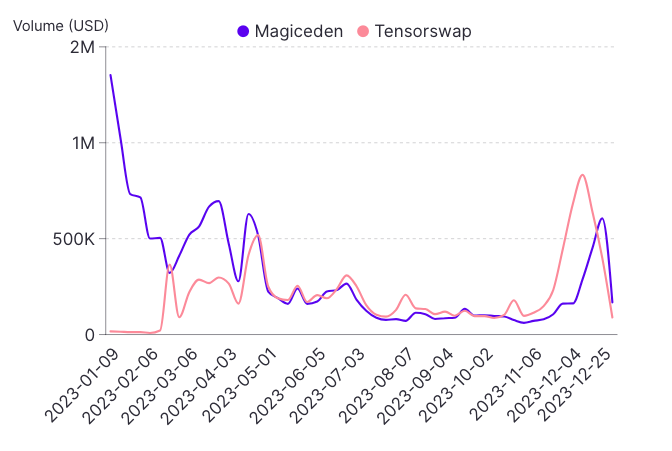
Although Magic Eden accounted for the majority of trading volume and traders, TensorSwap saw growth in Q4 2023. Magic Eden's share of total weekly trading volume decreased from 90% in the first quarter to 60% in the fourth quarter, while TensorSwap's share increased from 10% to 40%. This indicates increasing competition between the two markets.
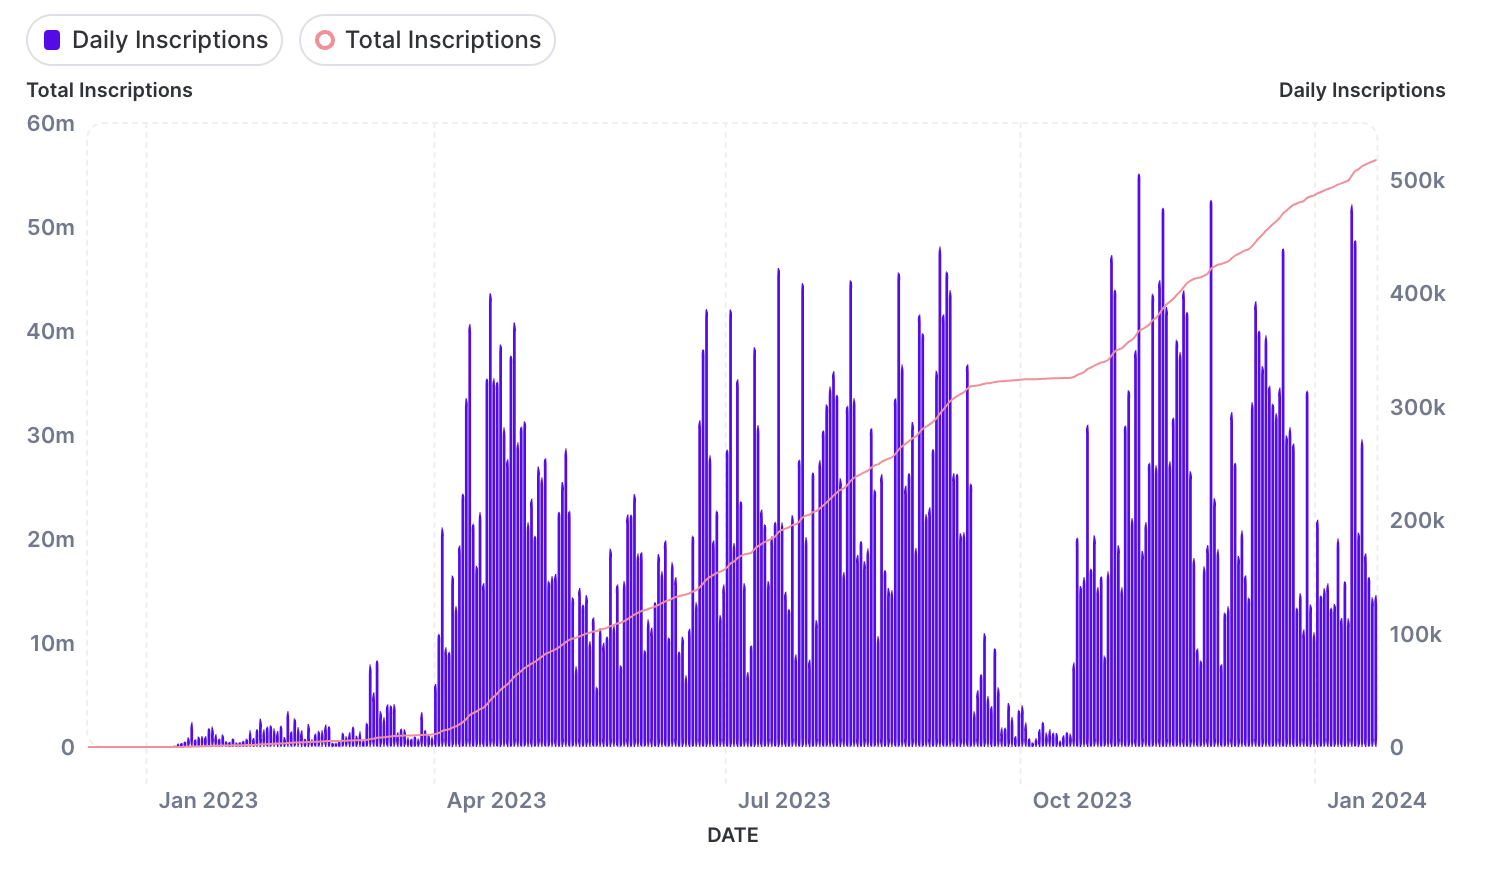
In 2023, Ordinals disrupted the industry with innovative inscription concepts, gaining attention from all investors. Since January 2024, the total number of inscriptions has exceeded 56 million. As shown above, from April to September 2023, there was a period of significant growth as most markets began to support Ordinals and the BRC-20 token standard. Although the number of daily inscriptions temporarily decreased in October, a series of favorable market conditions, such as the launch of UniSat's Brc20-swap, contributed to the recovery.
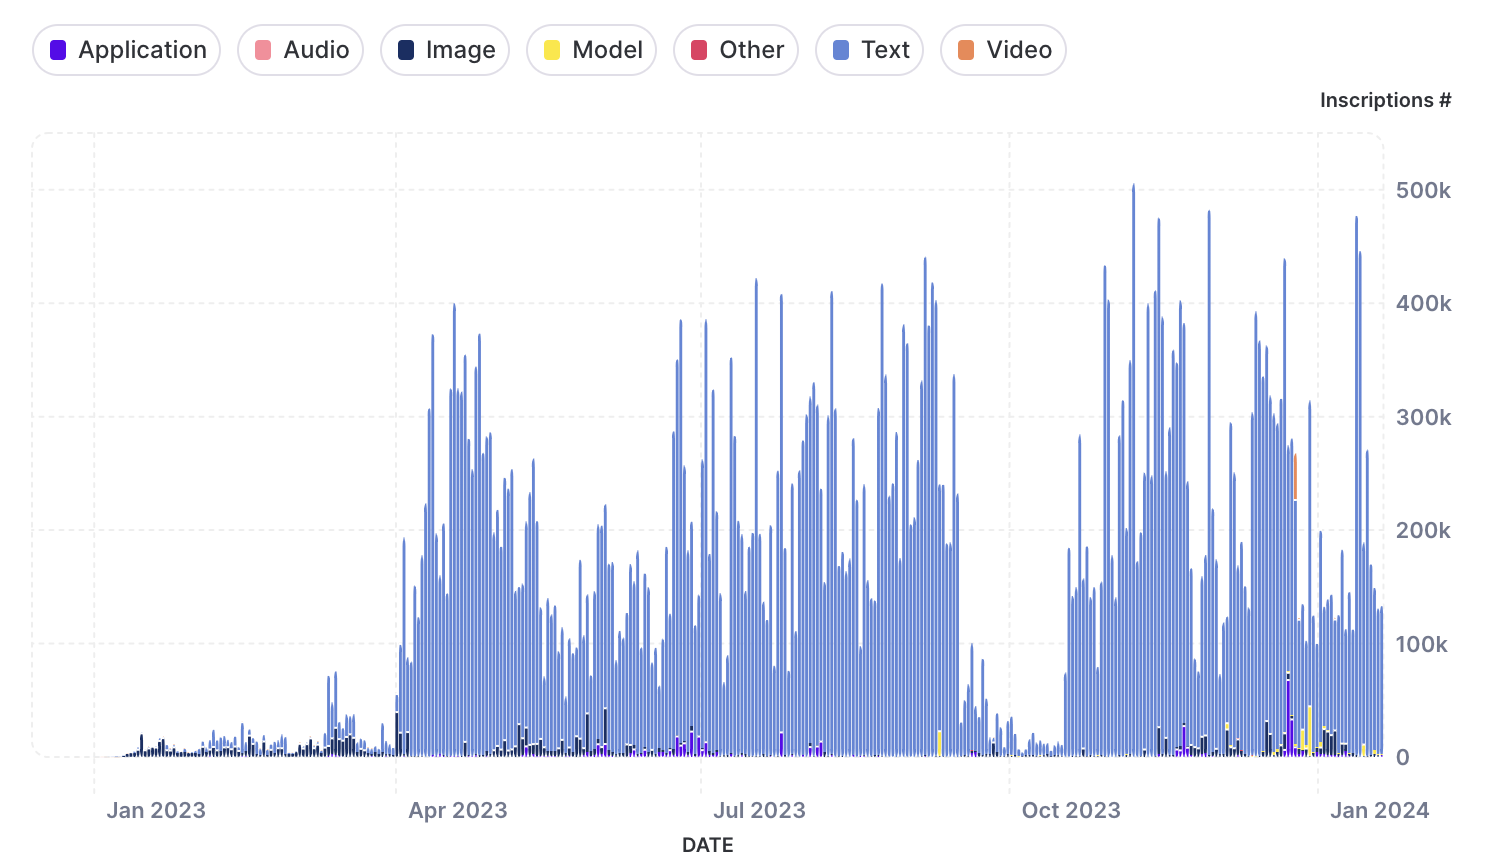
Types of Ordinals. Source: Dune Analytics
Initially, Ordinals were primarily used for images. However, with the development of the market and the introduction of BRC-20, the lack of file format restrictions in Ordinals made it possible to embed JSON files (mainly text formats) into BTC. With the help of a Indexer, BRC-20 can replicate functionality similarly to ERC-20, including minting and asset transfer. This progress has made text the most popular type of Ordinals, accounting for nearly 90% of daily inscriptions. It’s noteworthy that the number of text inscriptions periodically exceeded 400,000.
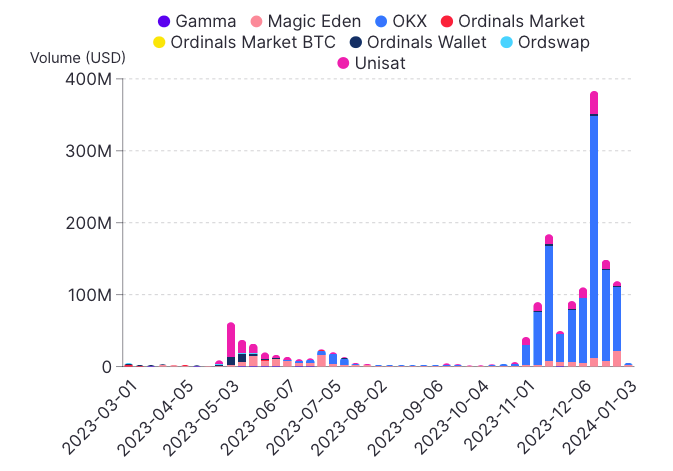
Market development is closely related to the progress of Ordinals. UniSat marks an important milestone in this development. Over time, major exchanges such as Bybit began listing the $ORDI token, significantly increasing trading volume. As of January 2024, over $1.8 billion worth of transactions have been executed, highlighting the strong growth of Ordinals and their increasing market acceptance.
NFT/ETH Ratio — Unique Resilience of the NFT Market
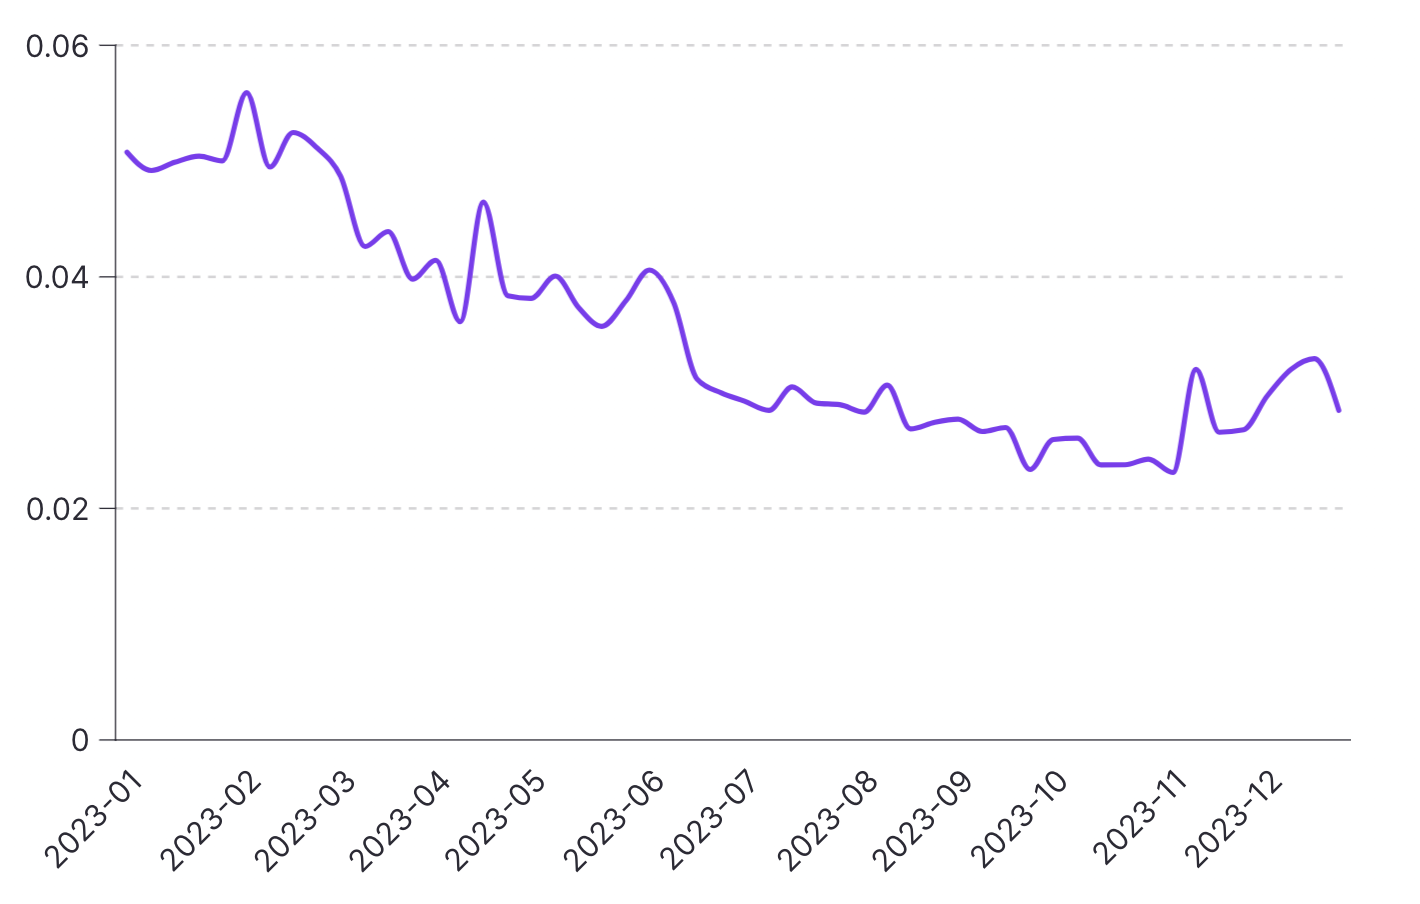
Since the beginning of 2023, Ethereum has been at historic lows, and the floor price of NFTs has remained relatively low. It’s noteworthy that the ratio peaked in February, coinciding with Ethereum's lowest price of $1,429 during the year. This indicates that although there’s an overall correlation between the NFT market and the Ethereum market, the NFT space demonstrates its unique stability.
Throughout 2023, the NFT/ETH market value ratio showed a downward trend, decreasing from around 0.06 to below 0.04.
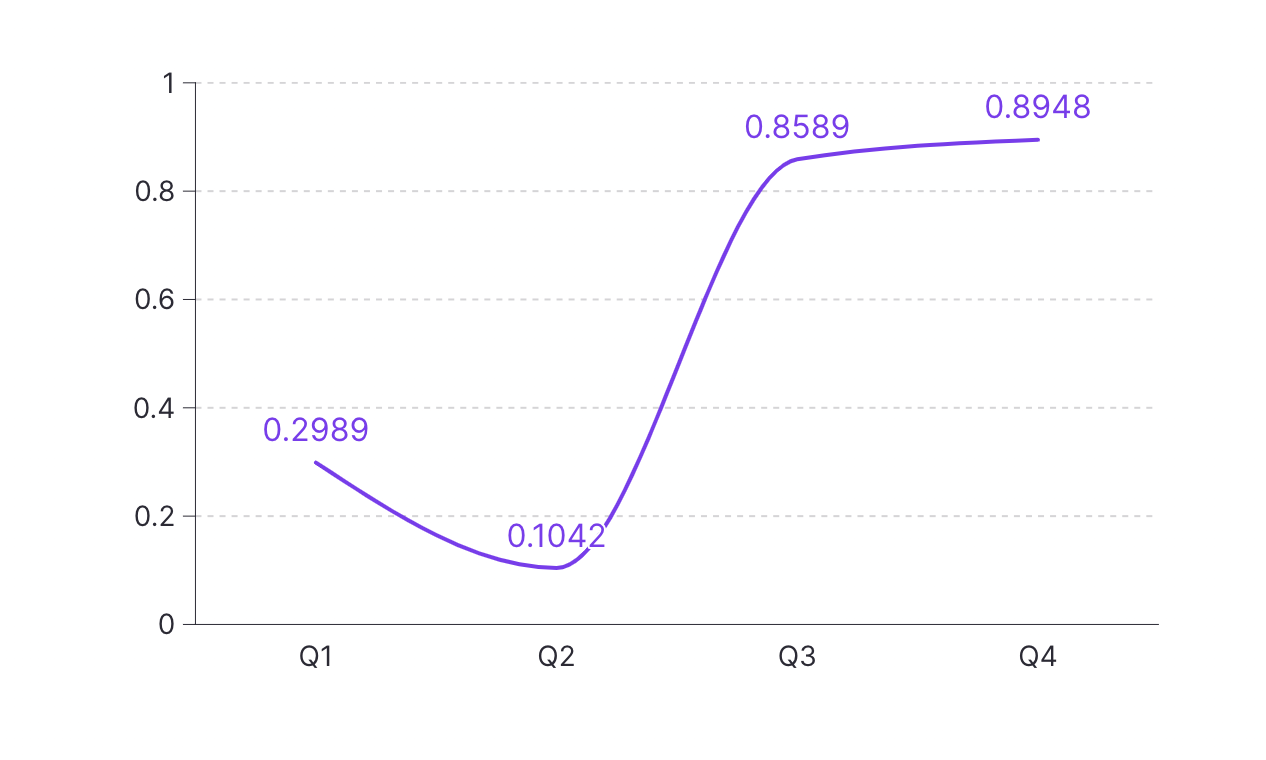
In summary, the correlation coefficient between the two markets in 2023 was approximately 0.6. Lower correlations occurred in Q1 and Q2, when the Ethereum market was sluggish. In Q3 and Q4 of 2023, the correlation coefficient remained stable, exceeding 0.8, indicating that NFTs also tend to show strong trading volume in a more active Ethereum market.
NFTFi Trends — DeGods and MAYC Most Stable
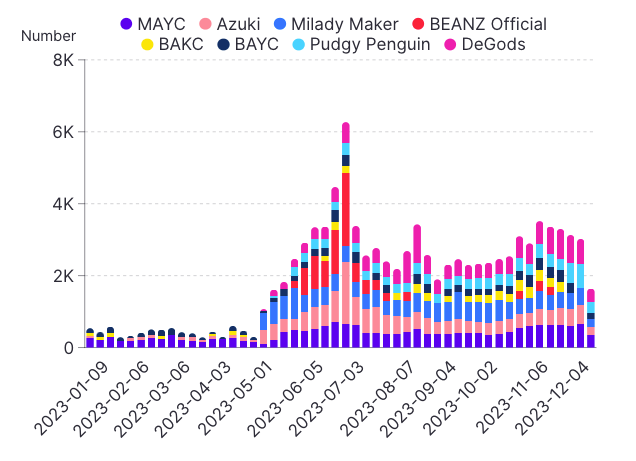
In 2023, the average weekly NFT deposit was around 3,500, sometimes exceeding 5,000. The top 10 collectibles accounted for an average of 30–40% of deposits. DeGods and Mutant Ape Yacht Club were the most stable deposit collections throughout 2023. Azuki also ranked in the top five in most weeks.
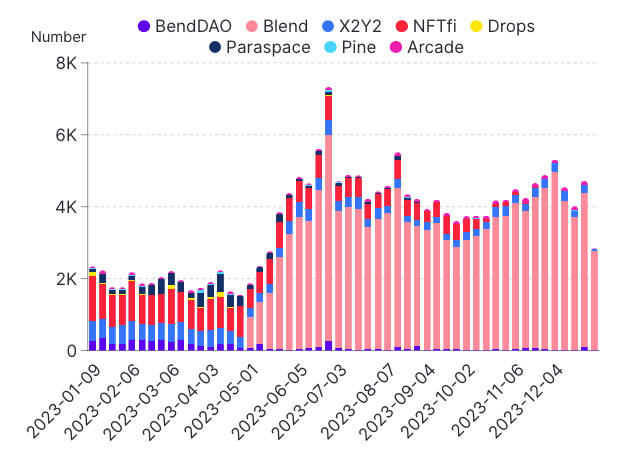
By the end of June, deposits surged, due to increased volatility in the crypto market. If growth continues at the 2023 rate, we can expect average weekly deposits to range from 4,000 to 5,000 in 2024. Some potential peaks may reach over 6,000 deposits per week. Blue chip NFTs are likely to continue to be the preferred deposit choice.
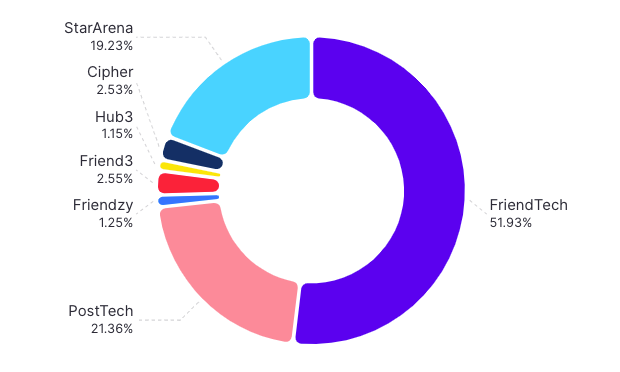
SocialFi — Trending Toward Stability After the Hype
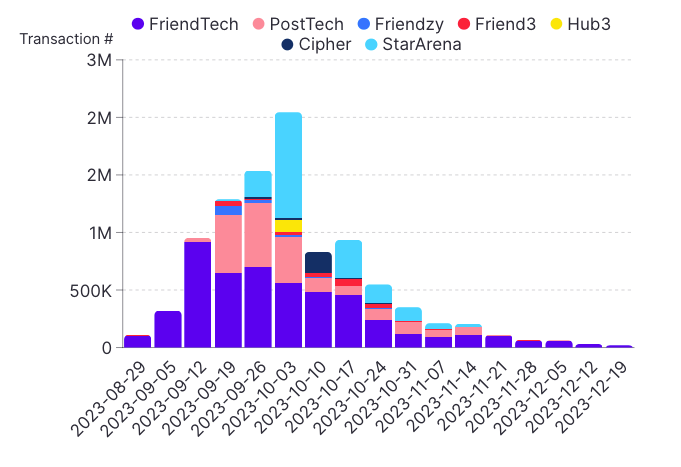
The trading volume data for 2023 shows an active and growing ecosystem on multiple platforms. Daily trading volume fluctuated between 10,000 and 200,000 throughout the year, with the highest volume occurring in September, driven by activities on platforms like Friendzy, StarArena and Hub3.
Although platforms like friend.tech and PostTech maintained relatively stable weekly trading levels, newcomers like Hub3 and StarArena saw more volatility due to increased adoption.
As for 2024 trends, we expect trading volume to continue gradually increasing on existing and emerging platforms. As this field matures, we anticipate SocialFi platforms to see 10–25% growth in annual trading volume levels.
#Bybit #TheCryptoArk