
Bybit x FXStreet TradFi Report: Gold as a safe haven amidst volatility

Key Highlights:
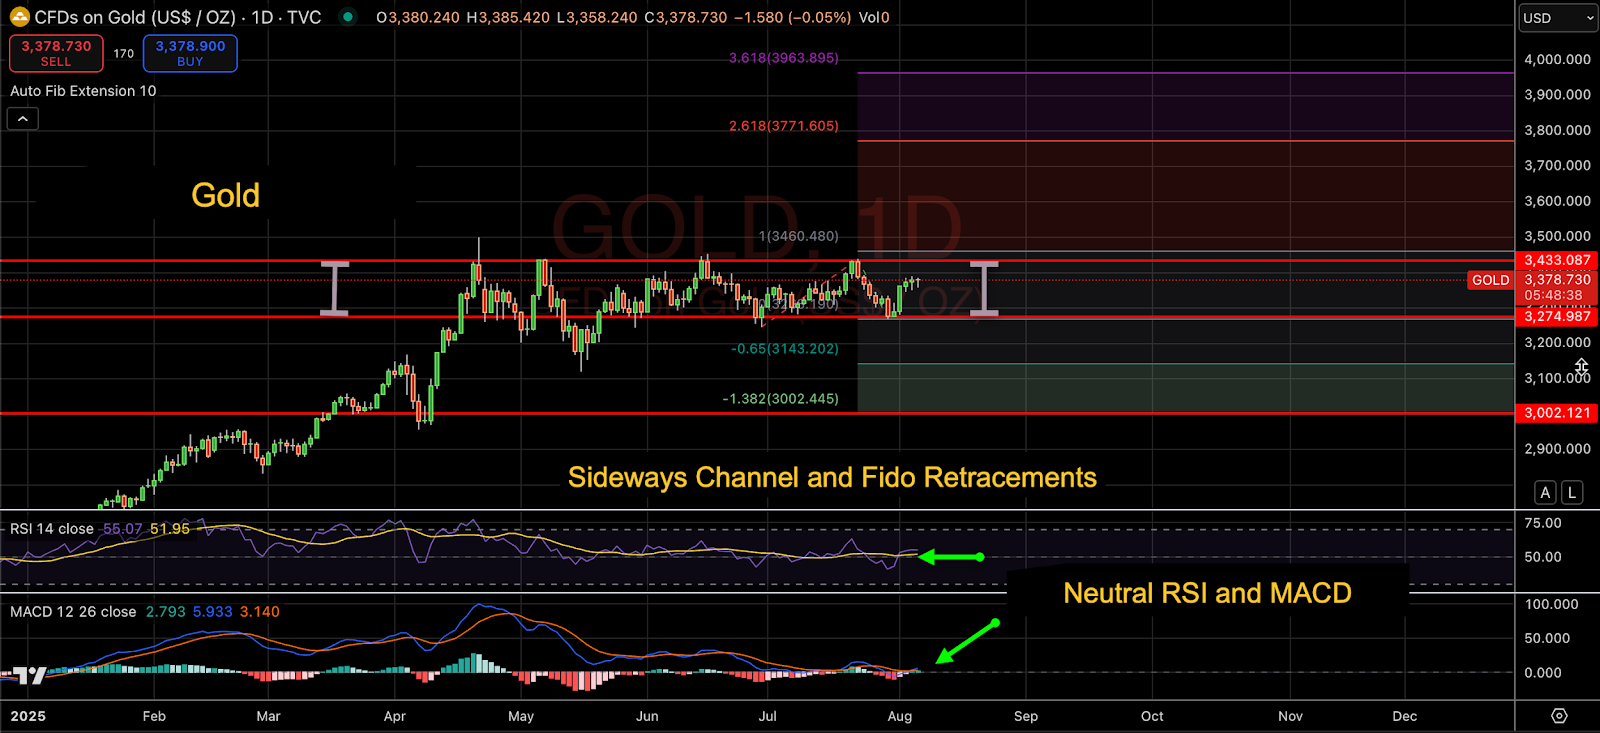
Record high (ATH): Gold reached a record high of $3,500 on April 22, 2025, and is now consolidating around $3,365.
Tight trading channel: Price has been confined between $3,274 support and $3,443 resistance since May 20.
Neutral momentum: Daily RSI is at 50 and MACD is flat, signaling building energy for the next breakout.
Macro calendar: Upcoming tariff deadlines, August 12 inflation data and September 17 Fed decision could spark volatility.
Jobs weakness: Latest NFP report shows sharp hiring slowdown, raising rate-cut expectations.
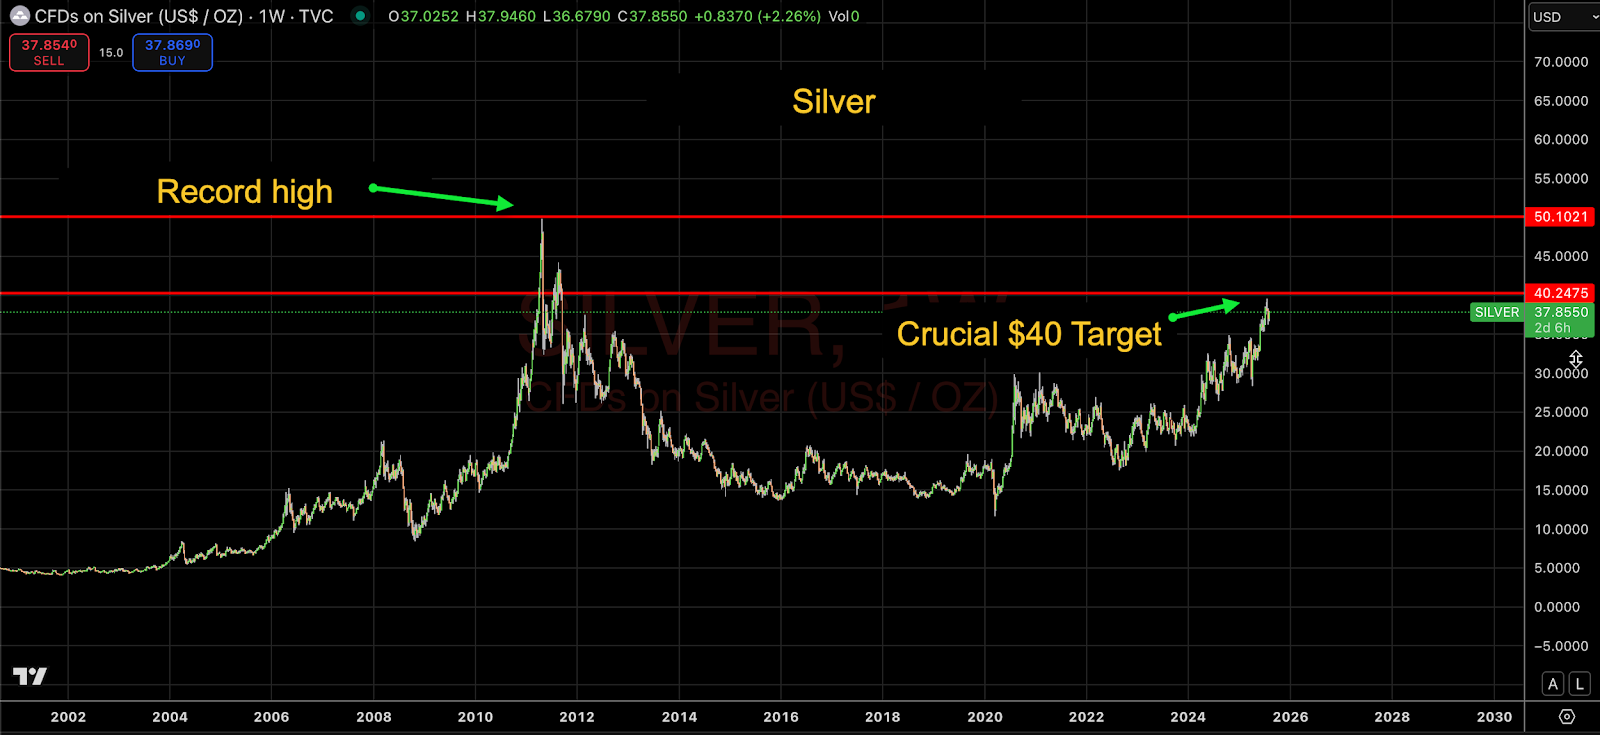
Diversification angle: Silver is $40, with a potential breakout toward its $50 record high.
Trade with Bybit on the gold’s volatility here.
Technical analysis
Gold’s price action has turned highly technical after its surge earlier this year. On March 14, the precious metal broke above $3,000 for the first time before reaching a record high of $3,500 on April 22. Since May 20, gold has settled into a sideways channel, trading between $3,274 support and $3,443 resistance.
This channel has kept volatility subdued, but both RSI and MACD suggest the calm may not last.
The daily relative strength index (RSI) indicator sits at exactly 50, a completely neutral reading. Traders view this as a “comfortable” zone in which neither buying nor selling pressure dominates. However, history has shown that long consolidations around an RSI of 50 often precede sharp moves once the channel breaks.
Gold’s moving average convergence divergence (MACD) has turned flat, confirming the lack of bias. Importantly, it’s now showing its lowest momentum since late 2024, signaling energy is being stored for a larger move.
Together, the RSI and MACD suggest gold is preparing for its next decisive breakout.
Two main trading approaches emerge:
Range trading: Specifically, sell at resistance ($3,443) and buy at support ($3,274). This strategy offers more frequent opportunities, though take-profit targets remain modest.
Breakout strategy: Wait for a confirmed move above resistance or below support. While rarer, this setup often provides larger returns.
For now, gold is offering correction opportunities within the range as well as the potential for a breakout trade as momentum builds.
Future targets
When gold eventually breaks out of its current sideways channel, Fibonacci extensions will provide a clear framework for identifying future targets. Unlike RSI and MACD, which focus on whether the market is overbought or oversold, Fibonacci levels project potential price points that have yet to be reached. This makes them especially valuable when momentum builds after a period of consolidation.
On the upside, the Fibonacci 2.618 extension currently sits at $3,771, while the 3.618 extension lies near $3,953, aligning with the widely anticipated year-end target of $4,000. These levels offer traders medium-term milestones to watch for once resistance has been breached.
On the downside, the first breakout target is found at the –0.65 Fibonacci extension at $3,143, followed by the psychological $3,000 level, signaling more significant corrective pressure. These levels reinforce gold’s dual setup: steady range-trading in the short term, with the potential for sharp moves once the current sideways channel finally breaks.
Source: TradingView
Macro conditions
While technicals are dominating for the short term, macro drivers remain critical for gold’s medium-term outlook.
Tariffs: Most of President Trump’s tariff plan has already been announced, including a 15% tariff on imports from the EU and Japan. The biggest uncertainty remains the US–China trade front as the August 12 deadline looms. Expectations point to another extension, but until clarity emerges, markets will remain cautious.
North American trade: Deals with Mexico and Canada are still pending. Notably, Canada faces a steep 35% tariff, which could weigh on trade flows.
Semiconductor tariffs: These represent another potential trigger, with technology-related duties under discussion.
Beyond tariffs, two key economic indicators are shaping traders’ expectations:
Jobs data: The most recent NFP report showed a sharp slowdown in hiring. A weakening labor market strengthens the case for a Federal Reserve rate cut, as lower employment typically exerts pressure on growth and inflation.
Inflation: The next US inflation report, due August 12, will be pivotal. If inflation cools further, the probability of a September 17 rate cut will rise, fueling gold demand.
Medium-term schedule for gold:
Next two weeks of August: Further tariff announcements
August 12: US inflation report and Chinese tariff deadline
September 5: US NFP jobs report
September 17: Key Federal Reserve interest rate decision
The path into September looks especially crucial, as traders weigh the interaction of tariffs and weaker jobs data with inflation and Fed policy.
Silver outlook
Silver’s strong correlation with gold remains in focus. After lagging earlier in the year, demand for silver has picked up, with its price pressing against the psychological $40 resistance level.
A confirmed breakout above $40 could ignite a surge toward its all-time high of $50, last seen in 2011.
Unlike gold, silver benefits from structural industrial demand, particularly from electric vehicles (EVs) and solar energy systems. This gives silver a hybrid profile: safe-haven asset, as well as cyclical industrial metal.
The combination of safe-haven demand and industrial growth makes silver a valuable portfolio diversification tool, especially as traders seek exposure to both macro stress and recovery themes.
Source: TradingView
Conclusion
Gold is consolidating in a tight channel, with RSI and MACD both signaling a buildup of energy. While the market remains quiet for now, history suggests that a breakout (in either direction) is increasingly likely.
Traders should monitor the following:
$3,274 support and $3,443 resistance levels
August 12 inflation report and Chinese tariff deadline
September 17 Fed meeting, when a rate cut remains a strong possibility
With tariffs still in play, jobs data weakening and inflation concerns, gold continues to hold its safe-haven appeal. Silver, meanwhile, is adding a fresh layer of opportunity as it approaches a key resistance level.
For now, the gold market’s current calm is taking a back seat to the importance of preparing for the next wave of volatility. The stage is set for significant moves in the coming weeks, offering traders strong opportunities.