
Bybit x FXStreet TradFi Report: Crude pressured by rising supply and economic weakness

Key Highlights:
WTI slump: US crude (WTI) is down 12% year-to-date and 20% over the past 12 months
Inventory surge: US stockpiles rose by 11 million barrels since July 2025, with one week showing the largest jump in a decade
OPEC output rising: OPEC added 547,000 barrels per day (bpd) in the latest hike, with potential to unwind another 1.6 million barrels
Demand warning: IEA forecasts supply will far outpace demand through late 2025 and into 2026
Employment slowdown: The weaker US labor market is expected to reduce oil consumption and add to downside pressure
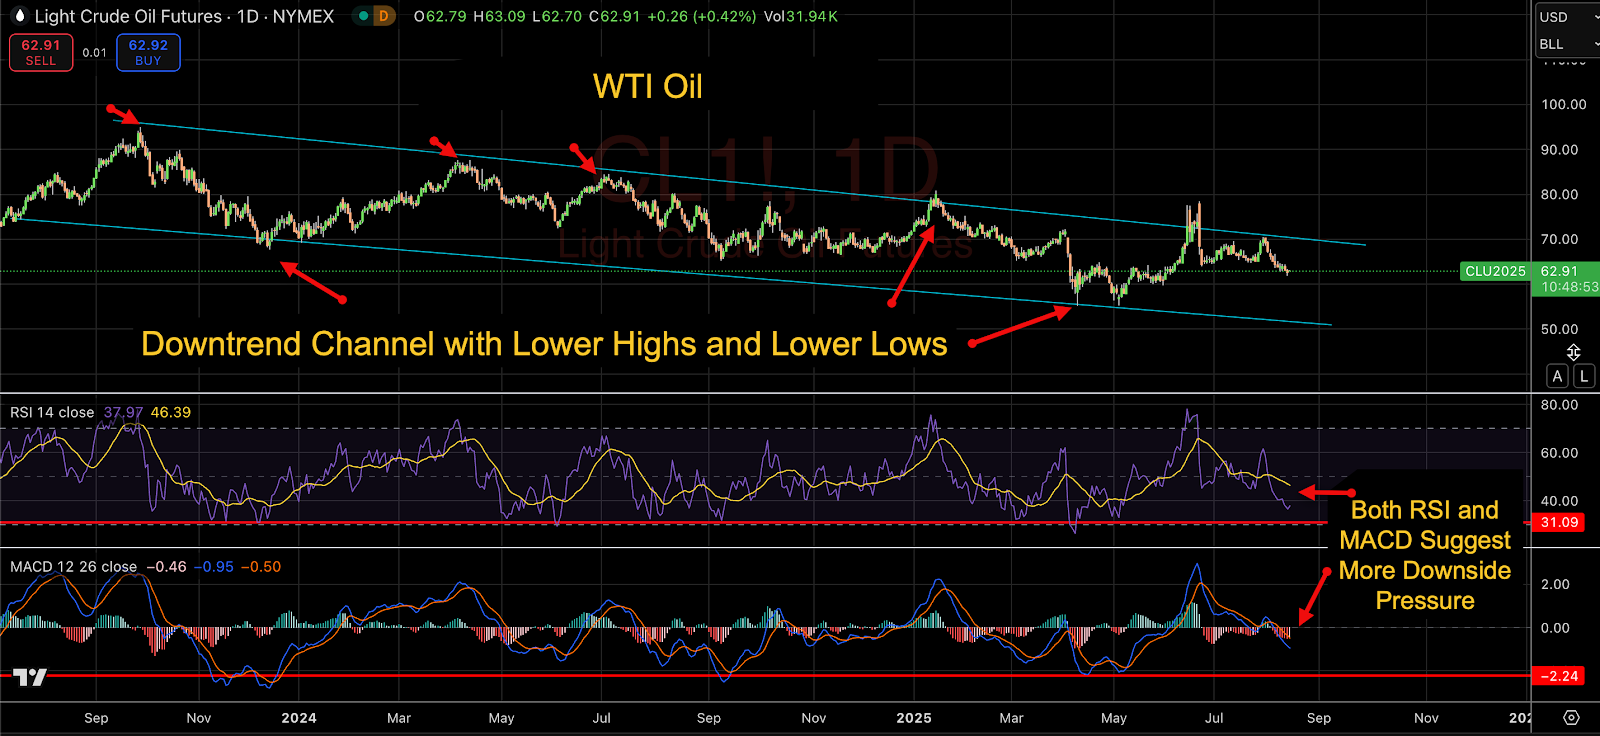
Technical setup: US West Texas Intermediate (WTI) is stuck in a medium-term downtrend channel, with RSI near 38 and MACD confirming negative momentum
Macroeconomic context
Crude oil remains under significant bearish pressure as a combination of weak economic signals and oversupply continues to weigh on sentiment. US WTI crude is currently trading at around $62.80 per barrel, a decline of 12% this year and more than 20% over the past 12 months. Brent crude, the global benchmark, is following a similar pattern, trading near $65.80.
Demand is being driven by global economic health, as key macro signals are weakening:
US job market: The August 1 Nonfarm Payroll (NFP) report showed a sharp slowdown in hiring and a rising unemployment rate
Factory output: Lower industrial activity and reduced transportation needs are leading to less fuel usage, and therefore to lower oil demand
Market psychology: Investors are repositioning around slower growth, rising inventories and potential geopolitical de-escalation
Meanwhile, oil supply, the other side of the equation, is expanding.
US inventory surge
Since July, US oil inventories have risen by 11 million barrels, based on weekly EIA data. In mid-July, the American Petroleum Institute (API) reported a historic weekly surge of 19 million barrels — the largest increase in more than a decade.
The International Energy Agency’s (IEA) August 2025 Oil Market Report warns that the crude market is oversupplied:
“[O]il market balances look ever more bloated as forecast supply far eclipses demand toward year-end and in 2026.” — IEA Oil Market Report, August 2025
The agency now forecasts a surplus of 2 to 3 million bpd, which could lead to an even more substantial buildup in global inventories through 2026.
This confirms that US and global supply is outpacing demand, a fact that’s a key driver of the bearish sentiment.
OPEC production boost
OPEC+ continues to increase supply. In its most recent hike, the group added 547,000 bpd, and more increases are possible.
Traders are now closely watching for:
A potential unwinding of 1.6 million barrels/day output cut
OPEC’s next official meeting on Sep 7, 2025
The US–Russia summit on August 15, which could pave the way for Russian production increases
President Trump’s efforts to increase US oil output, which may trigger further competition from OPEC members
OPEX+’s strategic boost in output appears to be to preserve market share by countering a flood of US supply.
Technical setup
WTI crude is firmly entrenched in a medium-term downtrend that began in September 2023, when prices peaked at $95 per barrel. Since then, WTI crude has fallen 33%, and is currently trading at $62.80.
Source: TradingView
The above chart structure includes:
Lower highs at $87, $84, $79 and $70
Lower lows at $68 and $55
This consistent pattern signals clear bearish sentiment. The price is currently mid-range between support and resistance within the channel.
Momentum indicators offer more insight:
RSI is currently around 38 (oversold), meaning that the downtrend still has room.
MACD remains negative and is hovering above its long-term support at –2.24, showing continued downside pressure.
Key technical levels to watch:
A break below $60 would likely trigger renewed selling toward the channel low at $55.
On the upside, resistance remains firm at $70, a level that must be cleared for any trend reversal
In the absence of a reversal signal or fundamental shift, crude’s current trend is intact and weak.
Medium-term schedule for oil
August 15: US–Russia peace summit (impact on Russian supply outlook)
September 7: OPEC+ policy meeting (potential unwind of 1.6 million bpd cut)
Weekly: US EIA inventory data (short-term trading cues)
Ongoing: Trump energy policy updates and tariff announcements
Geopolitical risk
Geopolitical developments remain a wild card. A truce discussion between the US and Russia over Ukraine could unlock more Russian oil exports, further increasing global supply.
At the same time, President Trump’s push for US energy independence is accelerating domestic output. This could escalate the market share war between US shale oil producers and traditional OPEC players.
If diplomacy leads to improved relations, especially around sanctions or logistics routes, it could act as a fresh supply catalyst. However, any new conflict or disruption in key producing regions may cause a temporary price spike, though the broader trend remains bearish.
Conclusion
Crude oil faces persistent downward pressure, driven by:
Surging US and OPEC+ supply
Weakening global demand, especially in the US
Technical indicators confirming the ongoing bearish trend
Key geopolitical and economic events ahead
Traders should closely monitor:
Inventory data (weekly from the EIA)
The outcome of the August 15 US–Russia summit
OPEC+ decisions during the September 7 meeting
Technical support at $60 and $55
Whether the RSI dips toward 30, signaling possible oversold territory
Crude oil is under pressure, and with momentum turning weak and major events ahead, its price is likely to remain volatile, creating a strong setup for traders who follow trends and/or respond to news. As we move into September, the combination of rising inventories, shifting OPEC policy and key geopolitical dates could drive sharp price swings, offering multiple entry points for active traders.