
How To Avoid a Bear Trap When Trading Crypto

You may have come across the nursery rhyme: “We’re going on a bear hunt. We’re going to catch a big one. What a beautiful day! We’re not scared.”
In the financial markets, “trading a bear trap” is also an attempt to catch a big one. Maybe a bull market suddenly pauses, and markets that were rising begin to reverse. Thinking you’re going to profit handsomely, you sell your crypto, possibly even through short selling in the futures market. Suddenly prices rip higher against you. Better call for help — because you’ve just fallen into a bear trap.
This article will explain bear traps, what they look like specifically in crypto trading and how to avoid them.
What Exactly Is a Bear Trap?
A bear trap is a technical pattern that occurs when a new bearish trend in a stock or cryptocurrency price appears, often with short sellers pushing the market down, only to have a reversal and bounce to a rising price trend.
A short squeeze is similar to a bear trap, although the effect of a short squeeze tends to be more intense in which the prices can be pushed up very quickly in a very short amount of time.
Bear traps can lure traders, especially amateur and novice investors, into a false panic. This may cause them to sell in anticipation of a continuing bearish (downward trending) market. The bear market may not even end up happening, and instead, the market reverses again and heads upward, thus trapping sellers in their short positions. In such a case, you’ll have to exit before this upward bounce moves past the point at which you sold — or possibly risk losing your funds.
Unlike a bull trap, a bear trap is particularly devastating for anyone who has a short position. To review, a short position is when investors borrow a stock, sell it, then buy it back later (hopefully at a lower price), thus capitalizing on a downward market trend. You can typically sell short by using futures on major coins in the cryptocurrency market.
In traditional equity markets, institutions often buy stock in larger volumes on dips, initiating the bear trap price reversal. Besides, they may have initially kicked off the bear trap by short selling at higher levels and then buying back the stock lower. In other words, they pushed the market down as short-sellers. Because their trades occur in larger volumes, these flows have the potential to move the market against retail or amateur investors.
The question is whether this type of bear trap or even bull trap applies in the crypto market. Unfortunately, in unregulated crypto markets, whales can coordinate far easier than traditional regulated institutions. Manipulating markets is also easier because of the lack of liquidity (fewer buyers and sellers deep in the order book).
You only have to watch crypto markets for a few hours to realize that market volatility within cryptocurrency markets is generally far higher than in stock markets. Given the massive swings in crypto, shorting can be very risky. Getting caught in a bear trap can be very painful.
How Does It Happen?
As opposed to bull traps, bear traps may be set by short sellers or larger players seeking to weed out smaller players. Initiating a bear trap can be as simple as a case of institutions selling or short selling their stocks to amateur investors. This offloading causes a dip in markets, which causes less experienced investors to panic and sell.
When prices fall below a certain point, institutions can buy back their shares and send prices higher once again. At this point, the rest of the market starts buying again for fear of missing out (FOMO), catapulting the price higher once again.
In a simpler explanation, institutions push prices lower to make the markets appear to be bearish to increase the demand. When the market appears to be bearish, investors gradually buy the asset at a lower price and wait for the asset’s price to bounce to a higher price.
Indicators to Identify a Bear Trap Pattern
The bull and bear trap is inevitable and it can be tricky to identify when you are trading, but it’s not impossible to identify with technical analysis. Here are some of the technical indicators to help you spot some of these symptoms and to reduce your risks of exposure.
Volume Indicators
Looking at the trading volume can help you identify a potential bear trap.
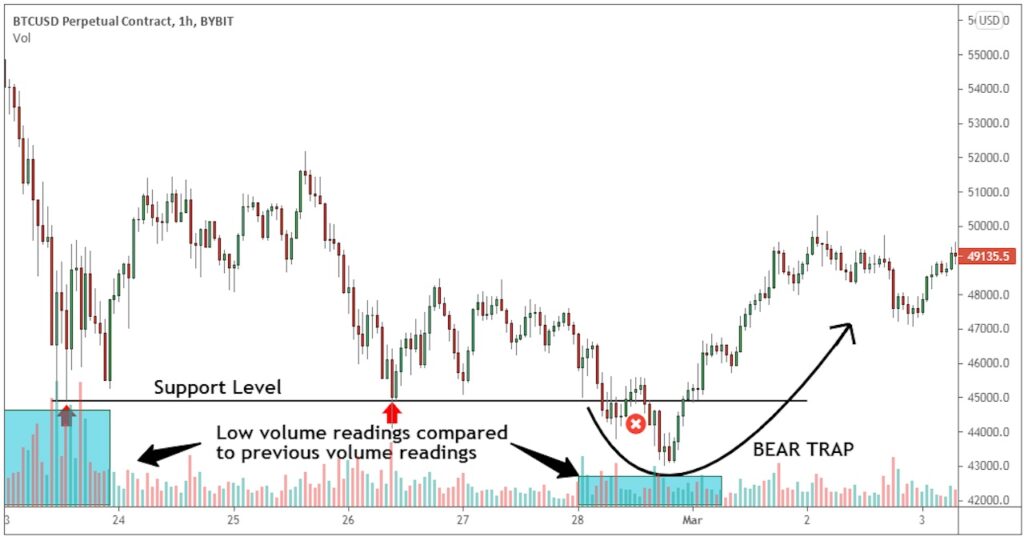
Usually, when the market moves forcefully higher or lower, you might notice high volumes of trading accompanying this movement.
The reason is simple: whether the market is moving strongly upward or downward, traders are either trying to capitalize on opportunities or cover their losses.
However, a downward trend with a low volume of trading indicates a potential bear trap. This could mean that a low number of investors (probably an institution) has sold and caused the price to drop.
Fibonacci Retracements
Fibonacci retracement levels are horizontal lines that indicate where prices can be expected to meet with support or resistance level.

If the price of a stock (or that of a coin in the crypto market) is dropping, but it doesn’t break the Fibonacci levels, you can assume the drop is at least questionable and might not continue.
RSI Indicator
The Relative Strength Index (RSI) indicator is a momentum oscillator to track the speed and change of price movements. An RSI below 25 usually indicates oversold conditions that are ready for a move upward, and an RSI > 75 indicates overbought conditions that are ready for a move downward.
Another tool in bear trap prevention, the relative strength index helps to predict price reversals.

The red trend lines at the bottom of the example show two oscillators, the MACD and RSI. Both of them are trending noticeably upward before the sharp price break.
Bear Trap Example Chart and Pattern
Bear traps can be a bit harder to spot in the crypto chart patterns than in the stock market. With no central governing body, institutions don’t have to disclose any of their trading information. Therefore, you can only track the market closely to identify where a bear trap may have occurred.
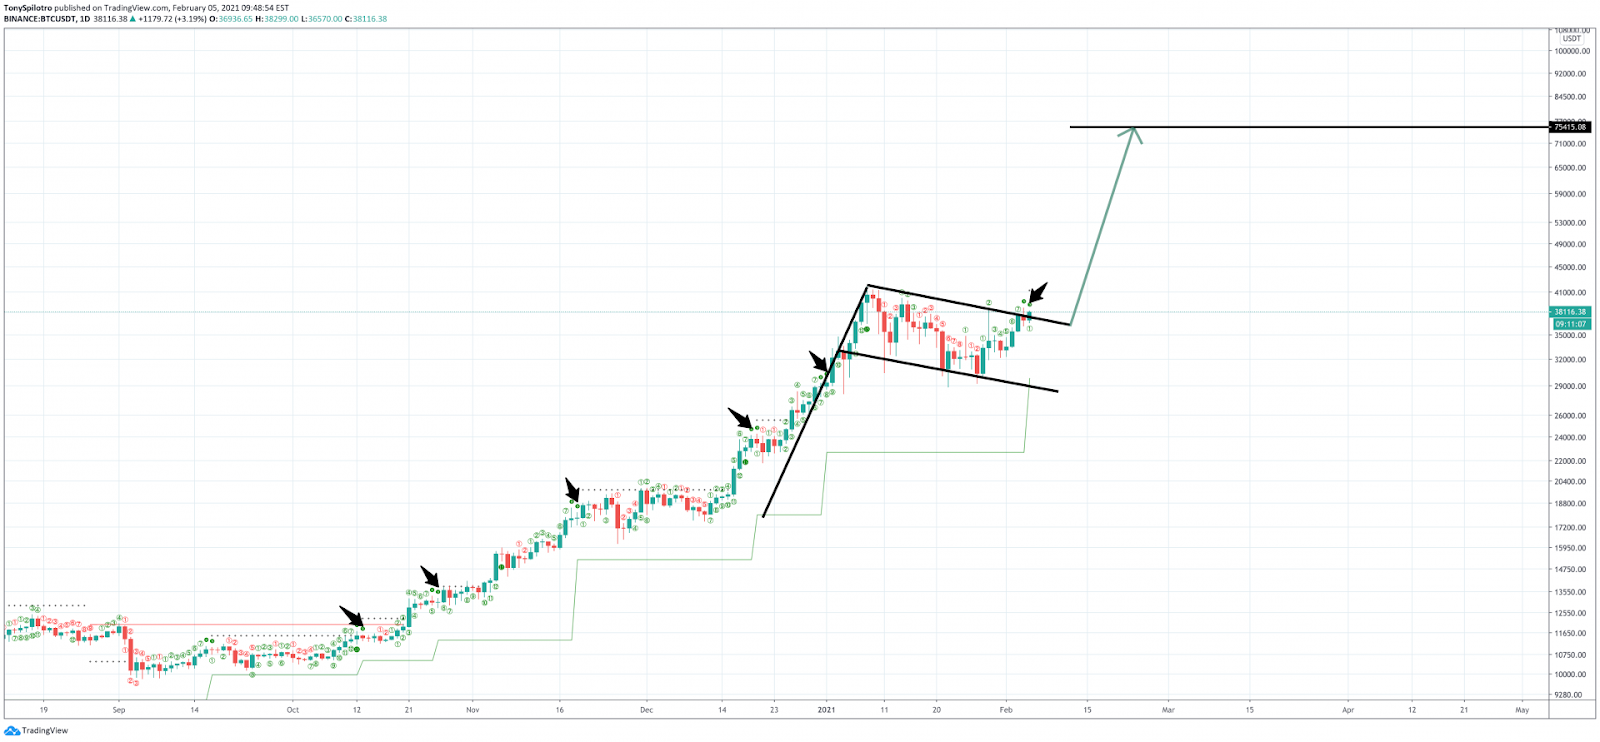
Take a look at the Bitcoin price chart below. In it, you can see an example of a bear trap prominently at the end, demarcated by lines downward and then the reversal upward.
CC: Bitcoinist
The markings show a TD sequential indicator (designed by Thomas DeMark, sometimes called a DeMarker or DeMark indicator, or DeM) signaling tops and bottoms. They also show the beginnings of several bear traps.
In early 2021, the price of Bitcoin was continuing its steady rise. Then prices plunged by nearly $11,000 in just 32 hours. As the chart shows, the trend quickly reversed. Toward the end of February and into early March, the price again rose, nearly $10,000 in a matter of days. These bear traps were set several times before the market hit an all-time high of $63,558 in mid-April. If you were caught up in the bear traps, fearing a market correction, you might have sold BTC to prevent loss. Those coins then would have tripled in value over the next three months.
Whales have been using these bear traps to first shake out the weak hands and secondly, to set the stage for the next bullish run. Prices in any market don’t move in a straight line, but there is a natural ebb and flow to the price movement. In an uptrend, retracements tend to be fast-paced and it’s not easy to identify them because they can be mistaken for a reversal.
Bear traps can happen across any time frame, even intraday. They can look like a short squeeze, where there is initially a sharp drop, potentially from selling pressure, followed by a trend reversal. Bear traps are the opposite of bull traps, which occur when a seemingly upward trend resumes its previous downturn.
Why Do Bear Traps End with Rallies?
Bear traps often end with rallies in part because of a short squeeze, in which short-sellers are buying back, potentially because institutions are buying in larger sizes. Short-term traders capitalizing on the falling market have decided to take profit, and buyers also step in.
This is compounded by more investors realizing that the uptrend is not just a dead cat bounce in price, which is usually brief. As more buyers pile in, the rally gains momentum.
How to Trade with a Bear Trap
In crypto, bear traps are a common pitfall. Consider your risks before making any trades, particularly before taking short positions. You can try to spot a bear trap and trade with the broader trend, taking profits before reversals. Timing is key.
Another strategy is to get out of bear traps as soon as you discover them. One way to do this is to place a stop-loss order that can trigger as soon as you see an upward reversal. When trading crypto, you need to be nimble in order to avoid getting caught on the wrong side of the trade.
Price Action
Technical traders can avoid bear traps and can identify them in real-time by reading the price action. Usually, technical indicators can’t guarantee that you’ll be able to avoid the bear trap. However, price action is a great tool to identify these patterns.
Most of the time the perfect bear trap is set up when there is a sudden and sharp price movement against the bullish trend. The inner workings of this price action behavior are easy to understand.
The sharp price movement to the downside produces the trap because it scares the traders. Usually, at this stage the price action deepens below a key level — support level, big round number, moving averages or other technical indicators.
But, the trap often leads to a sharp rally.
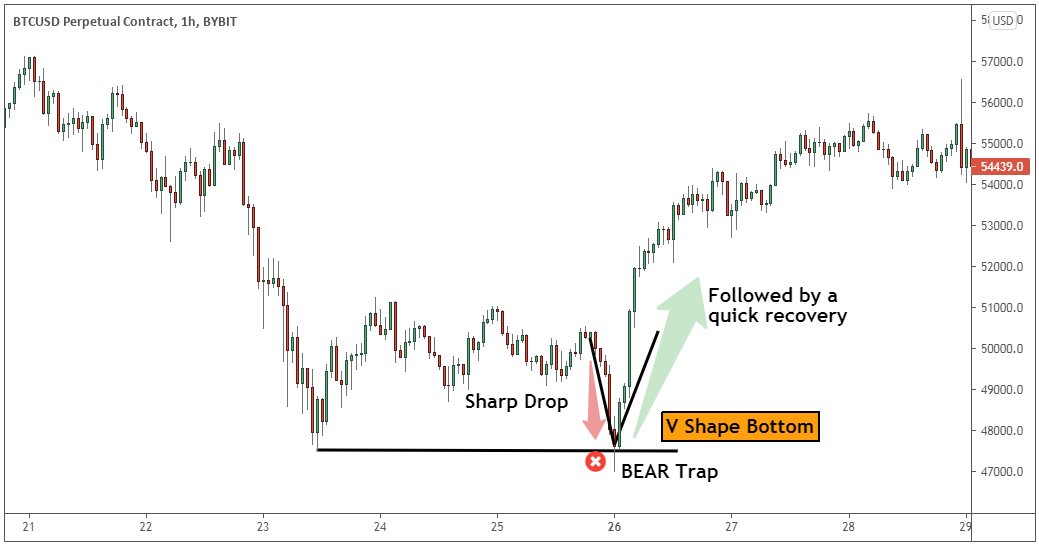
If you study the price action, the perfect bear trap will develop in two stages:
- A sudden and sharp drop in price
- The sharp drop in price is often followed by a sharp recovery, leaving behind a “V” shape type bottom.
Risk of the Trap
The risk of bear traps is that you sell too late and have to buy back at a higher price because of the short-term and ongoing rally that is likely to occur after the decline. If you short into a bear trap and don’t hedge your risk, you will have to cover your short when the price goes up and take your losses.
For example, you see a decline in the market so you take a short position at $50. If the shares go down to $40, you can cover your short and make $10; but if the market goes back up to $60 and is on an uptrend when you buy back your short you’ll lose $20.
How to Avoid a Bear Trap
First of all, you can try to spot a bear trap using the volume or technical indicators described. The simplest way to avoid the most painful bear trap is to avoid shorting, which can cause large losses when the market moves higher.
If you do trade a short position, set a stop loss and also understand your risk. Determine how much of your portfolio you can risk based on your tolerance, and size your position accordingly.
In illiquid markets where not as many players are involved, bear traps occur more often. Avoiding illiquid markets is one way to avoid bear traps.
Risk management in general is the best way to manage any trades. Even seasoned investors don’t win every time. Don’t risk more than you’re willing to lose, and be methodical about cutting losses when you’re wrong.
The Bottom Line
Trading is inherently risky, particularly in crypto. You might fall prey to a bear trap at some point. The trick is to learn from the experience, minimize losses, and get back on track. If you’re going on a bear hunt you might get caught off guard, but try to react quickly to avoid getting stuck.