
12 Best MT5 Indicators a Trader Should Know to Trade Crypto

Highlights:

In the realm of MT5, traders have access to an array of powerful indicators that enhance analysis and improve decision-making processes. One such indicator is the Fractal Adaptive Moving Average (FRAMA). Designed to adapt dynamically to market volatility, FRAMA stands out in the toolkit available on MT5 for crypto trading. This indicator adjusts its sensitivity based on price fluctuations over a period, providing traders with crucial insights into trend strength and potential reversals.
MetaTrader 5 (MT5) is one of the most widely used platforms for trading a variety of financial instruments, including cryptocurrencies. With its user-friendly interface and suite of powerful in-built indicators, MT5 helps traders analyze market trends, identify potential reversals and pinpoint support and resistance levels. These tools make it easier to make smart decisions in real time.
This guide lists the top MT5 indicators that every crypto trader should know, and explains why they’re essential for boosting profits and managing risks in the fast-paced world of cryptocurrency trading.
Key Takeaways:
MT5 offers a variety of built-in and customizable indicators that help traders analyze trends, spot buy/sell signals and manage risks effectively in the volatile crypto market.
MT5 built-in indicators, such as Fractal Adaptive Moving Average, Market Facilitation Index and Money Flow Index, provide accurate, non-lagging signals essential for timely trading decisions. These tools improve decision-making by combining trend analysis, momentum detection and volatility measurement.
With judicious use of MT5 indicators, traders can create comprehensive strategies to capitalize on market shifts, increasing their chances of success across different trading styles and time frames.

What Are MT5 Indicators?
MT5 indicators are technical analysis tools used on the MetaTrader 5 platform to spot trends, analyze market data and generate trading signals. They assist traders in making guided decisions about when to enter or exit trades across different financial instruments.
Uses of MT5 Indicators
MT5 is a versatile platform for cryptocurrency trading, offering a range of built-in and customizable indicators that help traders make smarter decisions. These indicators help identify the best times to buy or sell, analyze market trends and improve risk management. Effective use of MT5 indicators empowers traders to sharpen their strategies and increase their chances of success in the dynamic crypto market.
A key use of MT5 indicators is trend analysis. Indicators like moving averages (MAs) are essential for spotting market direction. Traders can track the crossover between fast- and slow-moving averages to determine when to enter or exit a trade. For example, when a fast-moving average crosses above a slow-moving one, it could signal an uptrend, encouraging traders to buy. On the flip side, a downward crossover might indicate a potential downtrend, suggesting it’s time to sell. These signals help traders align their decisions with market trends, improving their chances of making profitable trades.
MT5 also features oscillators, such as the relative strength index (RSI) indicator and the moving average convergence divergence (MACD) indicator, which are valuable for spotting overbought or oversold conditions. For instance, an RSI above 70 suggests an asset might be overbought, while a reading below 30 signals it could be oversold. Such indicators help traders time their trades more effectively, reducing the risk of false breakouts and improving overall risk management.
Strategizing With Flexibility
By combining different MT5 indicators, traders can create a well-rounded trading strategy. For example, pairing the MACD for trend direction with the RSI for momentum and a volatility indicator for market conditions gives traders a comprehensive view. If the MACD shows a bullish crossover and the RSI indicates an oversold condition, this alignment could signal a strong buying opportunity in a market that looks set to rebound.
MT5 indicators are adaptable across different time frames, making them suitable for all trading styles — whether you’re a scalper, day trader or long-term investor. Short-term traders can focus on faster indicators with minute charts, while long-term traders might rely on daily or weekly charts to capture larger market trends. This flexibility is key in the fast-moving world of crypto, where market conditions can shift quickly.
Using MT5 indicators offers numerous benefits for crypto trading:
- Enhanced decision-making: Indicators provide objective data that helps traders make the right plays, reducing emotionally influenced trading.
- Customization: MT5 supports the creation of custom indicators tailored to specific trading strategies, which gives traders added flexibility.
- Multi-asset capability: MT5 indicators can be used for more than just cryptocurrencies, and are also applicable to forex, stocks and commodities, providing for versatility.
- Automated trading: Traders can use indicators to develop automated trading systems, ensuring consistent strategy execution without emotional interference.
- Comprehensive analysis: By combining various indicators, traders can perform thorough market analysis, increasing their chances of successful trades.
Best MT5 Indicators for Crypto Trading
MT5 offers a variety of indicators with features that can help traders navigate the complexities of crypto trading. These built-in indicators use real-time data and advanced analysis tools to give traders an edge in a constantly shifting market.
Fractal Adaptive Moving Average (FRAMA)
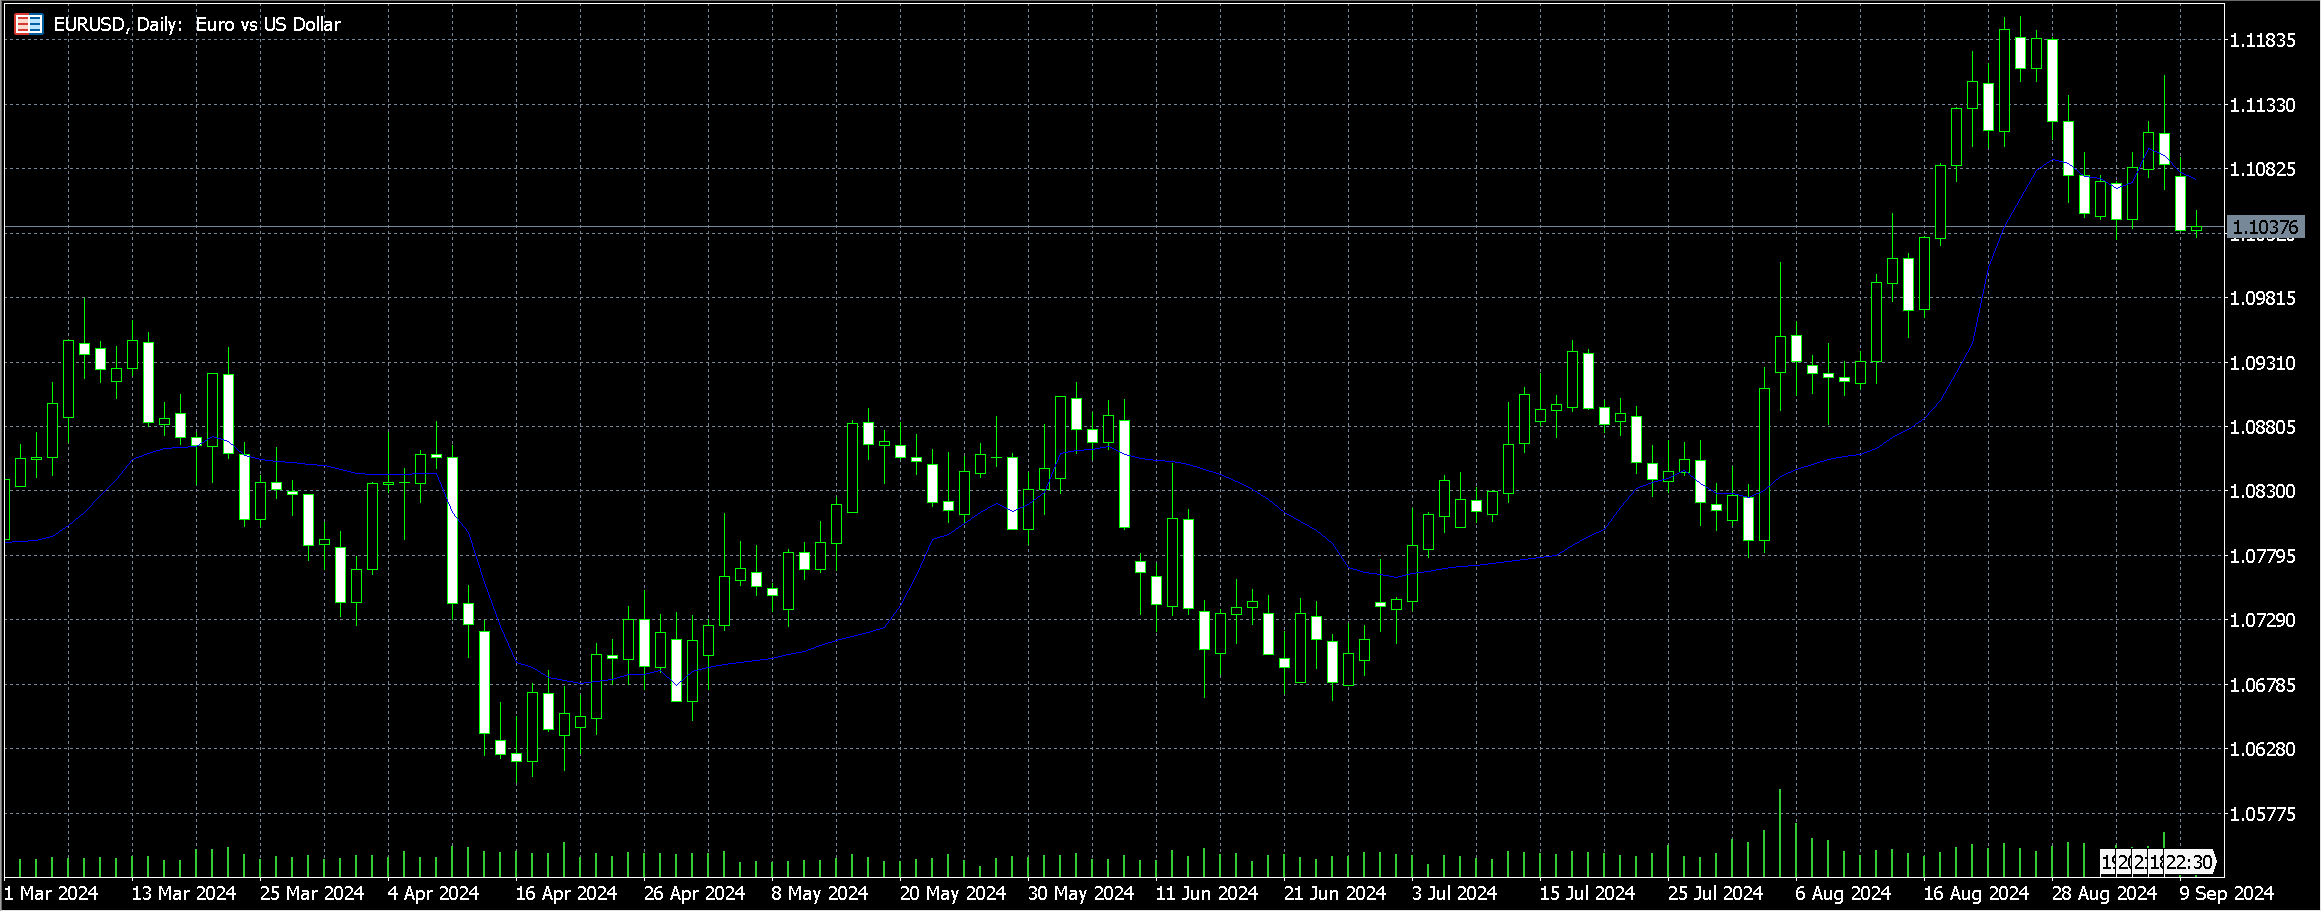
The Fractal Adaptive Moving Average (FRAMA) is designed to adjust to market volatility by changing its sensitivity based on price fluctuations. Using principles from fractal geometry, FRAMA calculates average price over time, which helps it effectively capture trends in frequently erratic cryptocurrency markets. This indicator is adept at closely following price movements during strong trends, while staying flat when the market is ranging.
By adapting to changing market conditions, FRAMA generates buy and sell signals, helping crypto traders pinpoint potential entry and exit points. Its ability to smooth price data while remaining responsive to rapid shifts makes it an invaluable tool for navigating the volatile crypto landscape, improving both trend detection and risk management.
Triple Exponential Moving Average (TEMA)
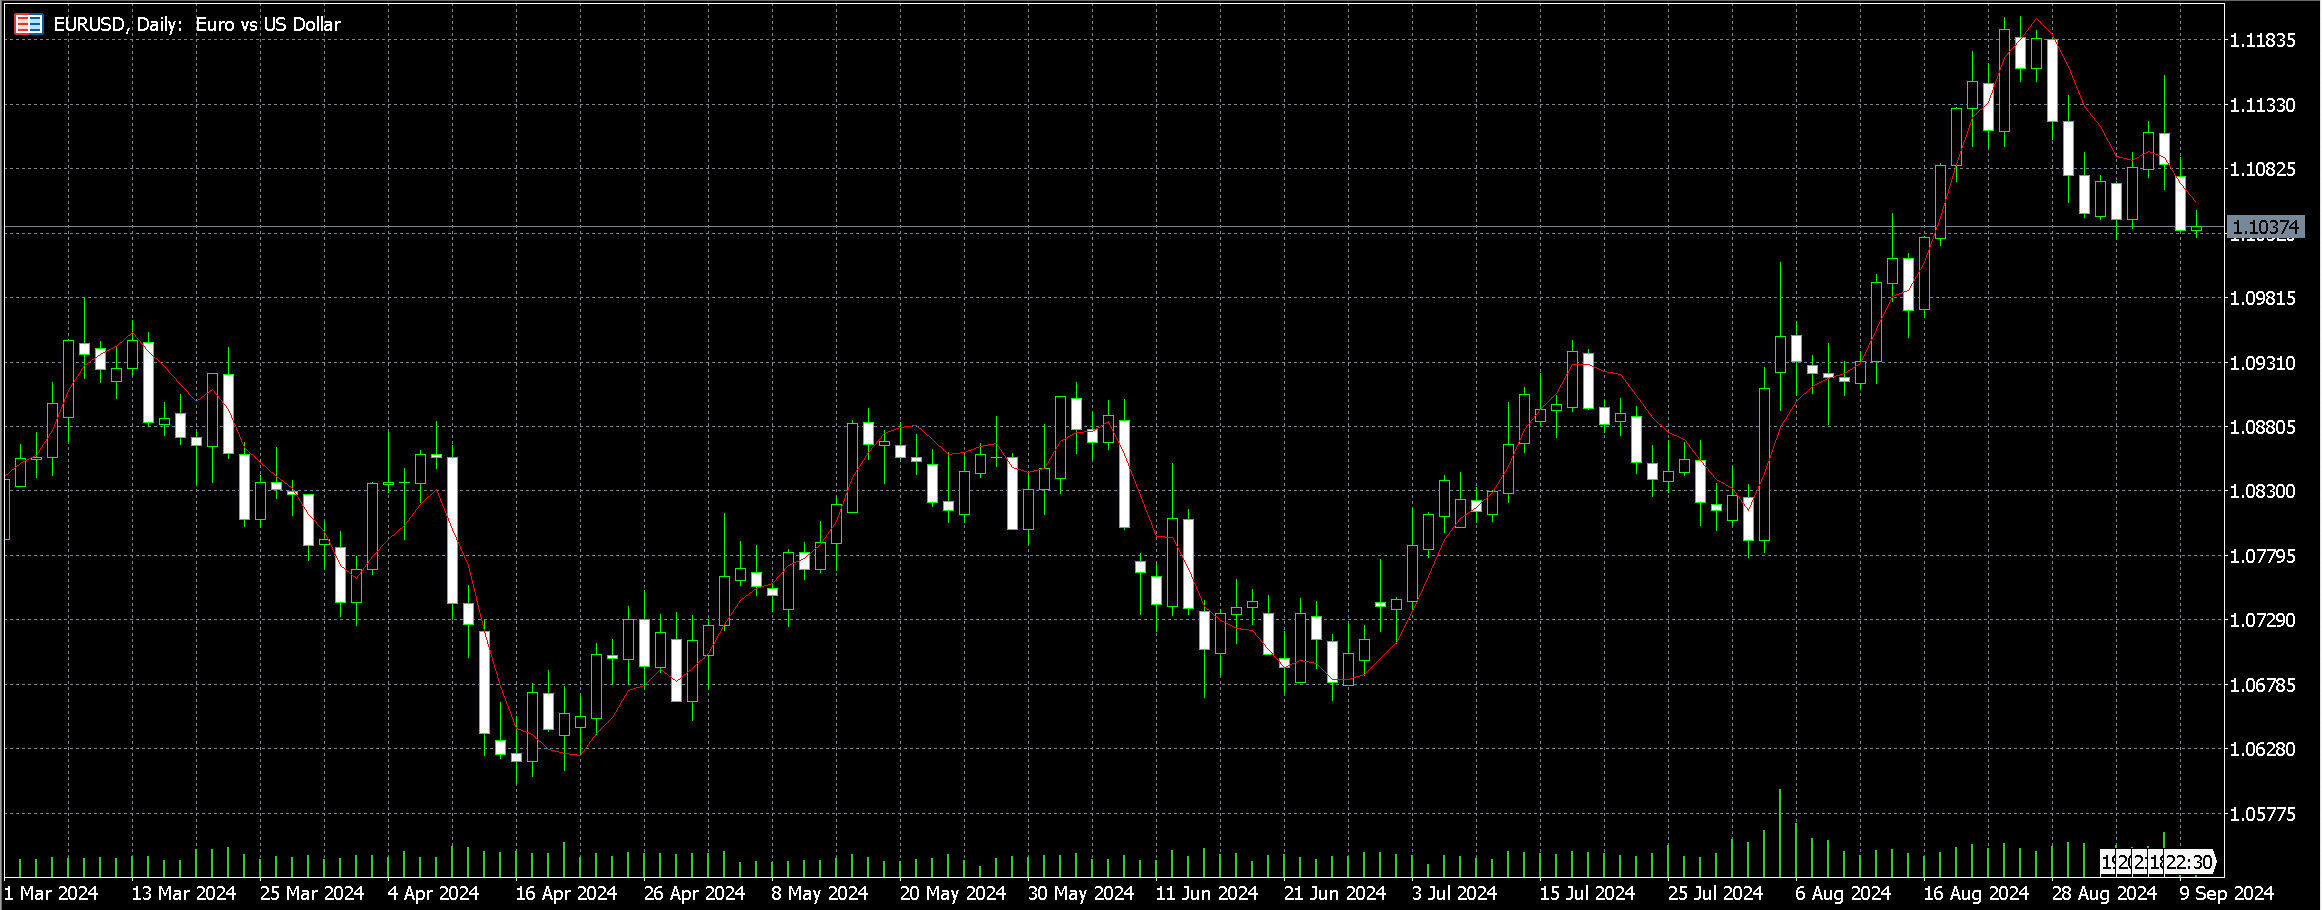
The Triple Exponential Moving Average (TEMA) is a powerful technical indicator that smooths out price fluctuations by combining multiple exponential moving averages (EMAs), helping to reduce lag.
In crypto trading, TEMA is particularly useful for its ability to quickly react to price changes, allowing traders to more accurately identify trends and make informed decisions. It generates buy and sell signals when a price crosses above or below the TEMA line, providing a clearer view of market direction.
Given the high volatility in crypto markets, TEMA's quick responsiveness helps traders manage risk and act swiftly, making it an effective tool for navigating these fast-moving environments.
Variable Index Dynamic Average (VIDYA)

The Variable Index Dynamic Average (VIDYA), developed by Tushar Chande, is an adaptive moving average that adjusts its sensitivity based on market volatility. Unlike traditional moving averages, VIDYA uses the Chande momentum oscillator to gauge how responsive it should be, making it capable of smoothing price data while staying sensitive to sudden market shifts.
VIDYA is a valuable tool that can help crypto traders spot trends and potential reversals by adapting to rapid price changes. Its unique strength lies in its ability to balance responsiveness and smoothness, offering a clearer view of market conditions — an essential feature for navigating the highly volatile crypto market.
Market Facilitation Index (BW MFI)
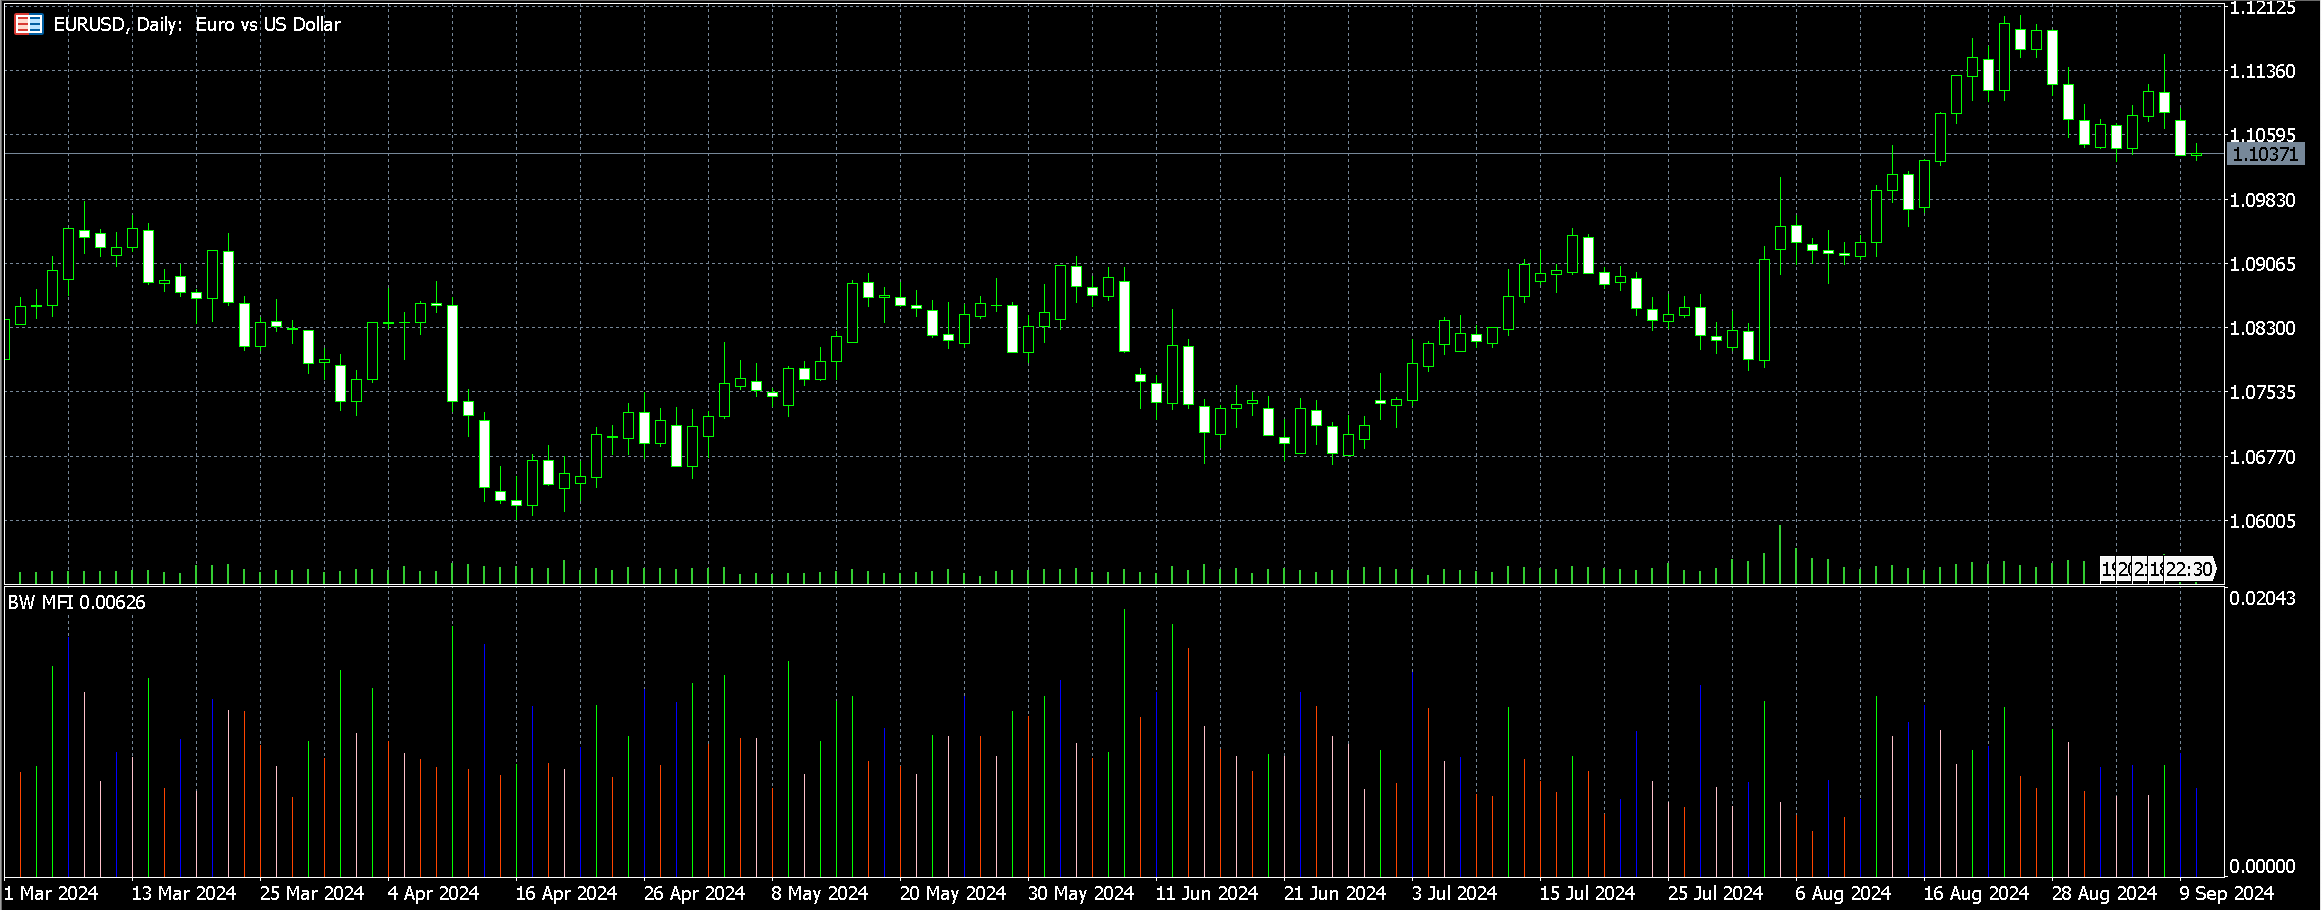
The Market Facilitation Index (BW MFI), developed by trader and author Bill Williams, is a technical indicator that measures how efficiently price moves in relation to trading volume. It helps traders assess market strength, comparing price changes with volume in order to provide insight into whether the market is driving movement or losing momentum.
The BW MFI uses color-coded bars — green, red, blue and pink — to represent different market conditions. This tool is especially helpful for crypto traders in that it highlights the relationship between trading volume and price changes, offering a clearer understanding of market intensity and potential reversals.
Money Flow Index (MFI)
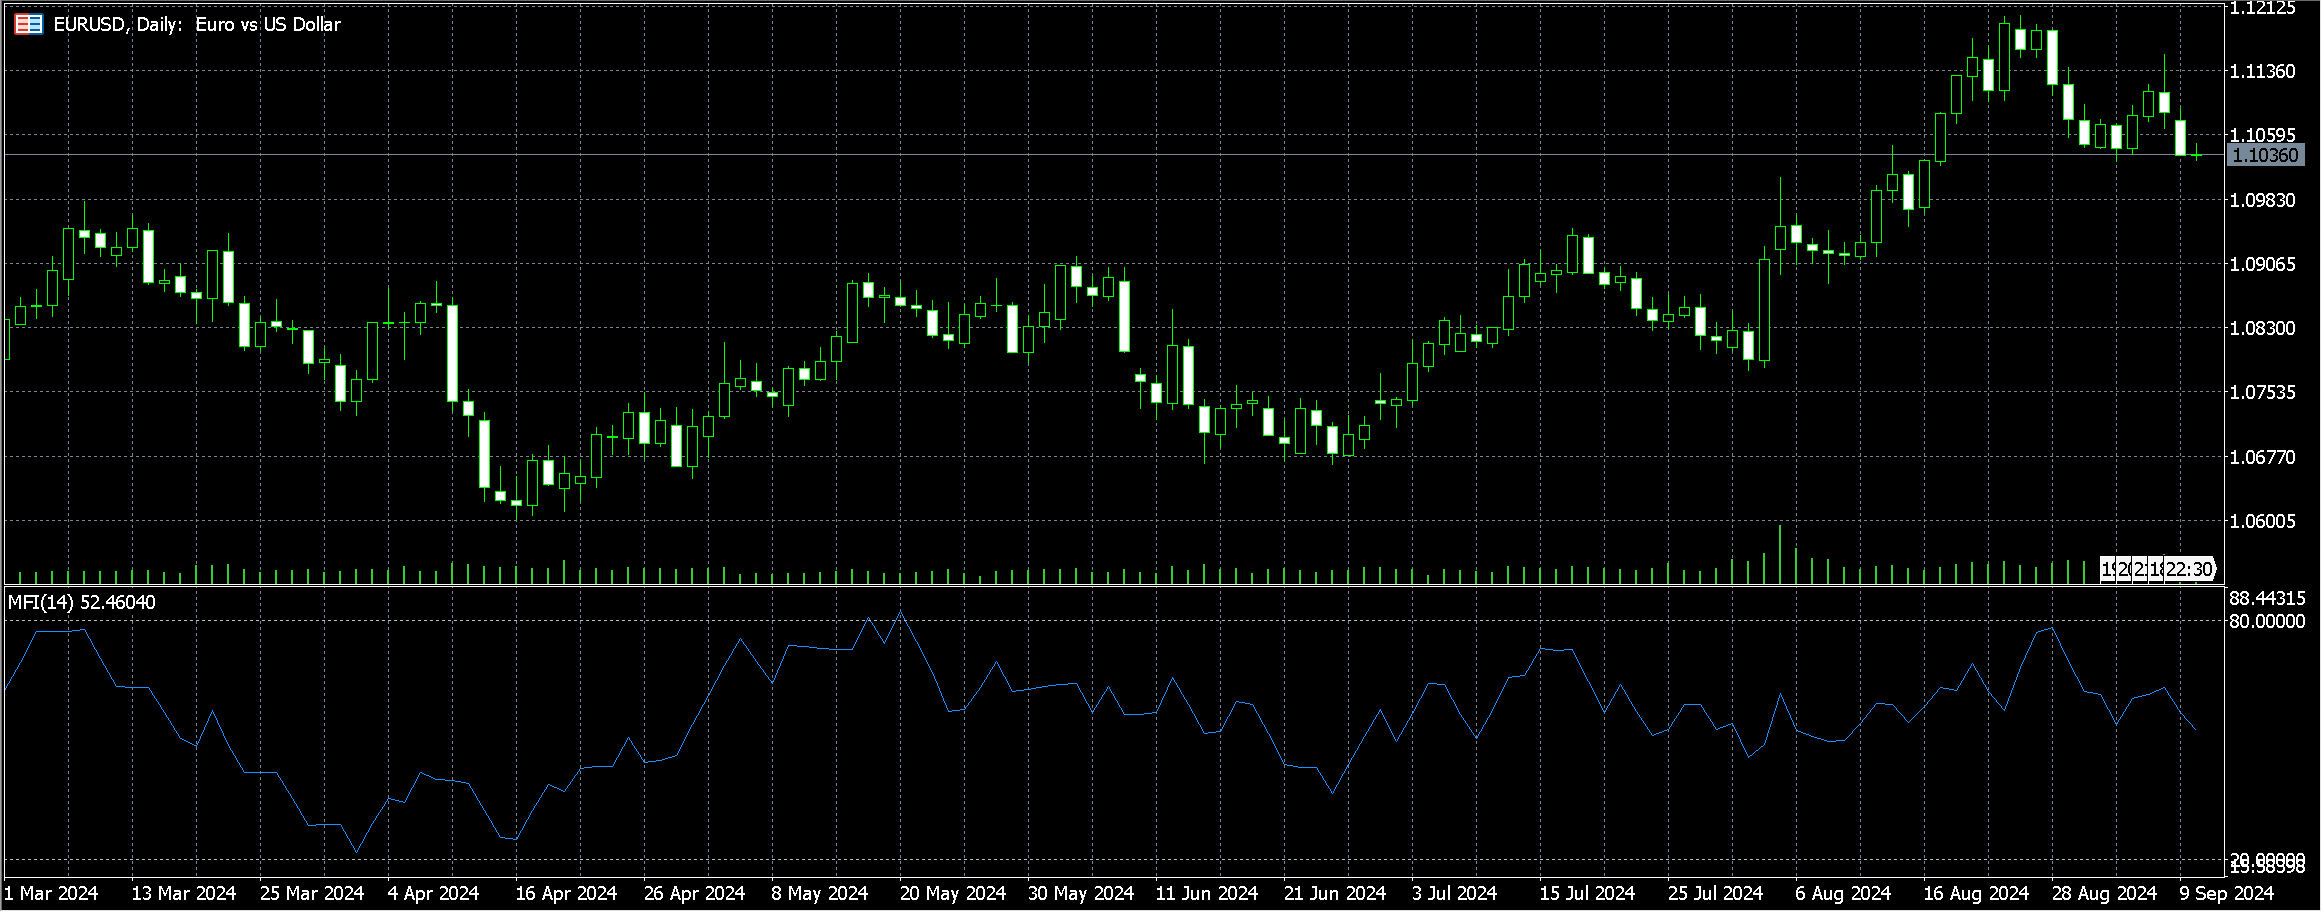
The Money Flow Index (MFI) is a momentum indicator that measures the flow of money into and out of an asset by combining price and volume data to assess buying and selling pressure. It generates buy and sell signals on a scale from 0 to 100, with values above 70 indicating overbought conditions and those below 30 signaling oversold conditions.
Within high-volume crypto markets, the MFI’s sensitivity to volume helps traders detect trends and potential reversals. Its standout feature is the ability to reveal divergences between price movements and money flow, offering insights into market sentiment. This capability makes the MFI especially useful in the volatile crypto market, where quick decisions can help traders capitalize on price fluctuations.
Volume Oscillator (VO)
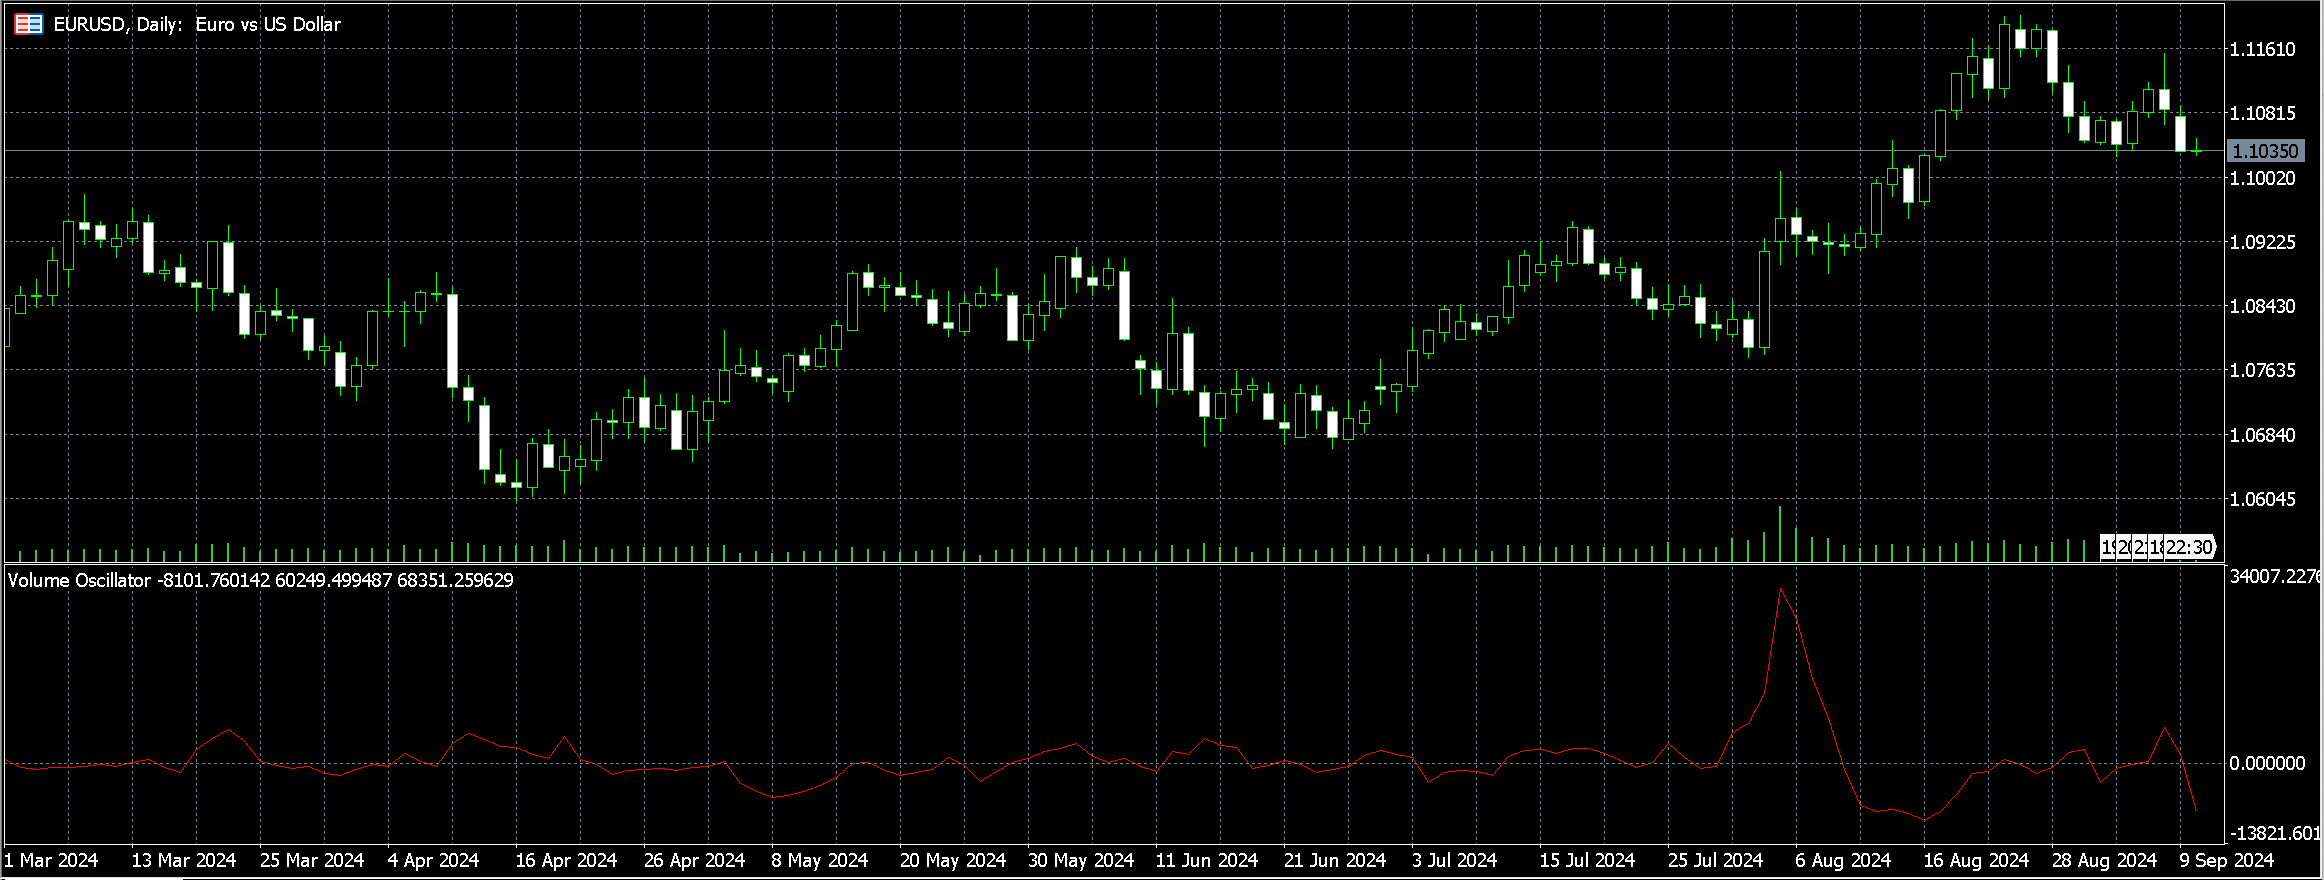
The Volume Oscillator (VO) measures the difference between two moving averages of a cryptocurrency's trading volume. By expressing this difference as a percentage, the VO helps traders determine whether price movements are backed by sufficient volume, which is essential for confirming trends. It generates signals when the oscillator crosses above or below the zero line, indicating increasing or decreasing volume momentum.
The VO’s ability to highlight shifts in volume dynamics makes it a valuable tool for confirming price movements and spotting potential reversals. A positive VO suggests strong buying interest, while a negative VO indicates selling pressure. This insight makes it particularly useful for crypto traders who rely on volume to validate price movements amidst market volatility.
Chaikin Oscillator (CHO)
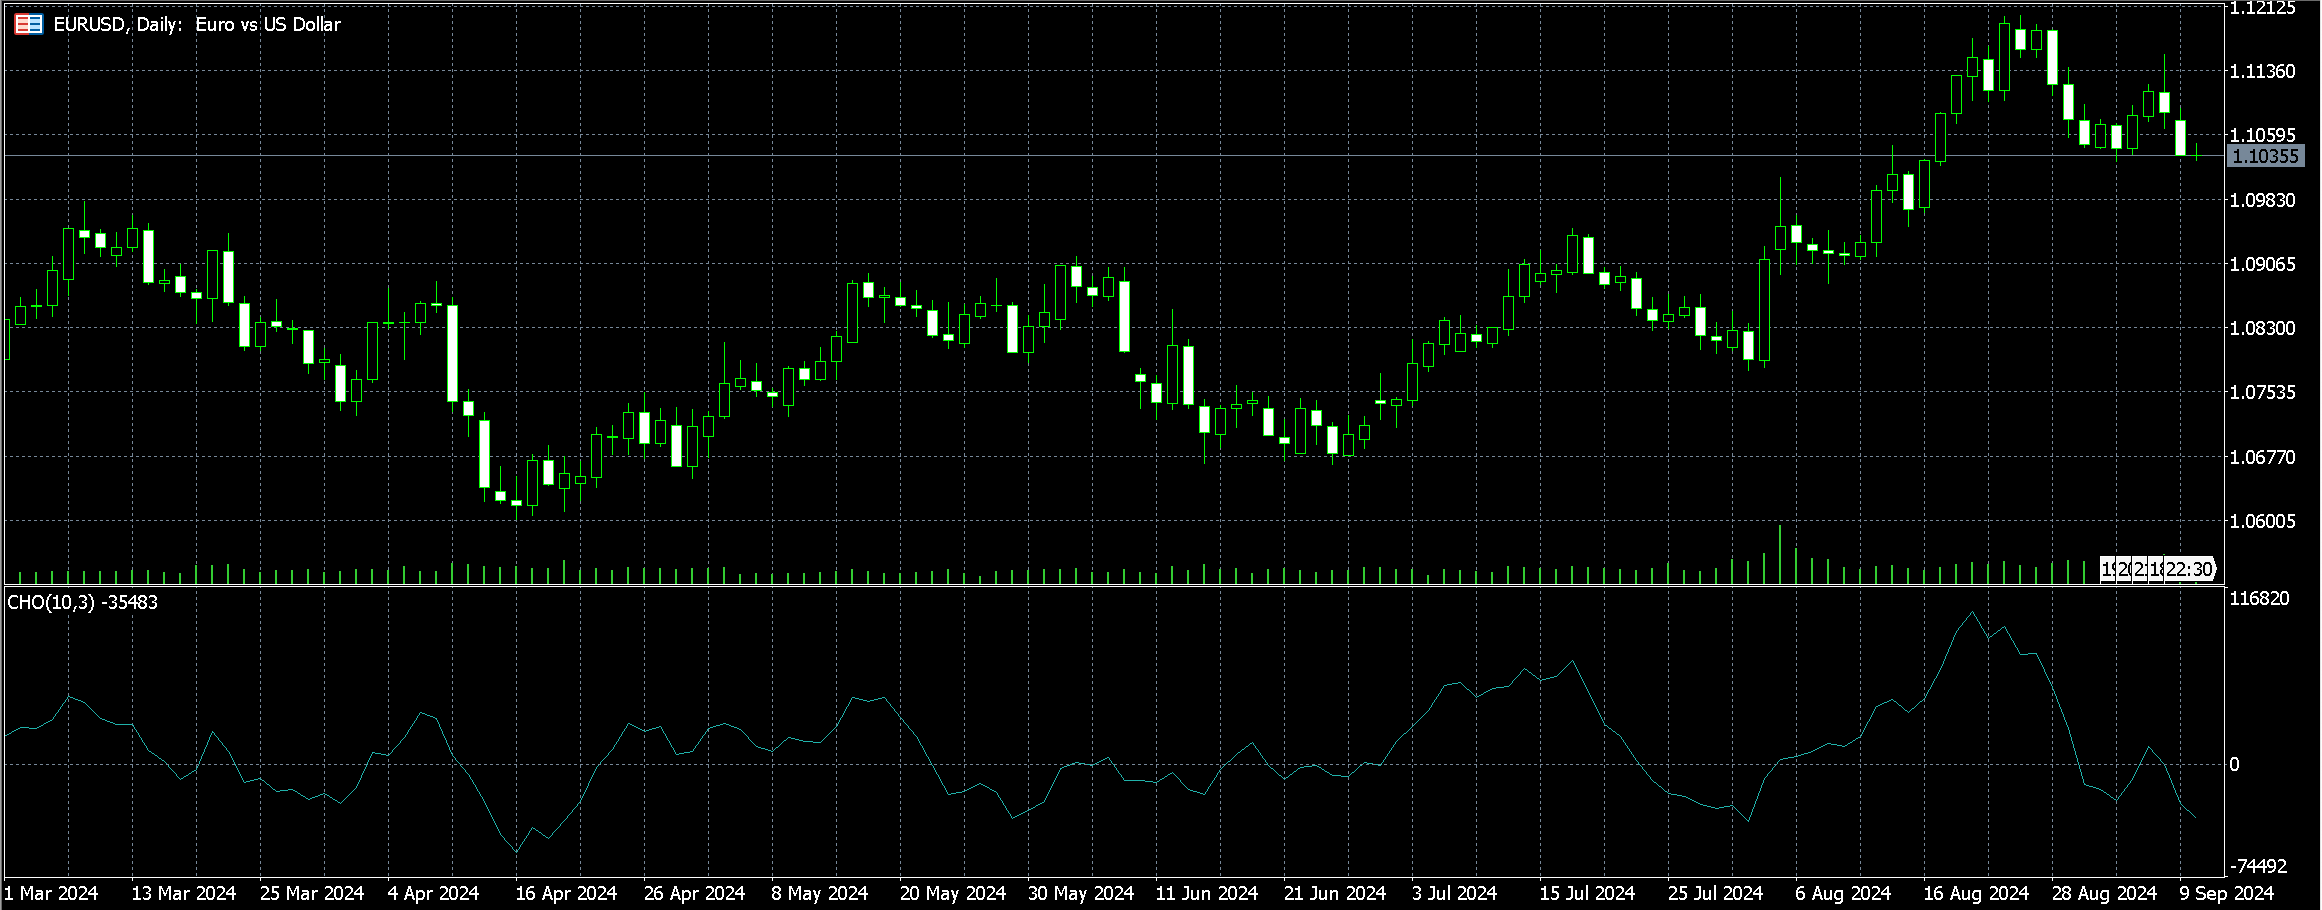
The Chaikin Oscillator (CHO) is a momentum indicator that tracks the accumulation and distribution of an asset by combining the Accumulation Distribution Line (ADL) with a money flow volume indicator. It’s calculated by subtracting the 10-period exponential moving average (EMA) of the ADL from the 3-period EMA of the ADL.
This helps traders analyze buying and selling pressure by examining both volume and price movements. When the CHO shows positive values, it indicates buying pressure, while negative values suggest selling pressure. Its sensitivity to volume changes makes it particularly valuable for identifying potential trend reversals, especially within the context of crypto market turbulence.
Alligator Indicator

Also developed by Bill Williams, the Alligator indicator is a trend-following tool that uses three smoothed moving averages to identify market trends: the jaw (blue), teeth (red) and lips (green). These lines help traders spot when a trend is forming or reversing. When the lines are intertwined, it signals market consolidation, and when they spread apart, it indicates a trend is taking shape.
The Alligator’s ability to differentiate between trending and consolidating phases is especially useful when applied to the crypto market. By filtering out noise during sideways markets, and highlighting strong trends when the lines diverge, it provides traders with clearer signals for optimal trade timing, making it a valuable tool for navigating unpredictable market conditions.
Williams Percent Range (Williams %R)
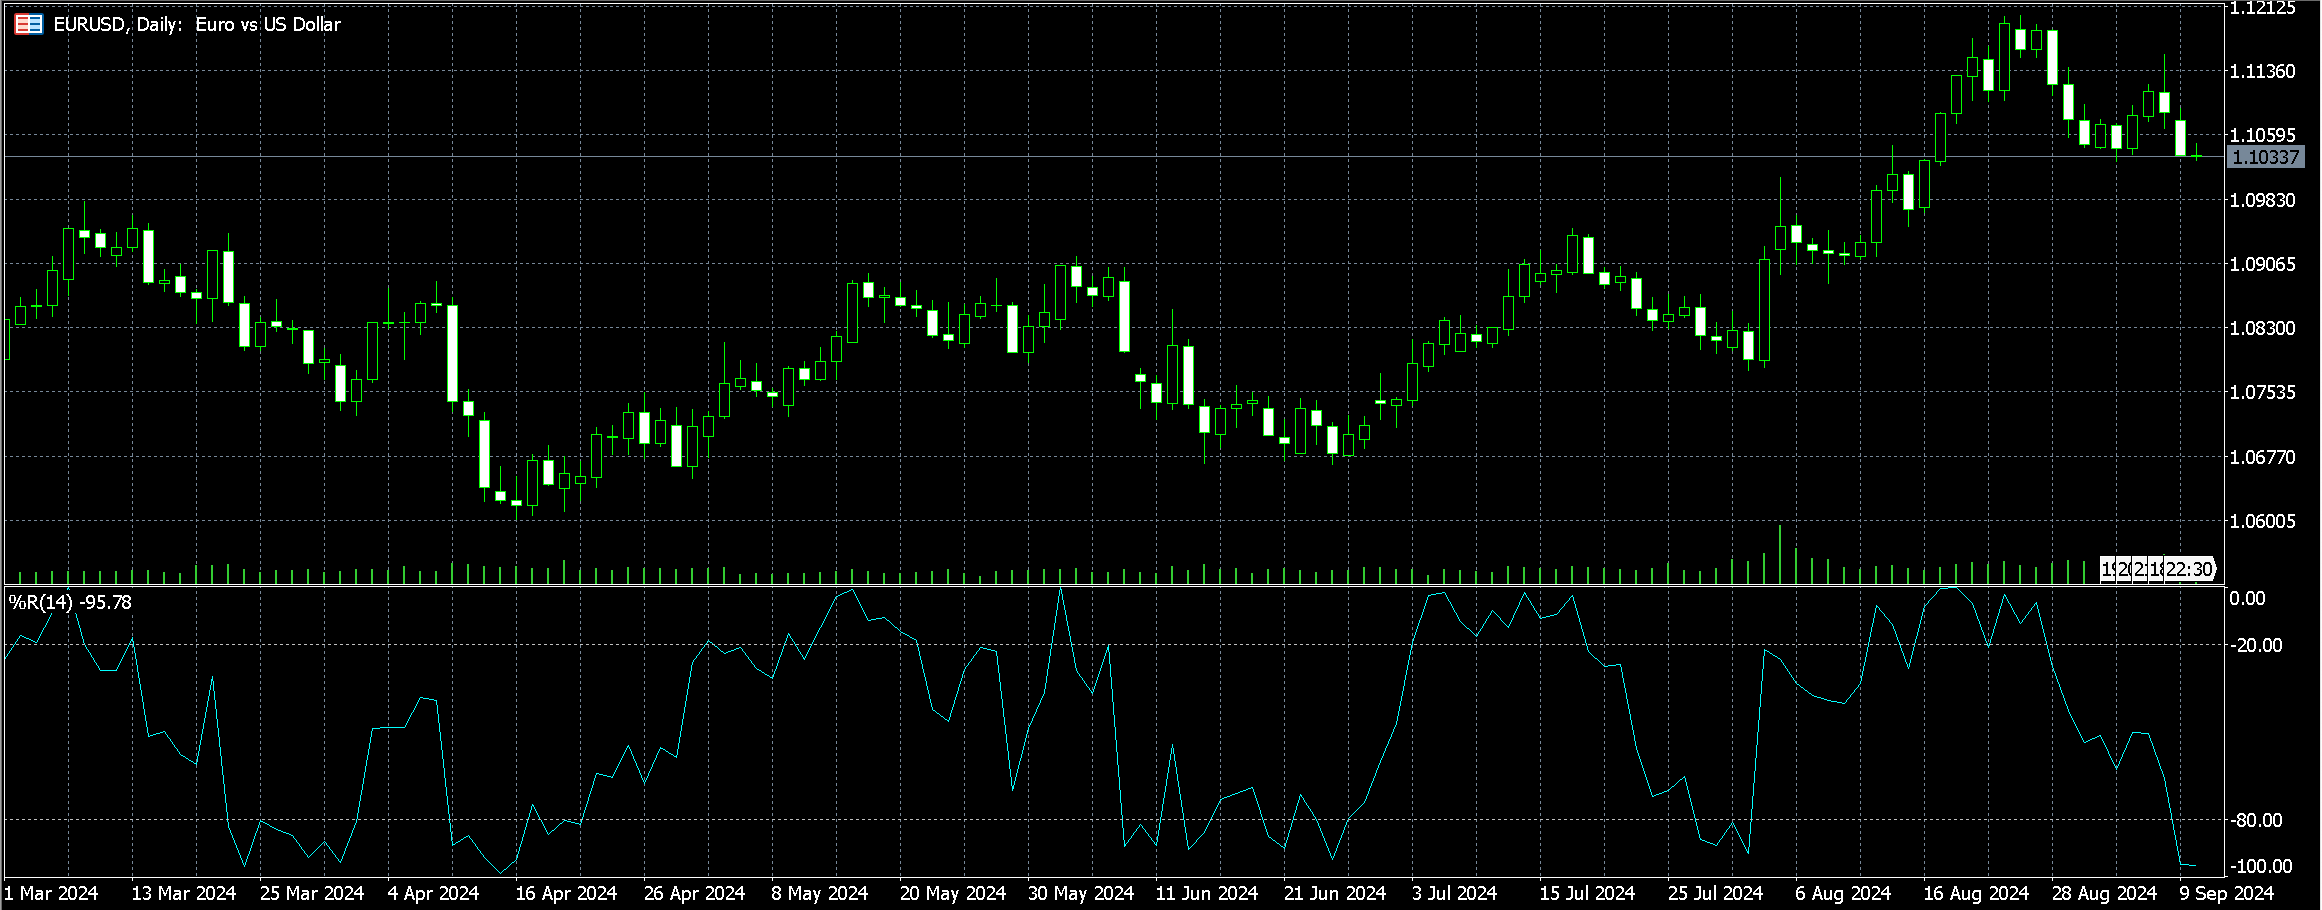
Williams Percent Range (Williams %R, or simply %R) is a momentum oscillator developed by Larry Williams that measures overbought and oversold conditions in a market. It operates on a scale from −100 to 0, with values above −20 indicating overbought conditions and those below −80 signaling oversold conditions.
Williams %R generates buy and sell signals by analyzing the relationship between the current closing price and the asset's high-low range over a specified period (usually 14 periods). Its key strength lies in its sensitivity to price changes, allowing traders to respond quickly to market movements — an essential advantage in the fast-paced crypto market. This responsiveness makes it a valuable tool for identifying potential reversal points and making informed and timely trading decisions.
Envelopes Indicator

The Envelopes indicator is a technical tool that uses two parallel lines plotted above and below a moving average to create a price channel. It helps traders spot potential overbought and oversold conditions, as well as possible trend reversals, by tracking price movements within the upper and lower bands. If the price touches or crosses the upper band, it may signal overbought conditions, while touching or crossing the lower band can indicate oversold conditions.
This indicator is particularly useful for determining entry and exit points, as traders can adjust its parameters — such as the moving average length and percentage deviation — to better suit the high volatility of the crypto market. Its adaptability makes it a valuable tool for optimizing trading strategies.
Parabolic SAR (Stop and Reverse)
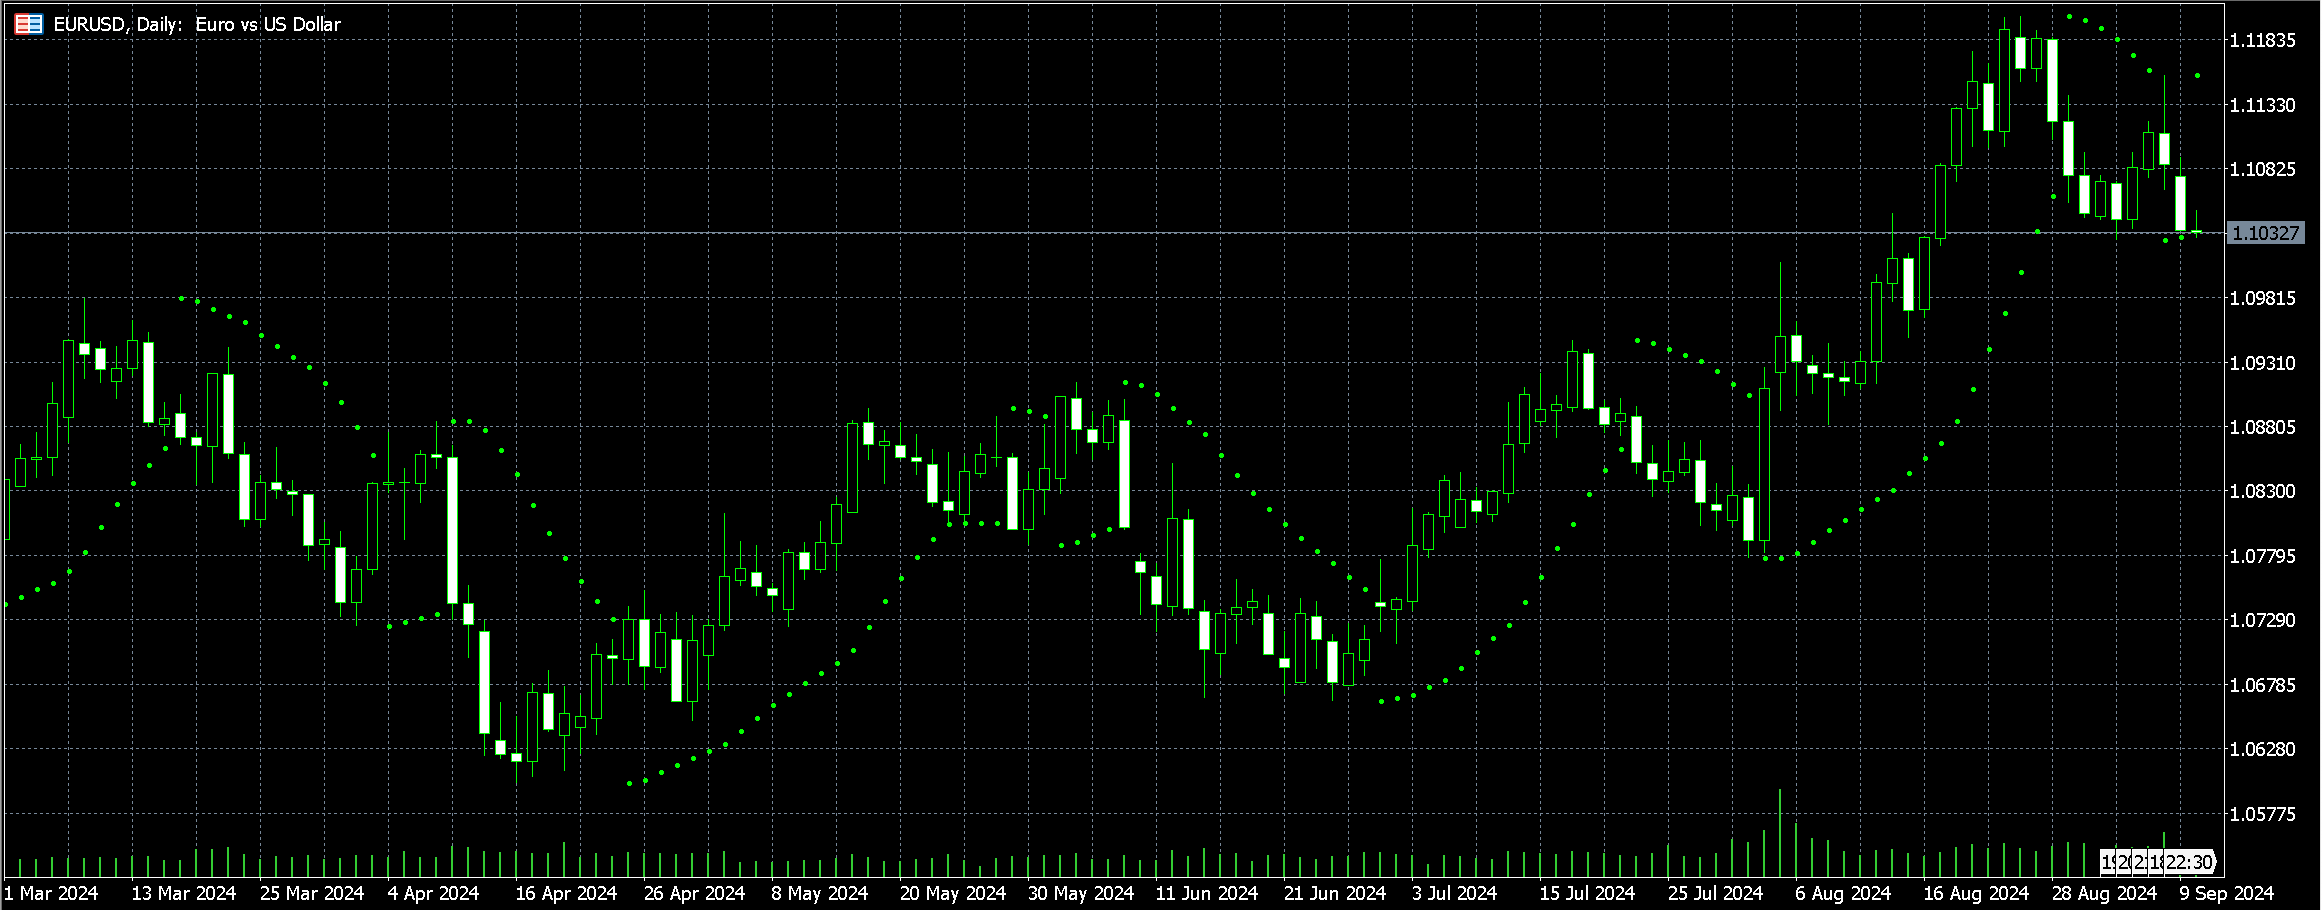
The Parabolic SAR (stop and reverse), developed by J. Welles Wilder Jr., is a trend-following indicator that helps crypto traders identify potential trend reversals. It appears as a series of dots plotted above or below the price bars on a chart. When the dots are below a price, it indicates an uptrend, and when they’re above, it signals a downtrend. Traders use these dots to determine entry and exit points.
A flip of the dots from above to below a price suggests a possible uptrend, while a flip from below to above signals a potential downtrend. The parabolic SAR's ability to quickly adapt to changing market conditions makes it a valuable tool for traders navigating the volatile crypto market, offering clear signals to optimize timing trades.
Fibonacci Retracement
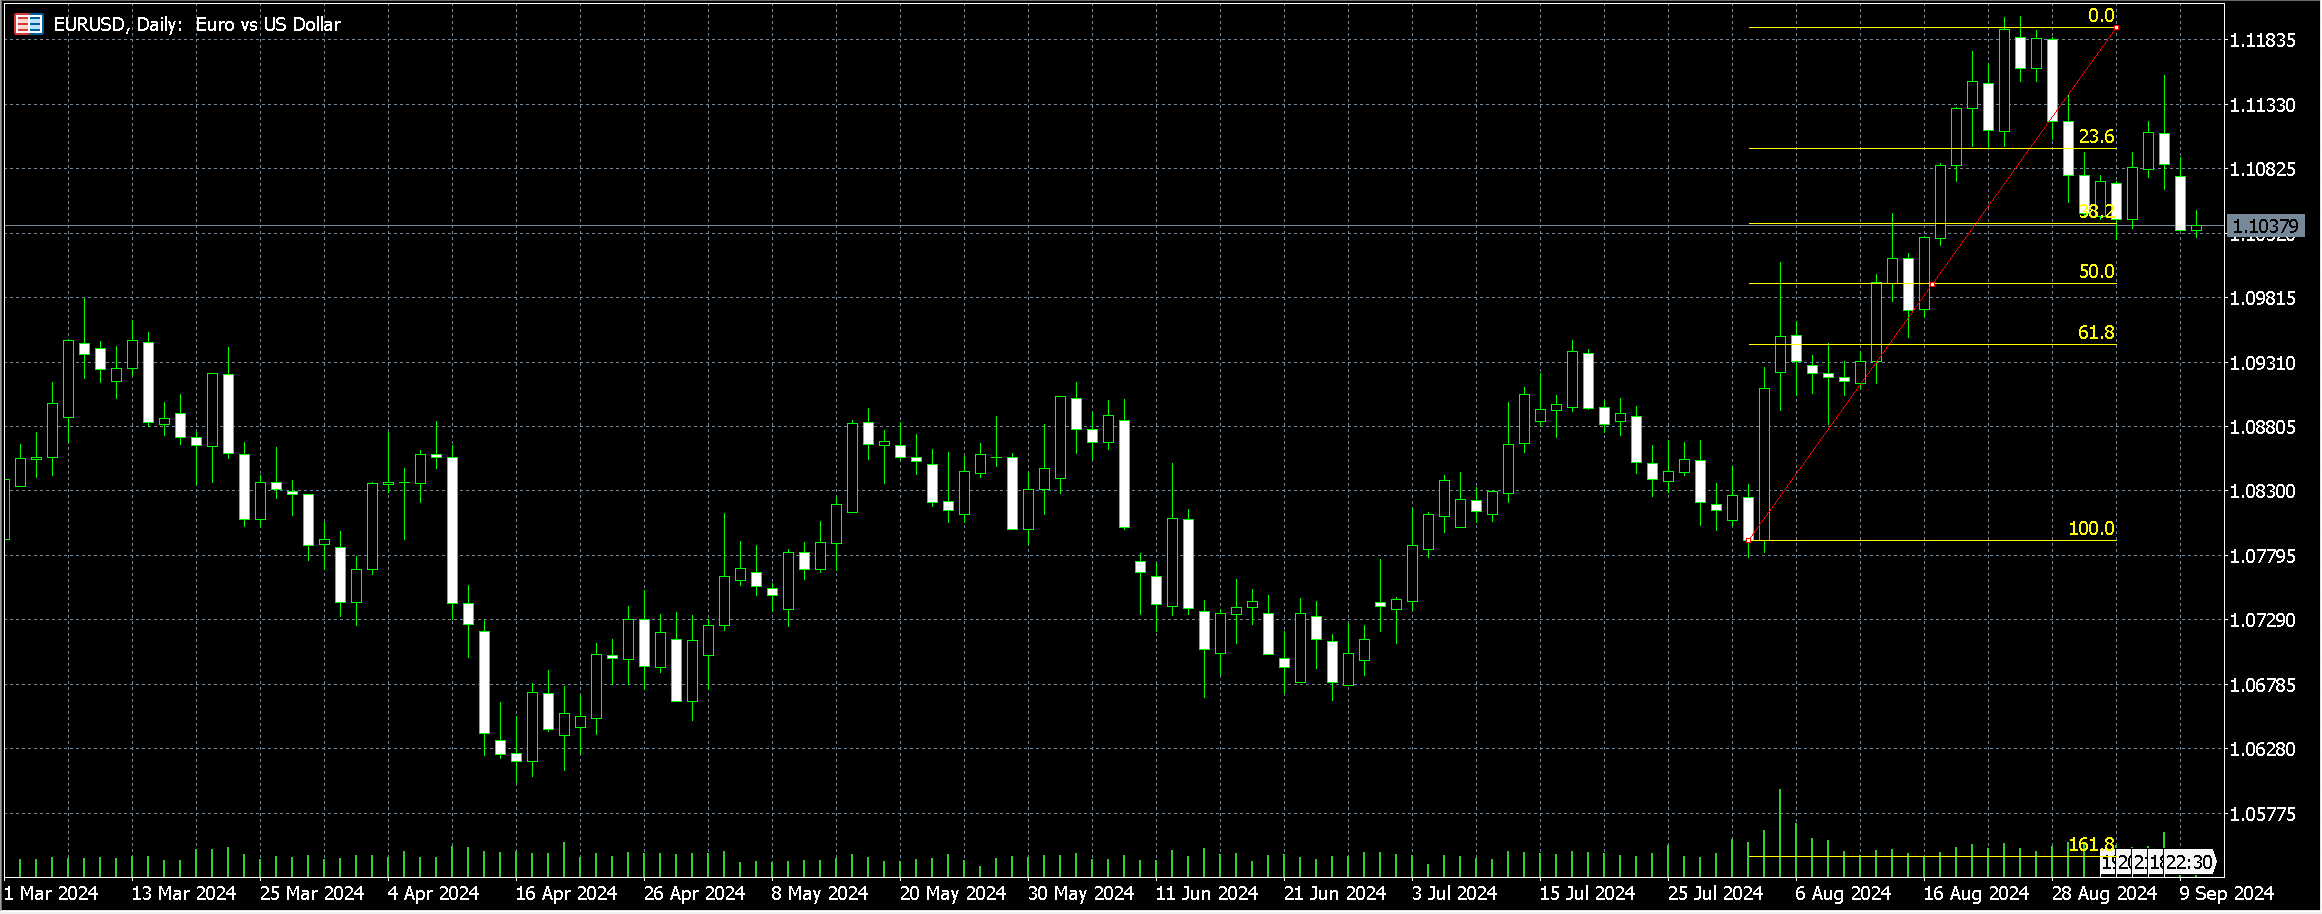
Fibonacci retracement is a popular technical analysis tool used to identify potential support and resistance levels by applying the Fibonacci sequence. It works by selecting two extreme points on a price chart — a high and a low — and dividing the vertical distance between them using key Fibonacci ratios: 23.6%, 38.2%, 50%, 61.8% and 78.6%. Traders use these levels to analyze trends by identifying swing highs and lows, then applying the Fibonacci ratios to project potential retracement levels.
In crypto trading, Fibonacci retracements are especially valuable due to the market's pronounced volatility. Price reactions at these levels can indicate potential reversals or trend continuations, helping traders determine entry and exit points with greater precision. Among the various levels, the 38.2% and 61.8% retracements are often the most significant, acting as strong support or resistance zones during a trend.

How to Add MT5 Indicators to Your Trading Chart
MetaTrader 5 makes it easy to add indicators to your chart. Here’s how:
Step 1: Launch the MetaTrader 5 platform.
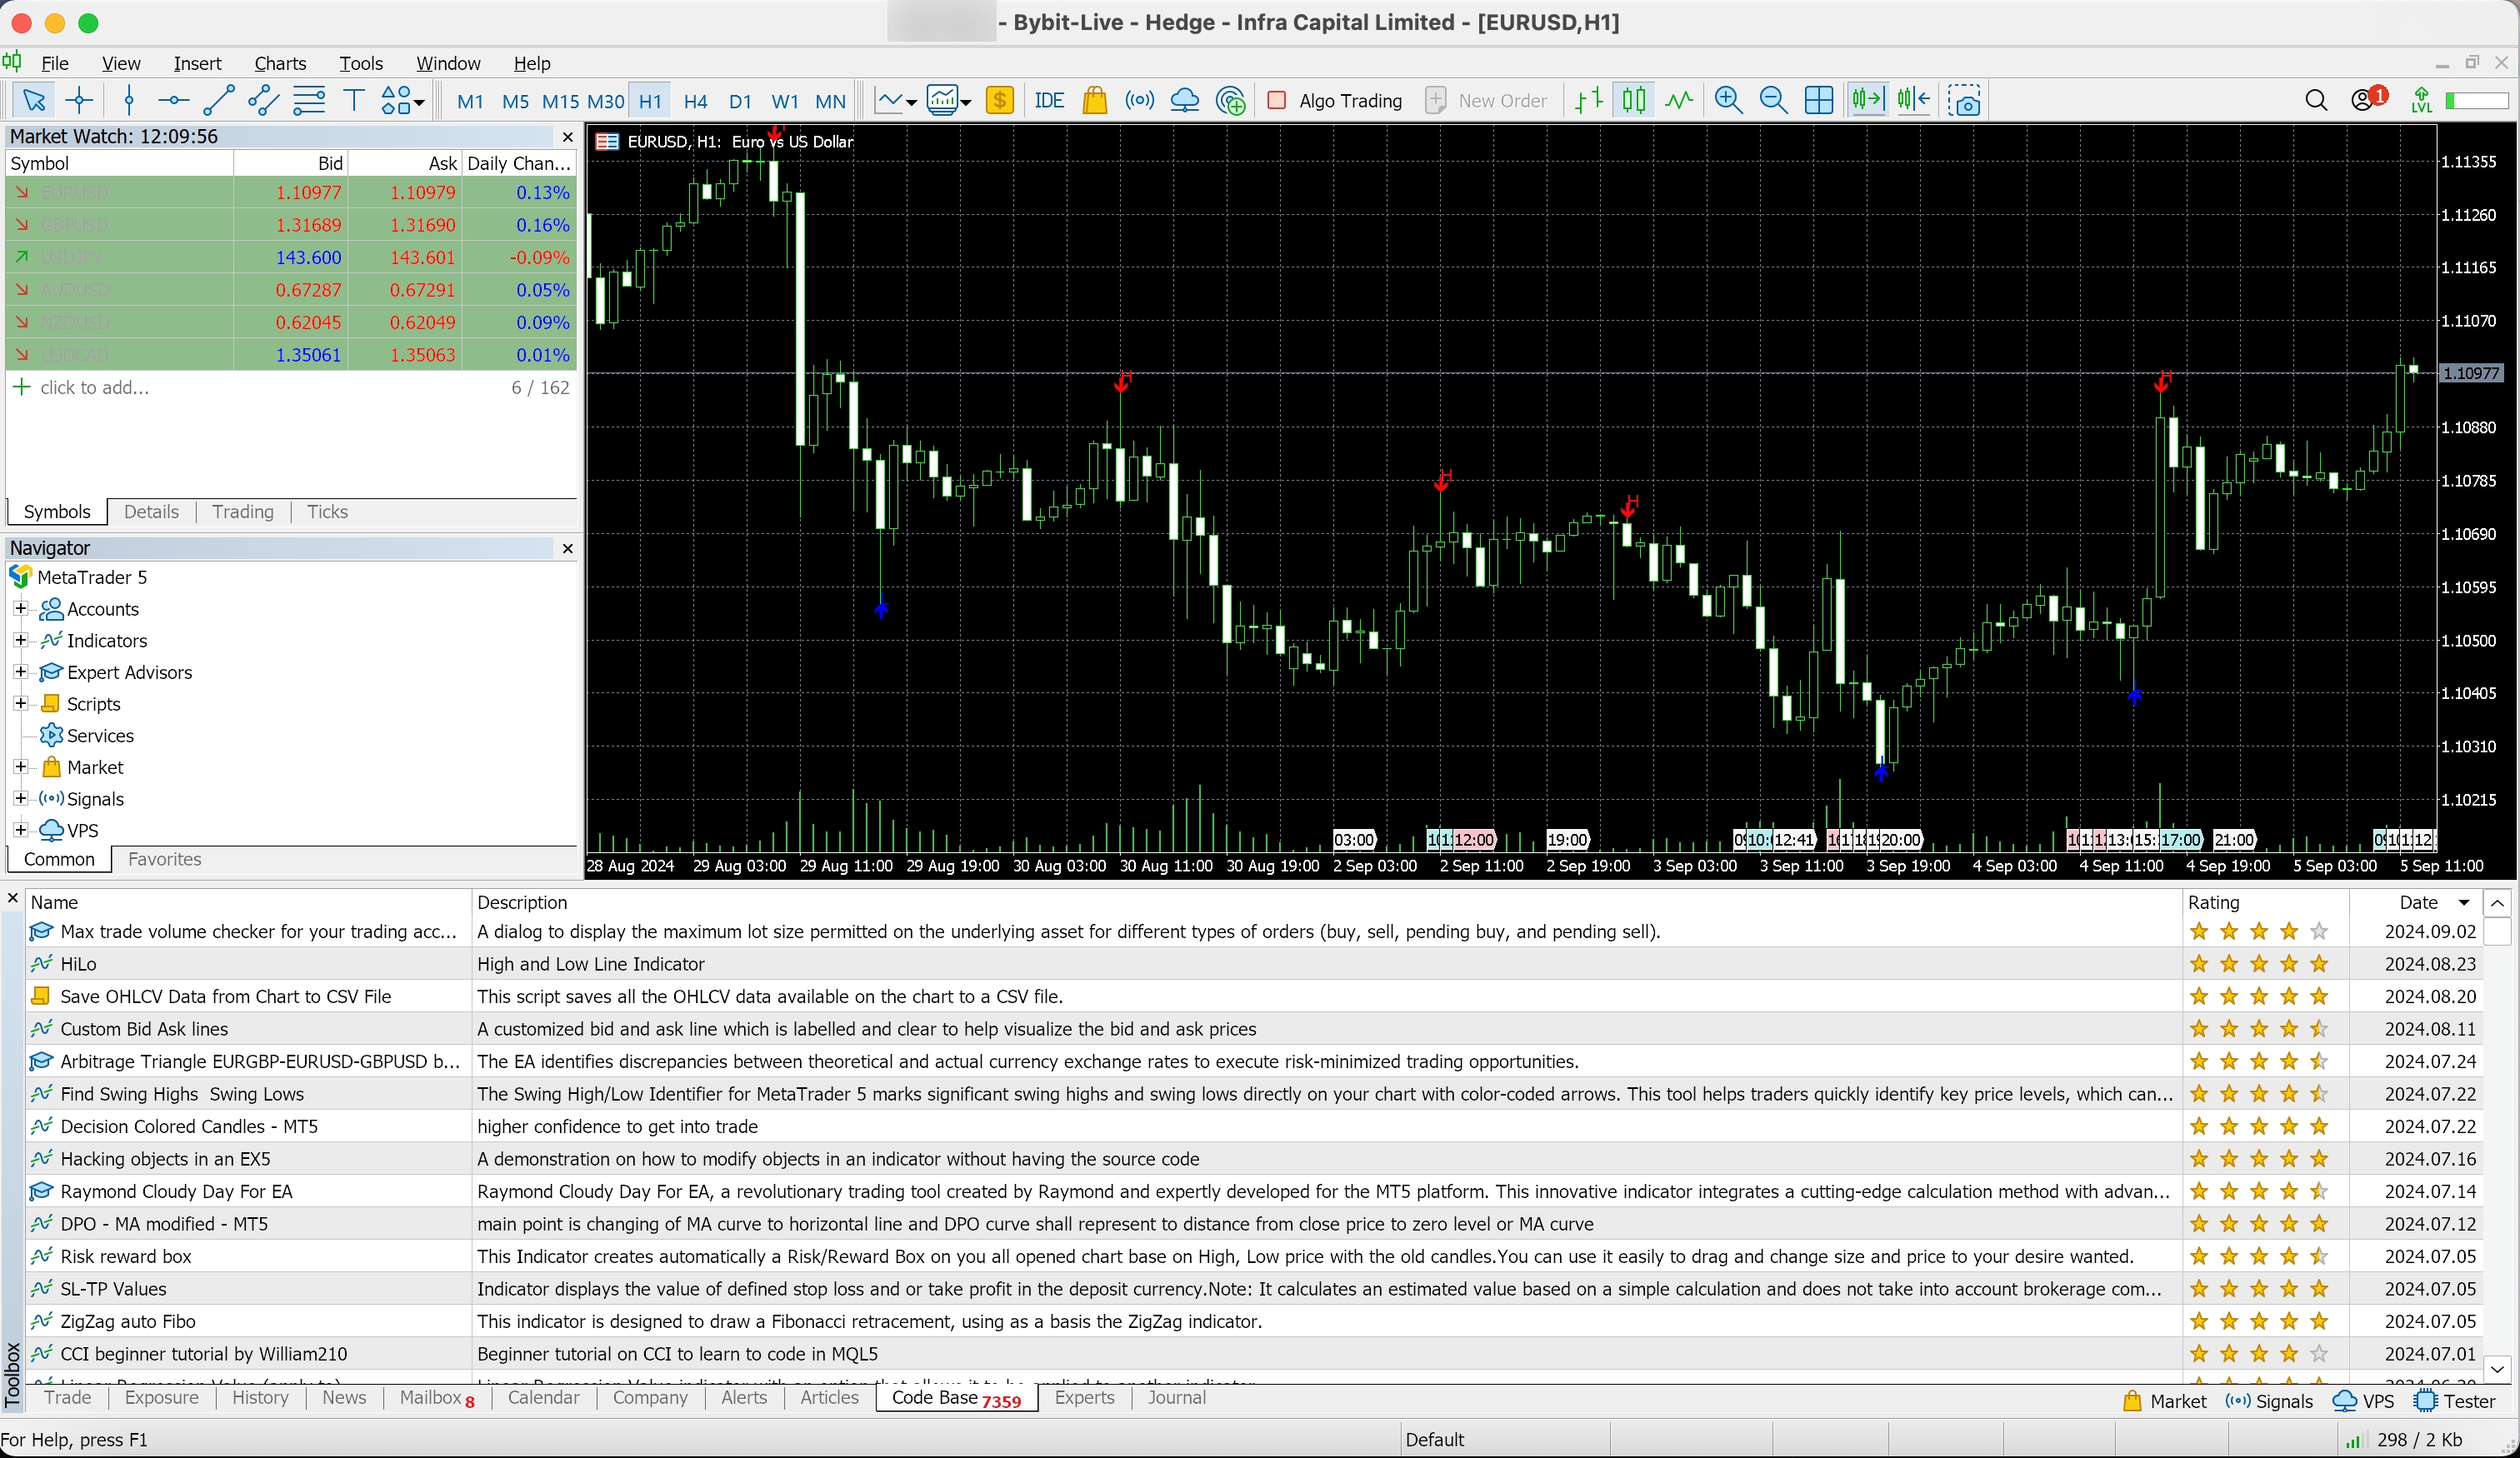
Step 2: Click on the Insert menu at the top of the MT5 platform.
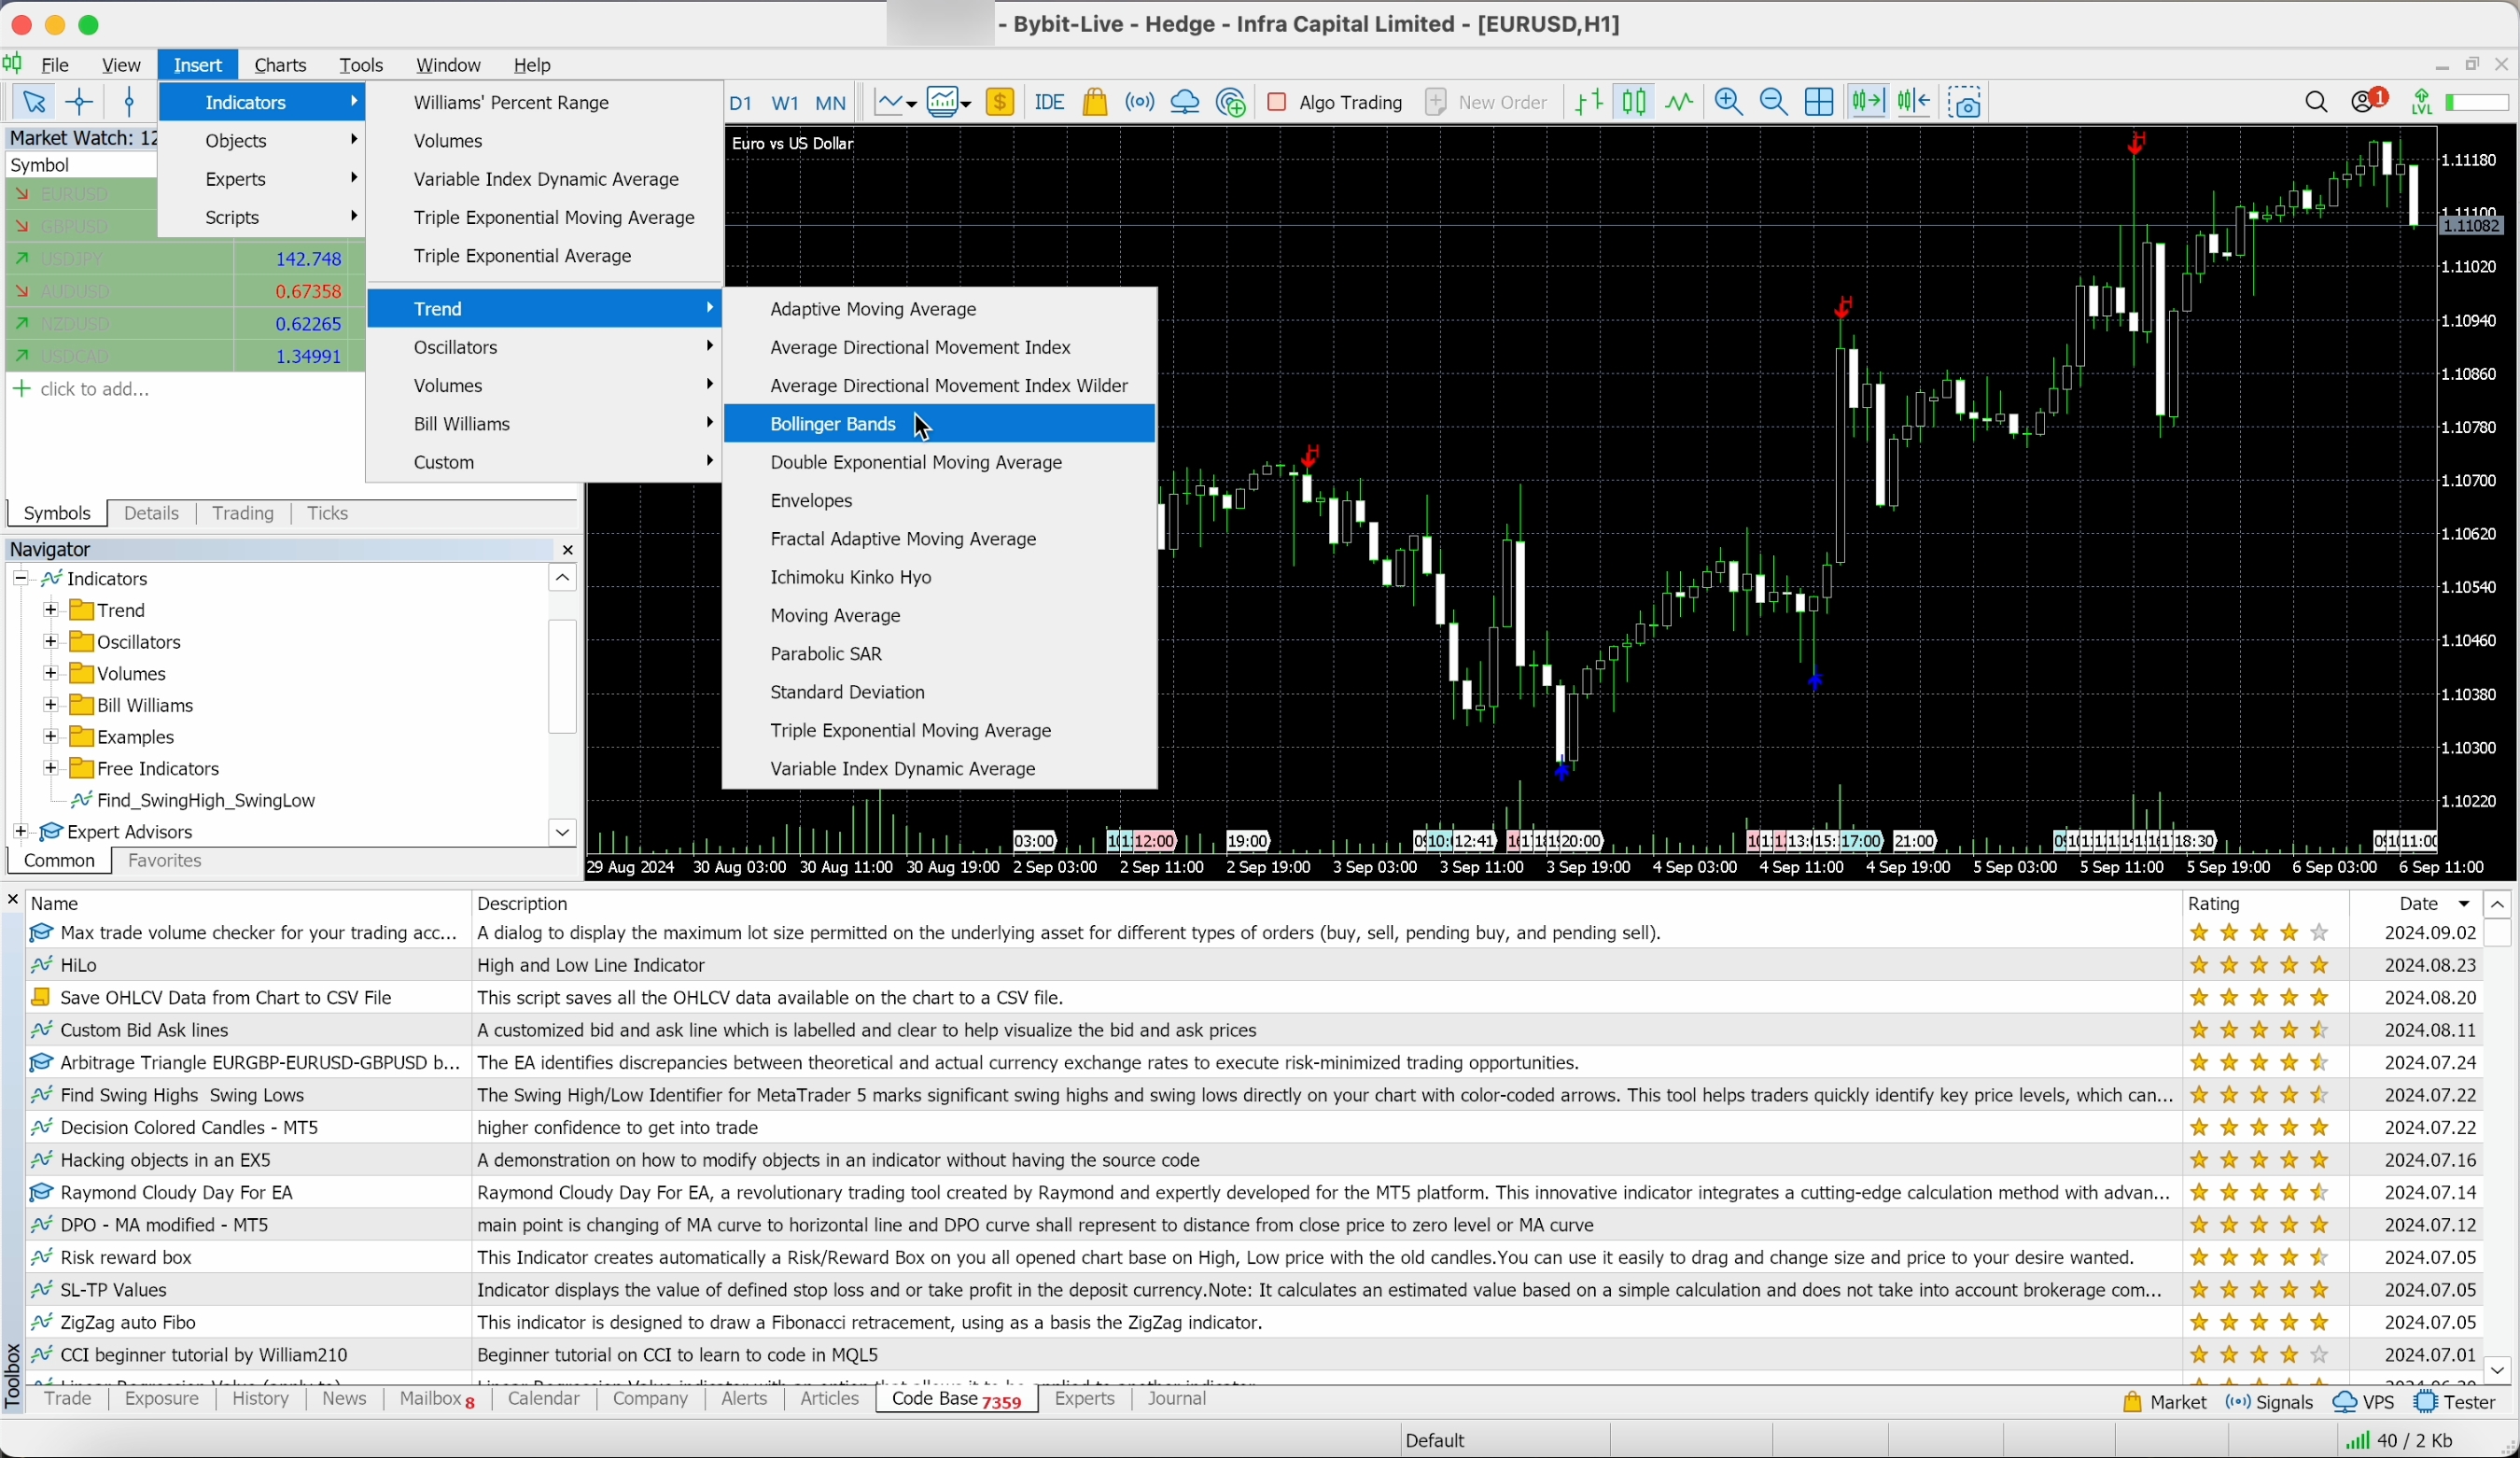
Step 3: Choose an indicator from the drop-down list, grouped by category. If you don’t see what you’re looking for, check the Custom sub-menu for additional options.
Step 4: A settings window will pop up. If you’re unsure about adjusting the settings, you can stick with the default options. Otherwise, customize the parameters and colors to suit your needs.
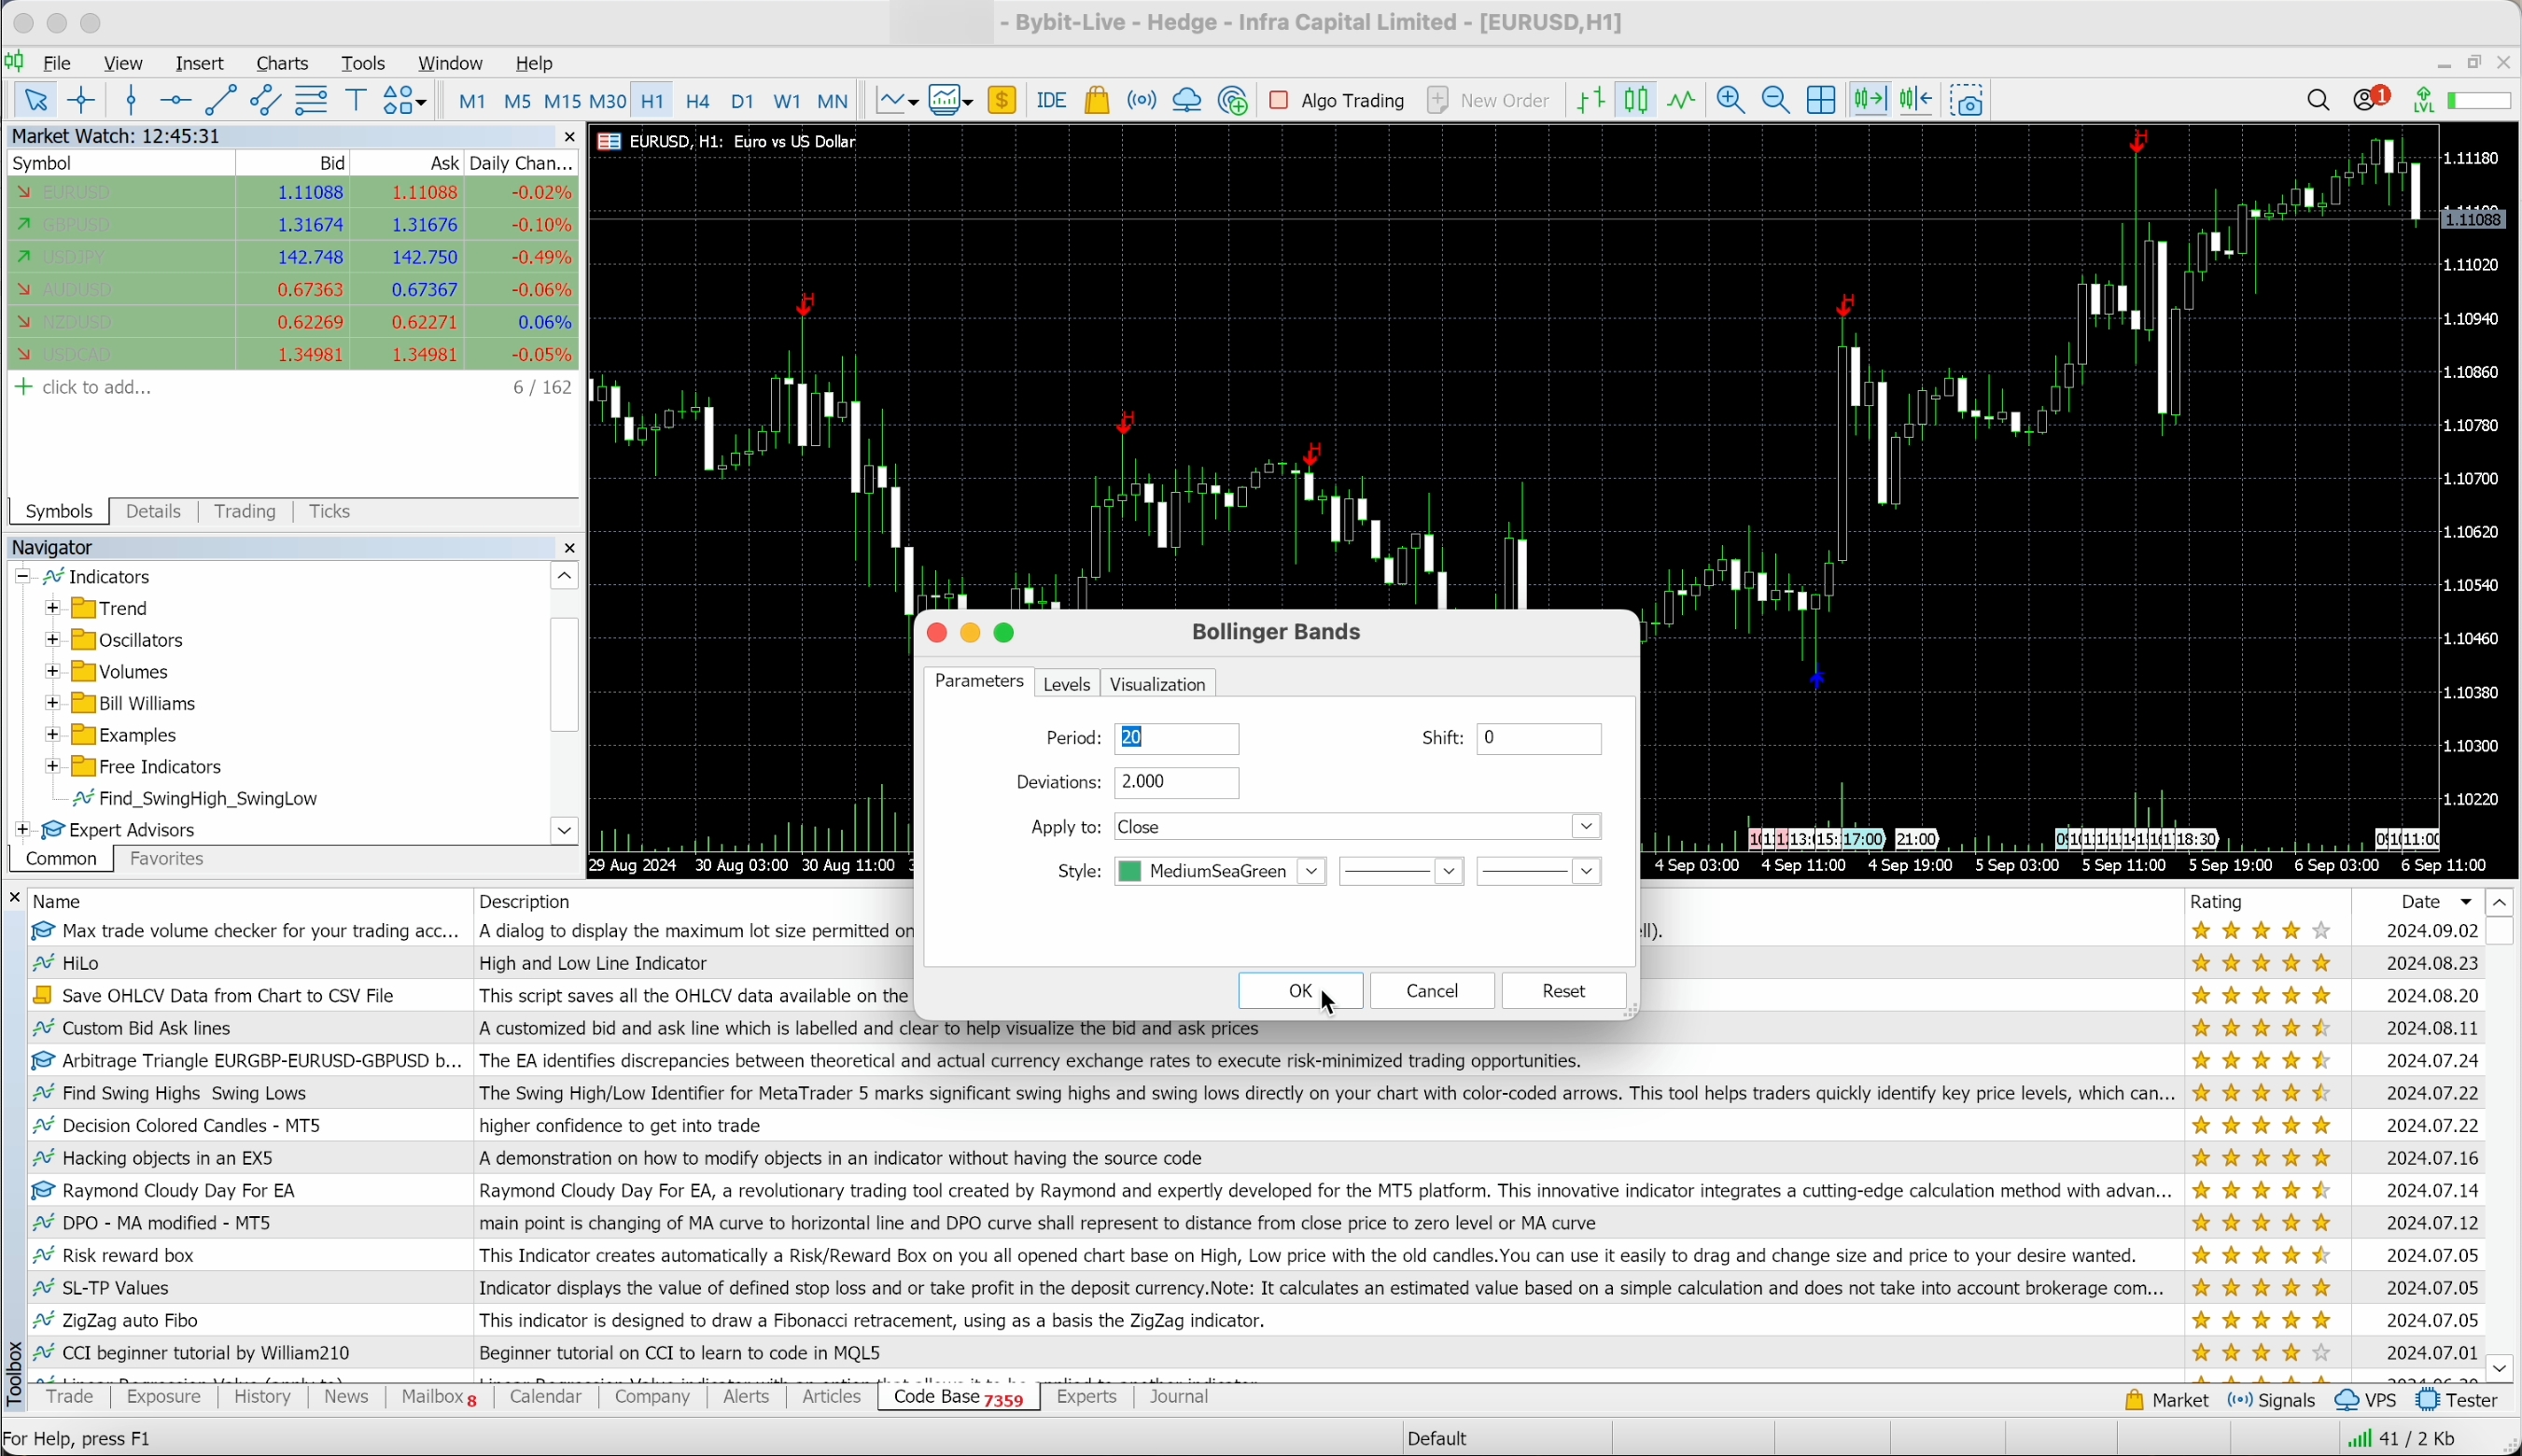
Step 5: Once you're ready, click on OK to apply the indicator to your chart.
To learn more about how you can add MT5 custom indicators to your Bybit MT5 trading, check out our detailed guide here.
The Bottom Line
Navigating the unpredictable world of crypto trading can be daunting, but the right indicators can turn complexity into opportunity. MetaTrader 5 offers a robust suite of tools that help demystify the market's chaos, offering clarity and actionable insights. Armed with these indicators, you can better anticipate market movements, tailor your strategies and respond to shifts with precision.
As you integrate these tools into your trading routine, you'll find yourself better equipped to capitalize on trends and seize opportunities in the ever-evolving crypto landscape. Embrace the power of MT5 indicators and transform the way you approach trading.
#LearnWithBybit