
10 Best MT4 Indicators to Use When Trading Crypto

Before computers were common, technical analysis was used in trading financial assets. At the time, hedge funds and investment banks regularly utilized technical indicators to predict market movement. Now, you can also use the same indicators on MetaTrader4 (MT4).
Let’s learn about the ten best MT4 indicators, and how to use them to trade your favorite crypto.
What Are MT4 Indicators?
MT4 indicators are technical analysis tools on the MetaTrader platform that help identify market trends and future price action.
The MetaTrader platform incorporates the most popular technical indicators free of cost. Depending on your trading style and preference, you can insert the indicators you choose on the chart to help you make reasonable assumptions about future price action.
Technical indicators are mainly divided into two groups: Trend indicators and oscillators. Trend indicators are built around existing market data. In contrast, oscillators are used to discover a potential reversal in the market. Unlike trend indicators, oscillators try to find turning moments ahead of time.
Some MT4 indicators, such as moving averages, are imposed directly into the price chart, while others are plotted on a separate window. Irrespective of their placement on the chart, you can customize each indicator to a good extent, depending on how and where you want it to appear.
If you like technical analysis, it's certainly possible to deploy more than one indicator on the MT4 screen. Generally, the second or third indicator is used to confirm the price action. If you're just beginning to use the MT4 platform to trade cryptocurrency, the following section explains why technical indicators make a lot of sense.
Use of MT4 Indicators
MT4 indicators are an intrinsic feature of the MetaTrader 4 platform. Since the inception of MT4, almost all of the popular technical indicators are offered to the trading community free of cost. They're also used for automated trading and to create trading bots.
Apart from their utility as a robust trading tool, MT4 indicators have become indispensable to crypto traders because they can help them to avoid making wrong decisions in a highly volatile and unpredictable environment.
Unlike with stocks, forex and other financial markets, there’s often less information available to crypto traders. The emphasis on privacy and the nature of blockchain is an important reason to use MT4 indicators, because they can compensate for the lack of available market information.
Even if you believe in the efficient market hypothesis, using MT4 indicators can give you an edge by identifying a perfect entry and exit point. For many traders, MT4 indicators are fundamental to their success because performing technical analysis can substantially increase the profit-loss ratio of any trading strategy.
Best MT4 Indicators for MT4 Crypto Trading
By default, there are lots of MT4 indicators on the MetaTrader platform. You can also download hundreds of others from the official MetaQuotes website. For now, let's discuss some of the best ones. While you may have already heard about these simple MT4 indicators, they're distinguished by their ability to stand alone as the only tool you may need.
Accumulation/Distribution Indicator
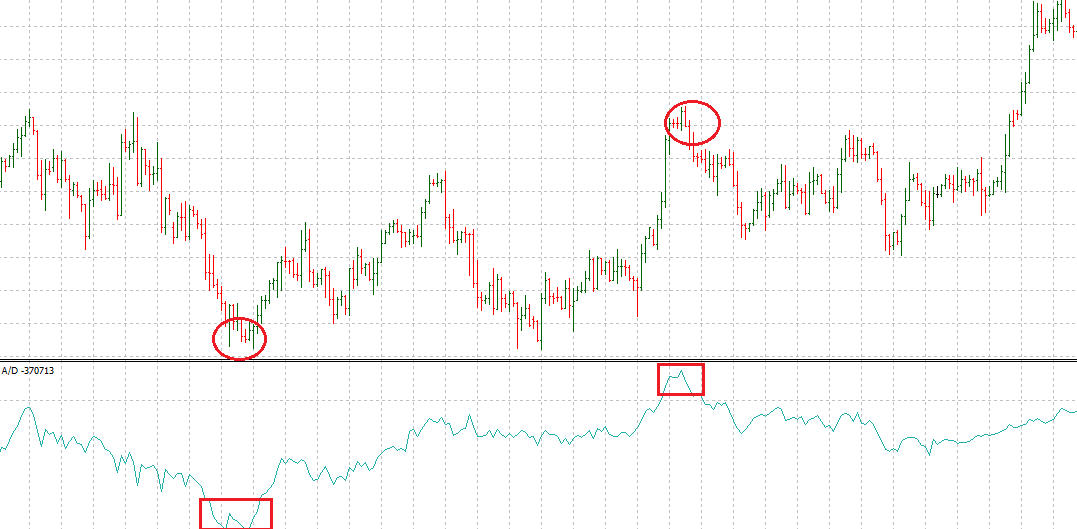
A/D is a very popular volume-based MT4 indicator. It measures the cumulative flow of money in and out of an asset. The concept is based on the market psychology that there’s always an end to an existing trend. Accordingly, the accumulation/distribution tool can indicate the end by measuring changes in volume.
Let's discuss A/D from the perspective of a bull market. Theoretically, a bullish trend is the result of a high volume of money flow in an asset. When investors are bullish, the volume tends to rise (or stay constant) in an uptrend.
On reaching a certain threshold, traders will take profit — which ultimately puts pressure on the rising price, forcing the volume to tumble. This divergence between rising price and decreasing volume is exactly what A/D tries to interpret. The divergence is a sign of potential reversal.
Average Directional Moving Index
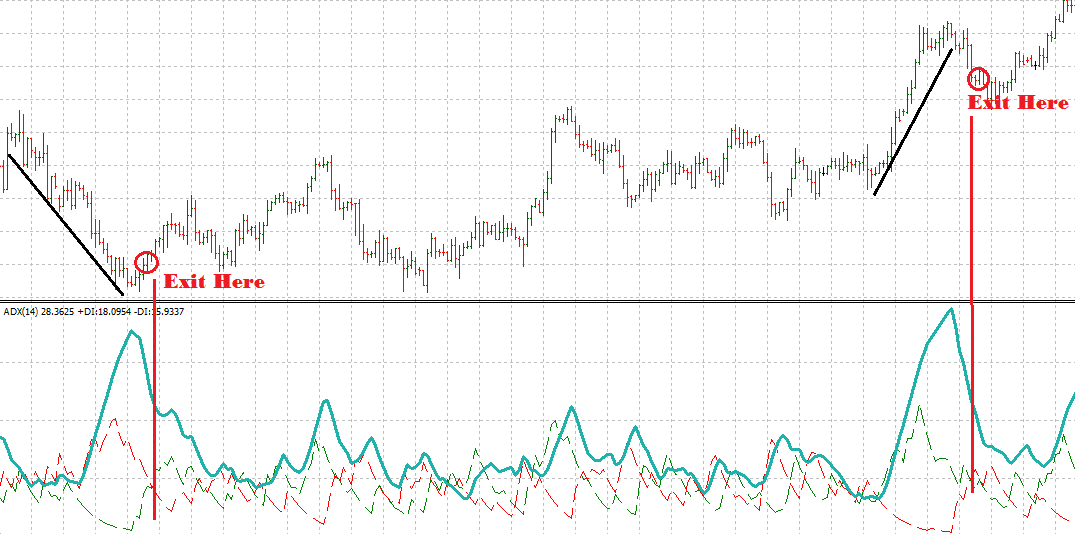
Average directional moving index (ADX) measures the strength of an existing trend. The value of the ADX is between 0 and 100, which indicates a range from weak to strong sentiments. According to J. Welles Wilder Jr., any value above 25 qualifies as a strong trend in the direction of the ADX line. Likewise, any value above 50 and 75, respectively, reflects a very strong trend and an extremely strong trend.
Whenever the ADX is under 25, the market is usually in a range, which means that there’s no particular trend in either direction. If you're interested in using ADX as an indicator, MT4 will automatically plot ADX in the same window as the two directional indicator (DI) lines, from which ADX is derived.
Use the DI lines to identify when you should buy (+DI is higher than -DI) and when you should sell (+DI is lower than -DI).
Bulls and Bears Power
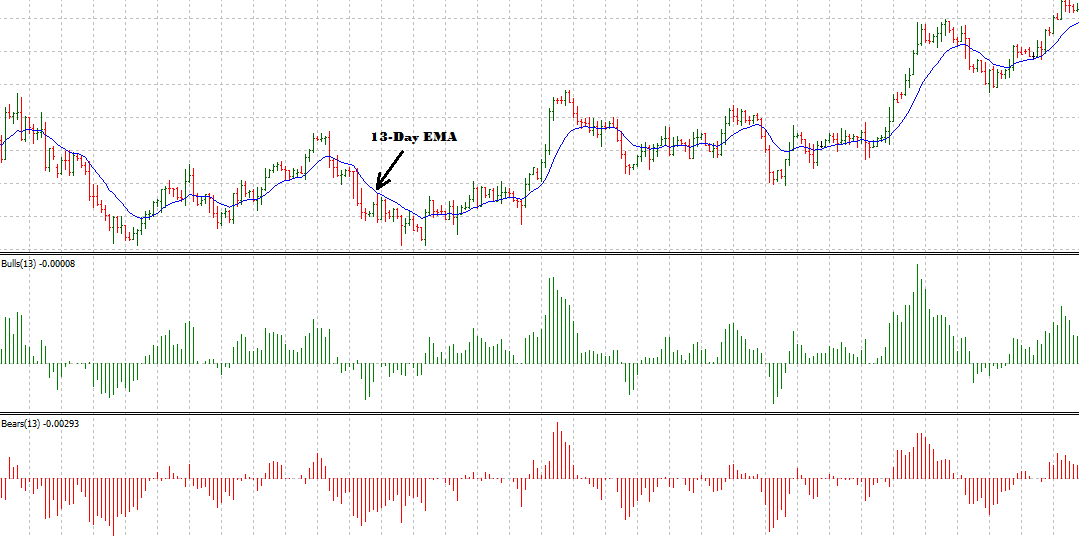
As the name suggests, Bulls Power and Bears Power are two different MT4 indicators. Each of these indicators tries to predict the future market trend. Based on your preference, you can either use them separately or plot them on the same graph.
The indicator is a relatively new concept developed by Russian-American professional trader Dr. Alexander Elder, both a psychiatrist and the author of the best-selling Trading for a Living (1993). From a practical perspective, this indicator is pretty straightforward to use. When using a Bulls Power indicator, any green bar above the "zero" line indicates the start of a potential uptrend. Alternatively, if you're using a Bears Power indicator, a red bar below the "zero" line indicates a future downtrend.
For accurate entry, traders use an EMA (exponential moving average) 13-day indicator. Dr. Elder recommends the 13-EMA for precise entries. For instance, the Bulls Power will likely prevail if the EMA 13-day moving average is in an uptrend, and the green bar is either above the "zero" line, or is negative but increasing.
For Bears Power, it's the other way round. If the EMA 13-day is sloping downward, short the cryptocurrency when the EMA 13-day moving average is in a downtrend, and the red bar is either below the "zero" line, or is positive but decreasing as well.
Force Index
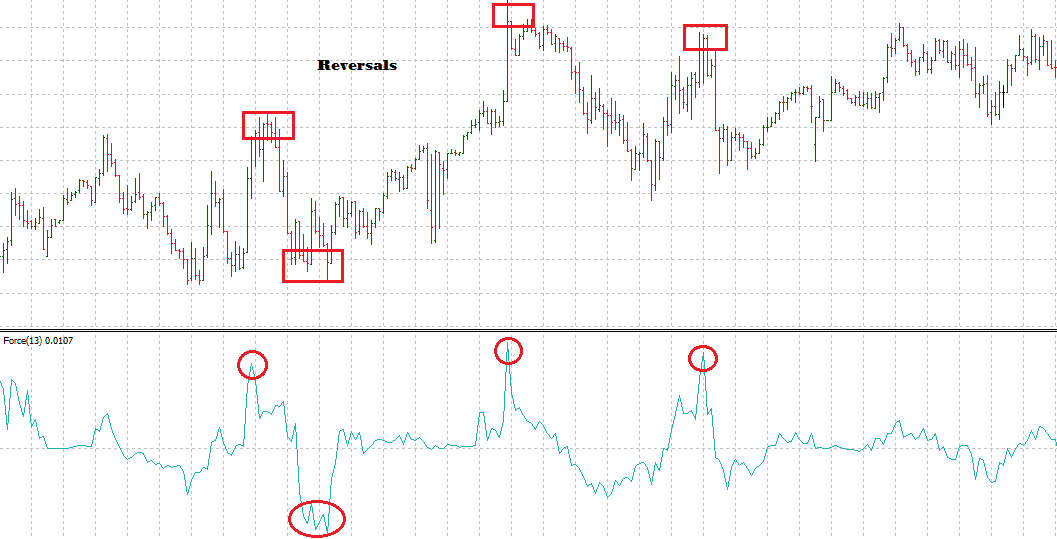
Force Index is another useful oscillator introduced by Dr. Alexander Elder. It measures the amount of power behind a particular market rally. Overall, it calculates the direction of price change, the extent of the change and the trading volume.
For practical readings, it's better to use the 13-day default period on the MetaTrader 4 platform. However, day traders and short-term investors can adjust the period according to their trading styles.
From a visual perspective, the force is often reflected in a sudden spike in the direction of the market price. If you're looking for a reversal, Force Index is probably one of the best MT4 indicators out there. On a similar note, the indicator is also used to gauge the overall trend in the market. If it's above the "zero" line, the market is in an uptrend, and vice versa.
On-Balance Volume
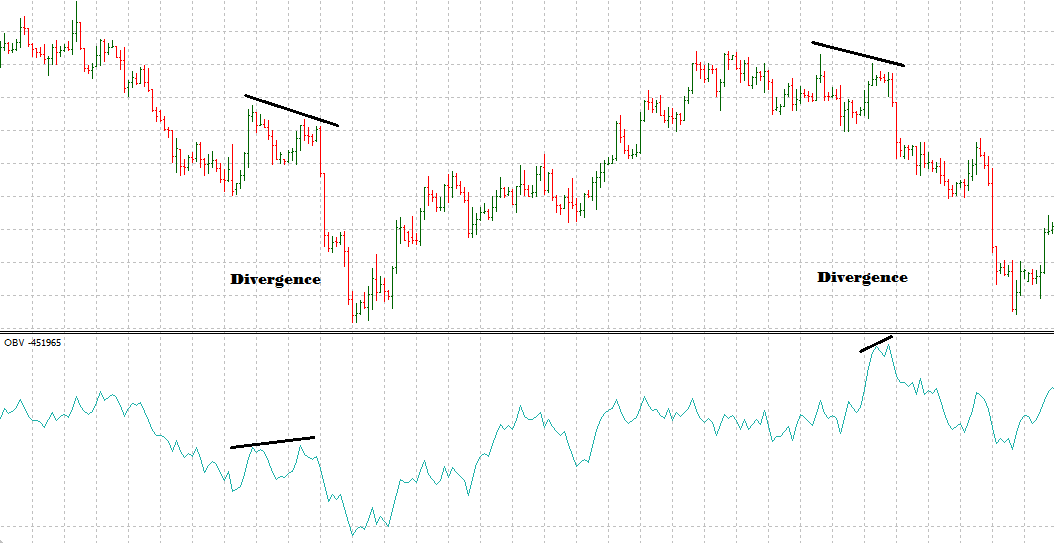
On-balance volume (OBV) is a simple indicator which plays out beautifully when divergence is formed. It measures buying and selling pressure by adding up the volume on up days, and subtracting the volume on down days.
Whenever the security closes higher than on the previous day, the indicator adds up the volume of the previous day. If the closing price is lower than the previous close, all of the day’s volume is considered down-volume.
Since on-balance volume uses a simple formula, you’ll notice similarities between the actual price graph of the asset and the OBV graph. Regardless of a somewhat similar trajectory, traders always look for a divergence. For instance, if the market is rising, look for higher lows on OBV. When the market is trending downward, look for lower highs.
Oscillator of a Moving Average
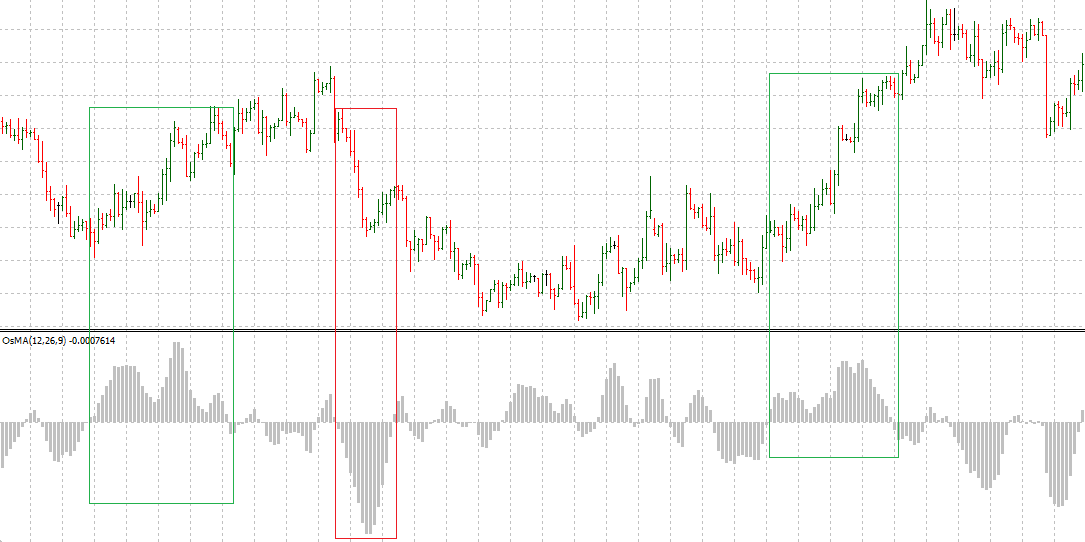
If you love trends, try OsMA, or oscillator of a moving average. It’s primarily based on the moving average convergence divergence (MACD) indicator. Unlike moving averages, OsMA can give you early signals to enter and exit a trade. An increase in OsMA reflects a bullish trend. Likewise, when the OsMA turns from negative to positive, it means that the price is about to change.
Short-term crypto investors can take advantage of OsMA to confirm an uptrend or a downtrend. If an uptrend is visible, you can use the positive bar of the OsMA to enter the market, and vice versa. Per the OsMA, exit the trade when the subsequent OsMA bar loses its strength. This is less risky in terms of a volatile market, as it enables traders to take small profits in uncertain conditions.
Heikin Ashi
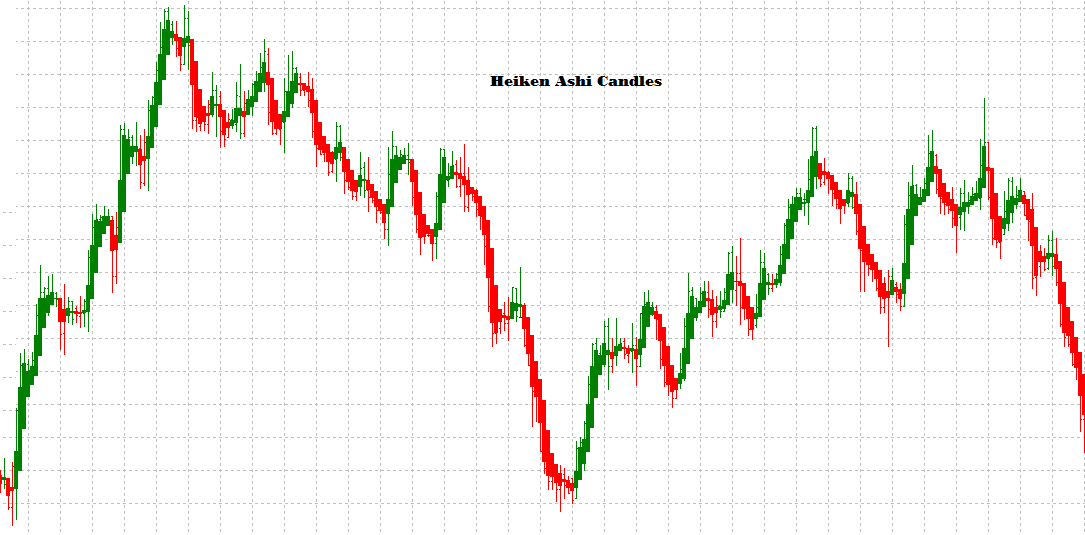
Heikin Ashi, is perhaps one of the most underrated MT4 indicators. If used correctly, it can help to rack up substantial profits for investors. Introduced by a Japanese trader, Heikin Ashi candles help create a smooth candlestick graph, helping traders make better trading decisions based on clean visuals.
On the MT4 platform, you can either superimpose the Heikin Ashi candles on the existing candlestick or open the indicator in a separate window. When implemented, you’ll immediately notice a smoother chart, because Heikin Ashi calculates the average of the price movement.
A Heikin Ashi candle without a shadow indicates a strong trend in either direction. A candle accompanied by a small body, surrounded by upper and lower shadows, suggests a potential reversal.
There are many ways to use the candle. When using it over the long run, you can set stops at the lower end of the Heikin Ashi candle. Swing traders can also open a trade in the opposite direction whenever their stops are hit. At this point, they may also re-enter the market if the signal fails to materialize.
Since Heikin Ashi indicates the average, keep in mind that the price of the Heikin Ashi may not be the actual security price. Therefore, it's better to place the Heikin Ashi chart in a separate window.
Zig Zag
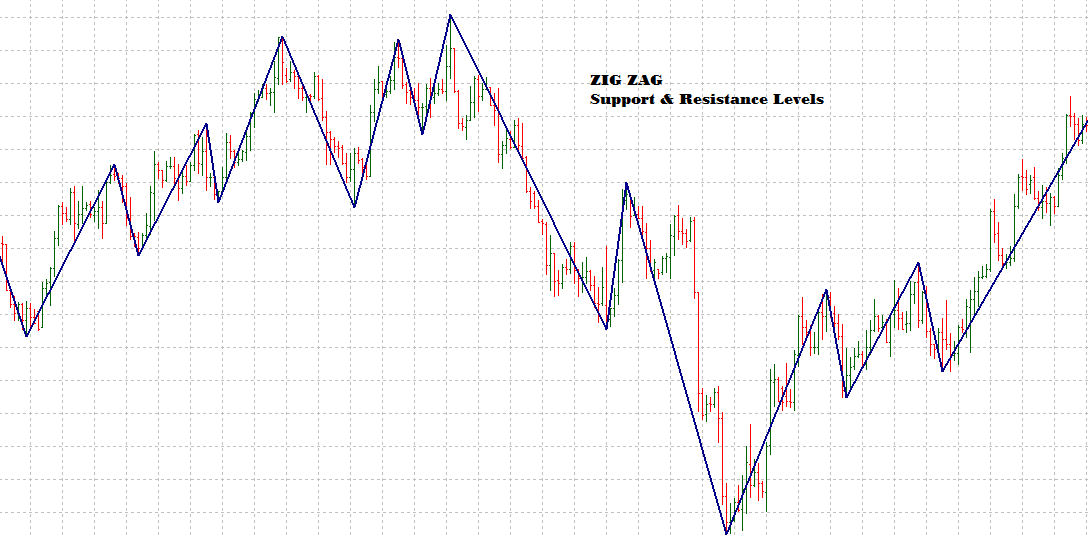
Zig Zag is a simple yet powerful indicator for swing traders. It's used to quickly determine support and resistance areas on a chart. The default setting for the indicator is 5%, but you can ideally use a setting greater than 10%. Any setting less than 10% is a bit similar to drawing the same bar chart.
Zig Zag is also used by traders who rely primarily on support and resistance levels. While it's one of the simplest MT4 indicators, it's nonetheless extremely useful in entering the market. Under normal circumstances, you can also figure out trade patterns including double bottom, head & shoulders, and triple stops.
Gator Oscillator
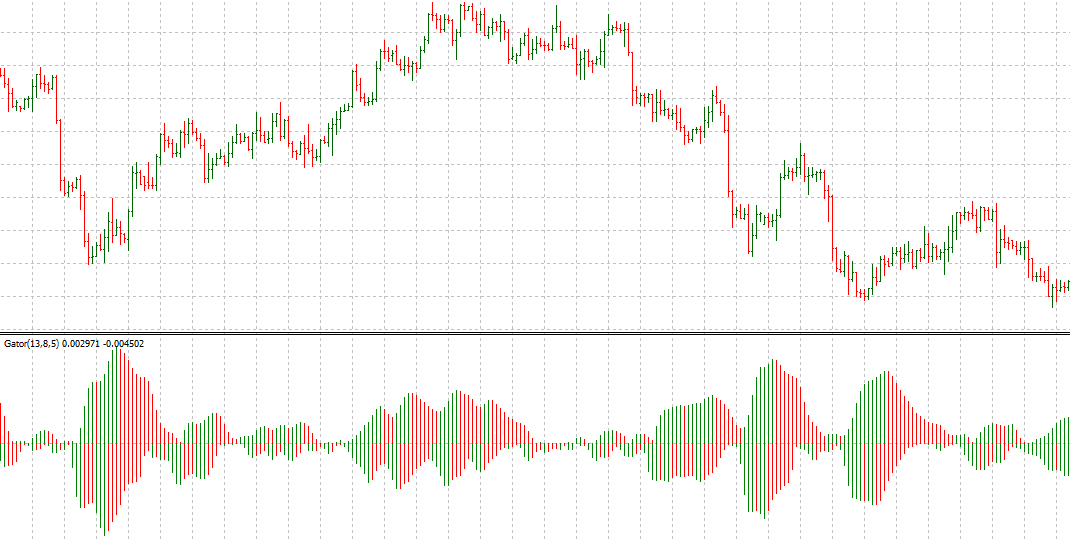
Developed by Bill Williams, Gator Oscillator is used to visualize a trend. There are two bars, green and red, on both sides of the zero line. According to its founder, the market is like an alligator that exhibits four stages of activity. At any given moment, the alligator is either sleeping, awakening, eating or sated.
If there are two red lines above the zero mark, it indicates little or no activity. It also means that the market is currently ranging. Likewise, the two green lines on either side represent a trending market. This is a confirmation to enter the market.
A green and red line on the oscillator indicate a reversal. You can use the signal to take profits or exit the market. While the gator oscillator is a useful tool, Bill Williams insisted that it should be used in conjunction with one of the other popular indicators that he devised for trade confirmation purposes.
On the MT4 platform, all major Bill Williams indicators are bundled together. These often include the Accelerator Oscillator, Alligator, Awesome Oscillator, Fractals, and Market Facilitation Index.
Relative Vigor Index
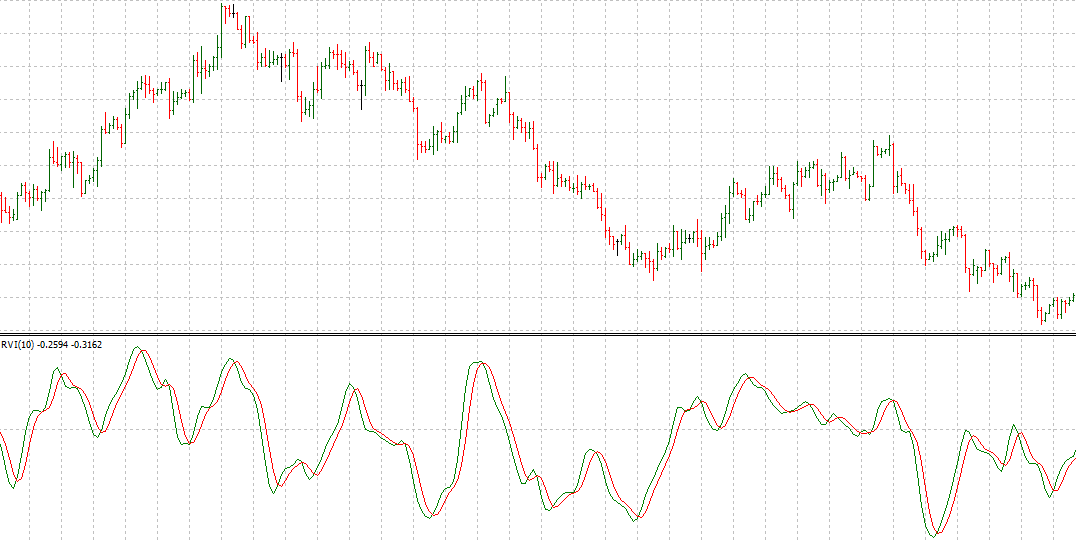
The relative vigor index (RVI) is a momentum indicator based on the theory that the price of a security closes higher during an uptrend, and lower during a downtrend. Accordingly, traders expect the value of the RVI to rise as a bullish trend gains momentum, and to fall when bearish sentiment takes over.
This MT4 indicator can generate highly effective signals for trading range-bound cryptos. It not only offers an intuitive way to enter a trending market, but also lets you get out of the trade before a potential reversal. In an uptrend, you can enter a market when the green line crosses over the red line. Similarly, it's the other way around in a downtrend.
This isn’t the only use for the RVI indicator. For instance, divergences between the RVI indicator and the price suggest a near-term change in the trend. This is indicated by higher highs of market price, accompanied by lower highs of RVI in a bull market; and by lower lows of market price accompanied by higher lows in a bear market.
How To Add MT4 Indicators
MetaTrader 4 has a user-friendly interface. Follow these steps to add indicators to your chart:
Click on the Insert menu located on top of the MT4 platform.
Select an indicator from the drop-down list. The list is often grouped to include similar MT4 indicators. If you can't find an indicator, try the Custom sub-menu on the list.
A pop-up screen appears after your selection. If you're not yet comfortable changing the indicator settings, use the default version. Otherwise, you can change the trade parameters and colors according to your preferences.
Once satisfied, click OK to add the indicator to the chart window.
If you've downloaded a custom indicator from another website, click on the File menu before selecting Data Folder on the subsequent drop-down list.
Select the appropriate MQL4 file from the folder. Once done, restart the terminal to locate the newly added indicator in the Custom indicator list.
The Bottom Line
There are hundreds of MT4 indicators that you can add to your trading chart. Irrespective of how you trade, there’s little proof that adding more than one indicator gives you a trading edge. Therefore, it's logical to try MT4 indicators that can stand alone without any additional input.