
How to Use Fibonacci Extensions for Consistent Trading Gains

Fibonacci extensions are used in technical analysis to achieve better forecasts, resulting in consistent trading gains. They are a powerful tool that can help you identify price targets, support and resistance levels, and potential market reversals. Below, we’ll look at what they are, what they indicate, how to draw them, and how Fibonacci extensions and Fibonacci retracements compare to each other.
Key Takeaways:
Fibonacci extensions are horizontal lines drawn on a price chart that indicate potential price levels for trend reversals or price targets.
The Fibonacci extension levels commonly regarded as strong support/resistance levels and potential price targets to consider are 0.618 (61.8%), 1.000 (100%) and 1.618 (161.8%).
An overlap or cluster of “fib extension” levels, combined with other support and resistance, provides a key level that often leads to at least a small reversal.
What Are Fibonacci Extensions?
Fibonacci extensions are horizontal lines drawn on a price chart to indicate potential price levels where a trend may target or reverse. These levels are calculated by applying Fibonacci ratios (typically 0.618, 1.000, 1.272, 1.618 and 2.618) to a significant price swing or trend. Traders use these extensions to identify areas of support and resistance when deciding to take profit or make a reversal trade.
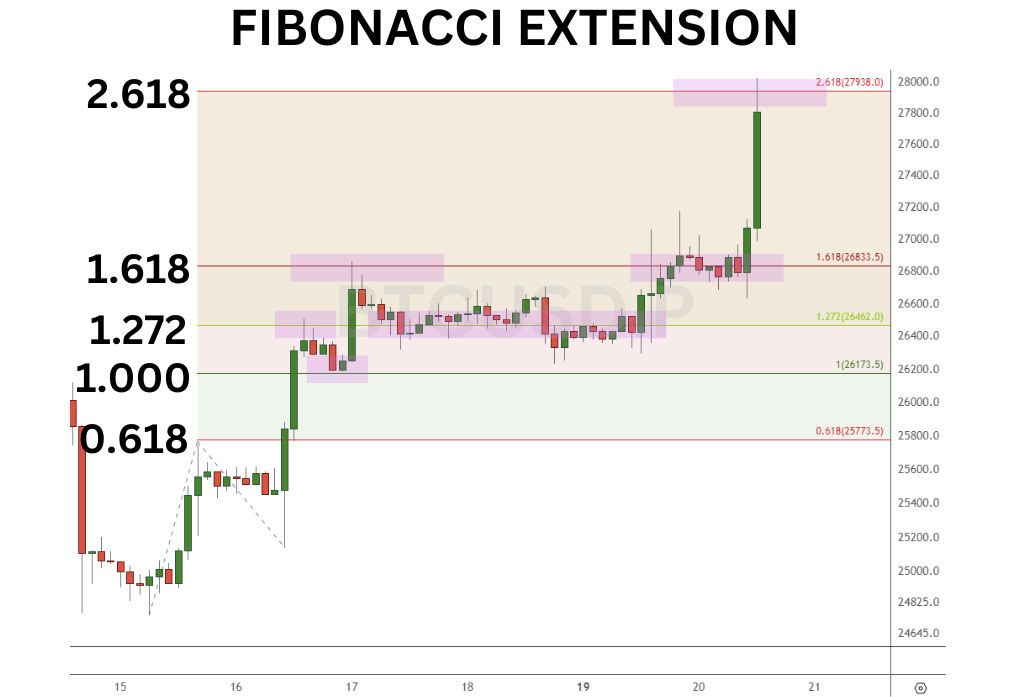
While the choice of Fibonacci extension levels ultimately depends on the trader's strategy and risk tolerance, certain levels have proven to be more reliable. The most commonly used Fibonacci extension levels include 0.618 (61.8%), 1.000 (100%) and 1.618 (161.8%), with 0.618 often regarded as a strong support or resistance level. According to Elliott Wave Theory, 1.000 is a common target for corrective wave patterns, and 1.618 is also called the “golden ratio,” viewed as a potential target for price extensions.
Determining the best time frame in which to trade Fibonacci levels largely depends on the trader's style and preferences. Fibonacci extension levels can be applied to any chart time frame, be it short-term intraday charts or longer-term daily or weekly charts. Shorter time frames, such as 15-minute or hourly charts, are preferred by day traders aiming for quick profits, while swing traders and investors often focus on daily or weekly charts to identify larger price targets and trends.
What Does Fibonacci Extension Tell You?
A trader who correctly applies the Fibonacci extension tool to significant price swings is armed with potential reversal points. This is a huge benefit for traders looking to exit the current trend or enter a trade on the next trend change.
Fibonacci extensions on a price chart reveal critical levels that indicate where a price move might extend to or encounter a rejection. These levels are calculated by multiplying the length of a previous price move by Fibonacci ratios, such as 0.618, 1.000, 1.272, 1.618 and 2.618. Traders use the levels to identify potential support and resistance and to set profit targets.
One of the primary insights Fibonacci extensions provide is the identification of price projections and profit targets. The levels obtained enable traders to anticipate where a price trend may potentially halt or encounter resistance, allowing them to plan their trades accordingly. For those already in the trade, these key price zones offer profit levels to consider closing the trade. For traders not in a position, these potential reversal zones may offer them the opportunity to place a reversal trade.
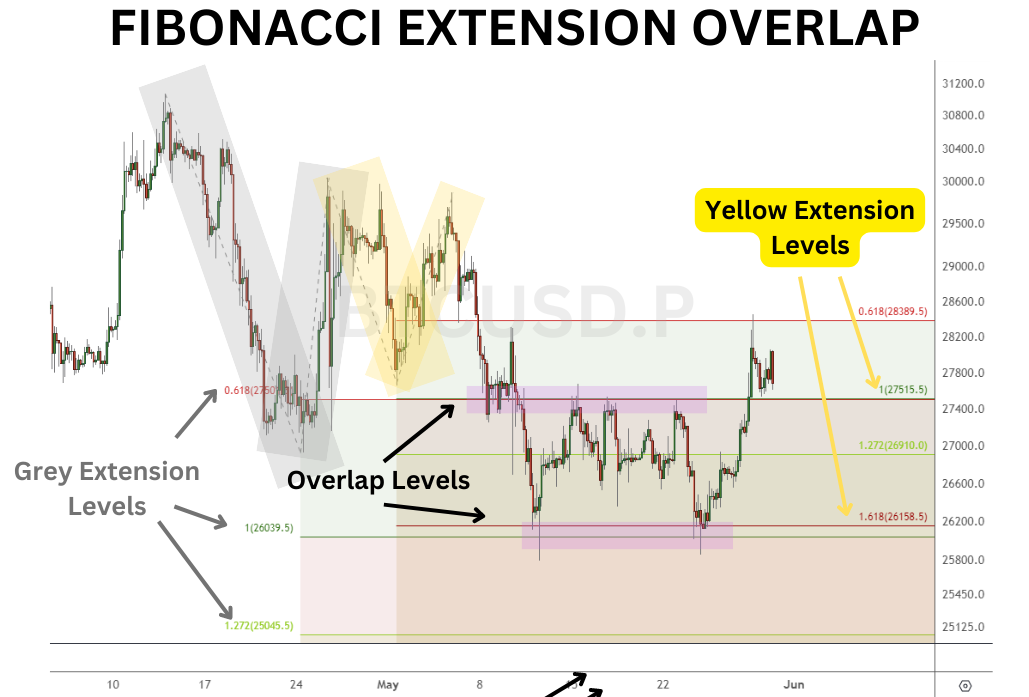
Traders skilled in technical analysis and Fibonacci extensions will seek out overlap and confluence of key levels on different chart time frames. When this overlap of price levels appears, it signals harmony within the various waves, increasing the potential for a reversal.
Additionally, when you stretch Fibonacci extension levels to the historic price action on the chart, you’ll find that other support and resistance levels may line up in the same price zone. This too is a stronger signal that the support and resistance level is likely to hold, at least initially.
How to Calculate Fibonacci Extensions
A Fibonacci extension comes from the numbers in the Fibonacci sequence. If you’re unfamiliar, the Fibonacci sequence is:
0, 1, 1, 2, 3, 5, 8, 13, 21, 34, 55, 89, 144, 233, 377 …
The next number is always the sum of the two preceding numbers, and continues without a limit. Important Fibonacci ratios are determined from this number string.
For example, let’s focus on the number 144. When you divide 144 by the number to the right of it (233), you get 0.618, or 61.8%. When you divide 144 by the number to the left (89), you get 1.618, or 161.8%.
The 1.618 ratio is considered a golden ratio for reasons beyond the scope of this article. This golden ratio is found abundantly in the natural world. As a result, it’s been applied to markets, and traders use Fibonacci to help manage their trades.
If we continue to compare 144 by two numbers to the left (55), we get 2.618, or 261.8%. In theory, you can apply this little math equation to any number in the sequence and the ratios will approach 61.8%, 161.8% and 261.8%.
Another common number is used with the extension tool at 100%. This is conceived when you compare the numbers at the beginning of the sequence (1 and 1). When you divide 1 by the number to its left (1), you get 100%.
How to Draw Fibonacci Extensions
The Fibonacci extension tool is a 3-click-tool on your charts. Here is a simple process to draw it.
Find and activate the Fibonacci Extension drawing tool in your charts. If you don’t see it initially, it might be named Fib Extension or Trend-Based Fib Extension, or it might even be mislabeled as Fib Expansion. Please note that some charts may offer the tool as a 4-click drawing, and that’s okay, too.
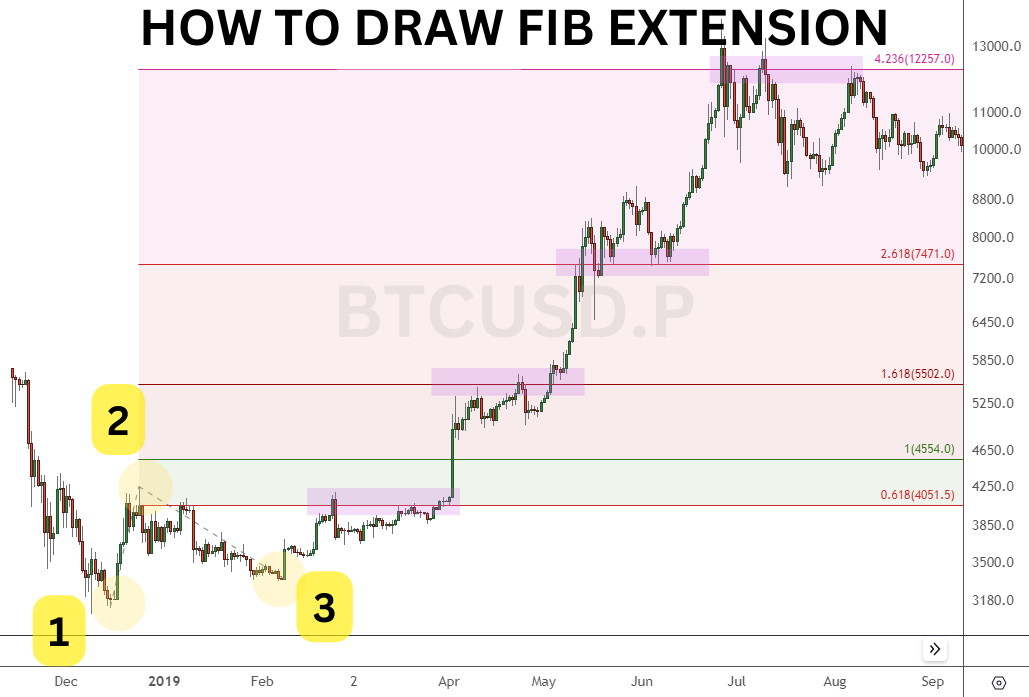
Follow these directions to draw the fib extensions on your charts.
If the market is in an uptrend, find a swing low to start the drawing as your first click.
Then, find the next swing high in price and click again for your second click. Essentially, Fibonacci extensions measure the length of the trend between the first and second clicks.
Third, find the next swing low after the second click. This swing low should be above the swing low used for the first click. Effectively, this swing low is a retracement of the previous rally, and is lower than the swing high. Place your third click at this swing low.
At this time, the Fibonacci levels will appear as horizontal lines on your chart.
In the Bitcoin example above from 2018–19, notice how Bitcoin’s price stalls and hesitates near several of the Fibonacci levels (0.618, 1.618, 2.618 and 4.236).
The Fibonacci tool is also used in downtrends, using the same principles to project how deep a correction might travel.
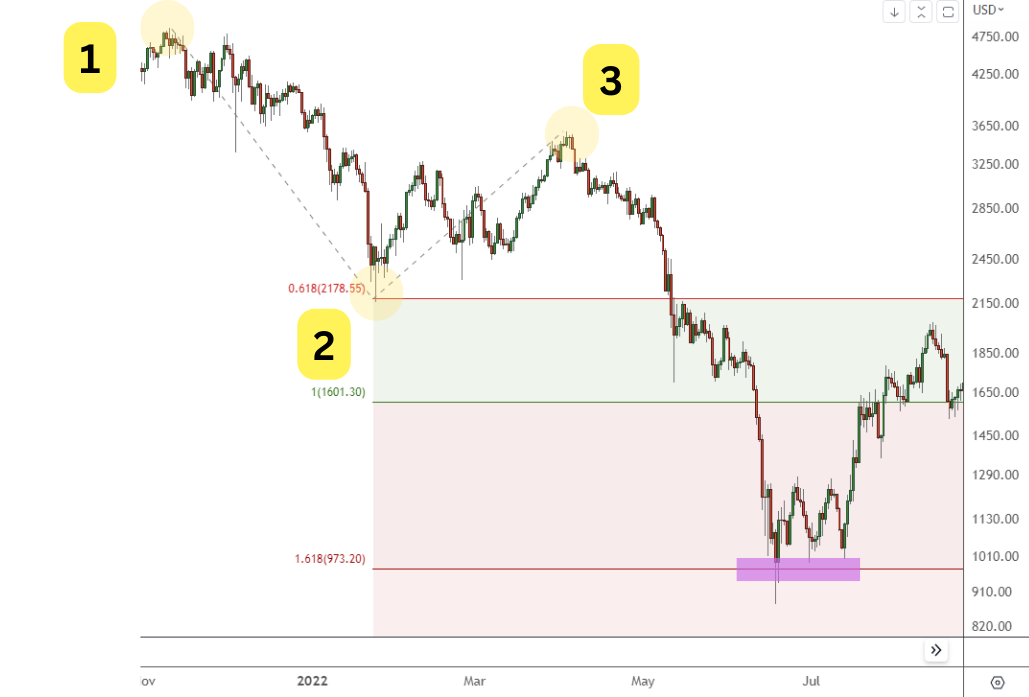
In the above chart, Ethereum begins to decline in early 2022 after reaching an all-time high in 2021. Then, after a brief rally, Ethereum begins to correct even further.
After applying the Fibonacci extension tool to the decline, the 2022 price low appears at the 1.618 Fibonacci level. From the June 2022 low, Ethereum rallies nearly 100%, and the Fibonacci extension tool helps identify a support level where the correction will end.
How to Use Fibonacci Extensions to Trade Crypto
The primary use of the Fibonacci extension tool in crypto is to estimate the target price for the end of a trend.
Here are two trading strategies for how a trader might use this information.
#1: Estimate the End of a Bullish Trend to Exit a Long Trade
The first trading strategy applies when a trader is long in a position, and needs to know when to exit the trade. Fibonacci extensions can help many traders determine potential turning points.
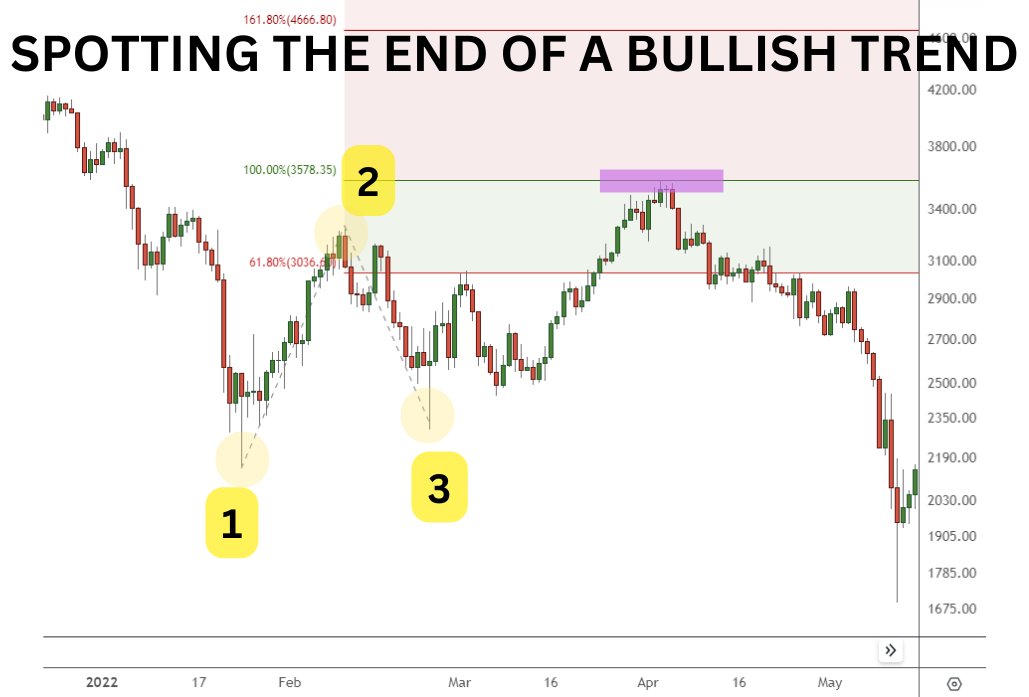
In Mar 2022, Ethereum is rallying hard. After pausing briefly, its price continues higher, reaching the 100% level. Then, Ethereum carves a hanging man, one of the many candlestick patterns traders follow. Since a hanging man is a bearish pattern that forms near significant resistance at the top of a bullish trend, it suggests the market will reverse soon. The next day, Ethereum begins a decline of nearly 50%.
#2: Estimate the End of a Bearish Trend to Open a Long Trade
Bear markets in crypto can become … well, unbearable. The second trading strategy is to use the Fibonacci tool by estimating potential support to see where the correction might end. This offers traders a chance to buy into the crypto market at a cheaper price.
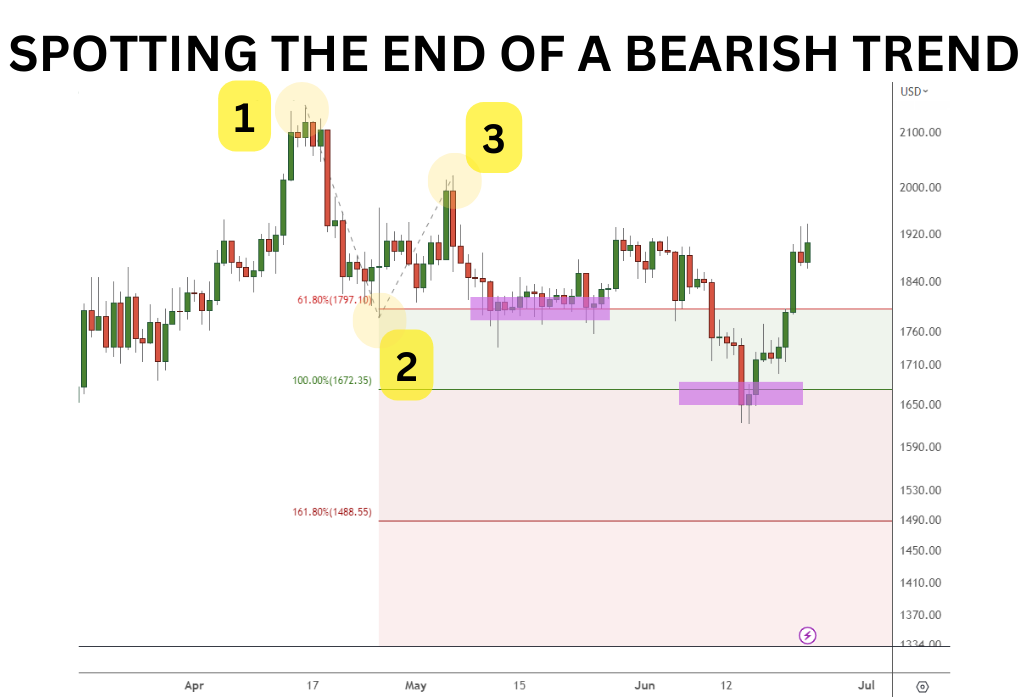
Above is a bearish Ethereum trend, between Apr and Jun 2023.
When drawing the Fib extension, notice how the price pauses at the 61.8% level, then eventually corrects further to the 100% extension. As tails form out of the downside of the candlesticks, it indicates the market is respecting this Fibonacci extension level. As a result, the trader can begin to formulate the trading strategy to enter in preparation for an uptrend.
In this case, once the 100% extension is reached, Ethereum rallies about 15% in just over a week.
Fibonacci Extensions vs. Fibonacci Retracements
The concepts of Fibonacci extensions and Fibonacci retracements are built around the same Fibonacci sequence. However, how you draw the tools and what information you glean from them differ.
For example, the extension tool is a 3-click tool that measures how far the trend wave is likely to travel. As a result, it requires three points to measure out the first wave, and then project it onto the next wave.
On the other hand, the Fibonacci retracement tool is used simply to see how far the countertrend wave will travel, based on the length of the original wave. Therefore, the Fibonacci retracement tool only needs two points to measure the length of the trend wave effectively.
Lastly, the most common Fibonacci levels for each tool are different. Extension levels generally fall at 100% or greater, while Fibonacci retracement levels are less than 100%
Fibonacci Retracement | Fibonacci Extension |
2-click drawing tool | 3-click drawing tool |
Measures pullbacks within an uptrend and bounces within a downtrend | Measures how far an uptrend or downtrend will extend |
Measures how far the countertrend wave will travel | Measures how far the trend wave will travel |
Generally used Fibonacci Ratios: 23.6%, 38.2%, 61.8% and 78.6% | Generally used Fibonacci Ratios: 61.8%, 100%, 161.8% and 261.8% |
Advantages and Limitations of Fibonacci Extensions
Fibonacci extensions offer traders a valuable tool for chart analysis, aiding in identifying price targets and potential resistance zones. However, it’s vital to understand both the advantages and limitations of utilizing these extensions in order to make informed trading decisions.
Advantages
Price Target Identification: Fibonacci extensions help many traders identify potential price targets, allowing for more precise profit-taking and trade planning.
Universal Application: Fibonacci extensions can be applied to any market and/or time frame, making them versatile tools for traders across different asset classes.
Potentially Overlapping Levels:Different Fibonacci extension levels can overlap or cluster around the same price area. This cluster or overlap typically leads to a price reversal, providing traders with a clue to exit trades or possibly enter a reversal trade.
Limitations
Subjectivity in Price Swing Selection: Choosing the appropriate price swing to which to apply extensions requires some practice. Traders of different skill levels may select slightly different swings, potentially leading to variations in where the extension levels land.
Insufficient as Sole Indicator: While Fibonacci extensions provide valuable insights, they’re more effective when combined with other technical indicators or chart patterns to form a comprehensive trading strategy.
Ineffective in Trendless or Choppy Markets:Fibonacci extensions work best in trending markets, and can be less effective in range-bound or choppy market conditions where price swings are less prominent.
The Bottom Line
By leveraging the Fibonacci extension, traders can gain valuable insights into price projections, support and resistance areas, and potential reversal zones. While the fib extension tool has its limitations, when used in a trending market it can be applied to a variety of chart time frames, making it a favorite tool among traders.
#Bybit #TheCryptoArk