
The 6 Best Swing Indicators in 2023

Swing trading is one of the most common trading styles, along with day trading and position trading. For beginners, this trading style is less intimidating since it’s less hectic and stressful than day trading, but comfortable enough for traders to profit from price fluctuations.
Traders who favor this kind of trading style usually rely on swing trading indicators, as it’s essential for them to identify support and resistance levels when the trend changes, thereby providing trade opportunities. Using multiple technical indicators is often recommended in order to confirm a trend before entering a trade, because a single technical indicator may be inaccurate at times, and additional confirmation is necessary.
This article will introduce cryptocurrency swing trading and describe some of the best technical indicators you can use to get started.
What Is Swing Trading?
A swing trader opens a position based on their expectation of prices, in hopes of capturing a profit when the market moves in the expected direction. Swing trading positions are usually held overnight, and can stay open for days or weeks.
Swing trading is based on the concept that price retracement is a common phenomenon in the cryptocurrency market. When a price moves up and down, it’s known as a swing. Swing traders take advantage of these variations to enter trade positions and capture profits. Even though some swings may be smaller in magnitude, which translates to a smaller profit, as long as a swing trader is consistent in executing their trade, they can eventually make and accumulate significant profit. Technical indicators are often used to help swing traders identify entry and exit points for their positions.
A common trading method, swing trading uses an indicator known as Bollinger Bands® to plot a number of standard deviations around a moving average, while some traders prefer the average true range indicator to quantify volatility in the crypto market. Either way, combining different swing trading indicators is essential to understanding and predicting cryptocurrencies’ price actions for improved decision-making.
How Swing Trading Works
Before describing the best technical indicators for swing trading, let’s look at an overview of a swing trade.
With swing trading, you can hold your position open for several days or weeks, as long as the trend carries on in your predicted direction. Traders usually choose to close their position when the trend shows signs of reversal. Given that swing traders operate with larger time frames, they aren’t interested in short-term price volatility as day traders are. For swing traders, the only thing that matters is for swing highs to go higher in a bullish market, and for swing lows to go lower in a bearish market.
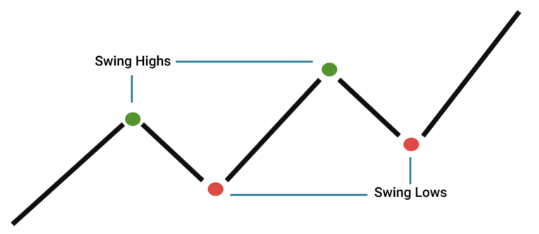
Swing High
Swing highs are consecutive peaks touched by a cryptocurrency’s price before fleeting moments of retracement. Sometimes the retracement can turn into a trend reversal, which breaks the consecutive swing highs. A current high that’s higher than the previous peaks can be identified as an uptrend.
Swing Low
Swing lows are consecutive lows made after the temporary moments of rebounds. When the current low is lower than the previous ones, we can determine a generally bearish trend.
Some swing traders prefer to trade between swing highs and lows only, which usually becomes a shorter-term version of swing trading.
Swing Trading Indicators
Swing trading indicators use mathematical calculations to determine various aspects of a price action based on historical data. They can be implemented on a daily chart, or with any other time frames used by swing traders to assess the market situation.
These indicators help traders determine whether a trend is bullish or bearish and whether it has momentum. While some swing traders rely more on news and fundamental analysis, technical indicators are imperative to determine the best entry and exit points.
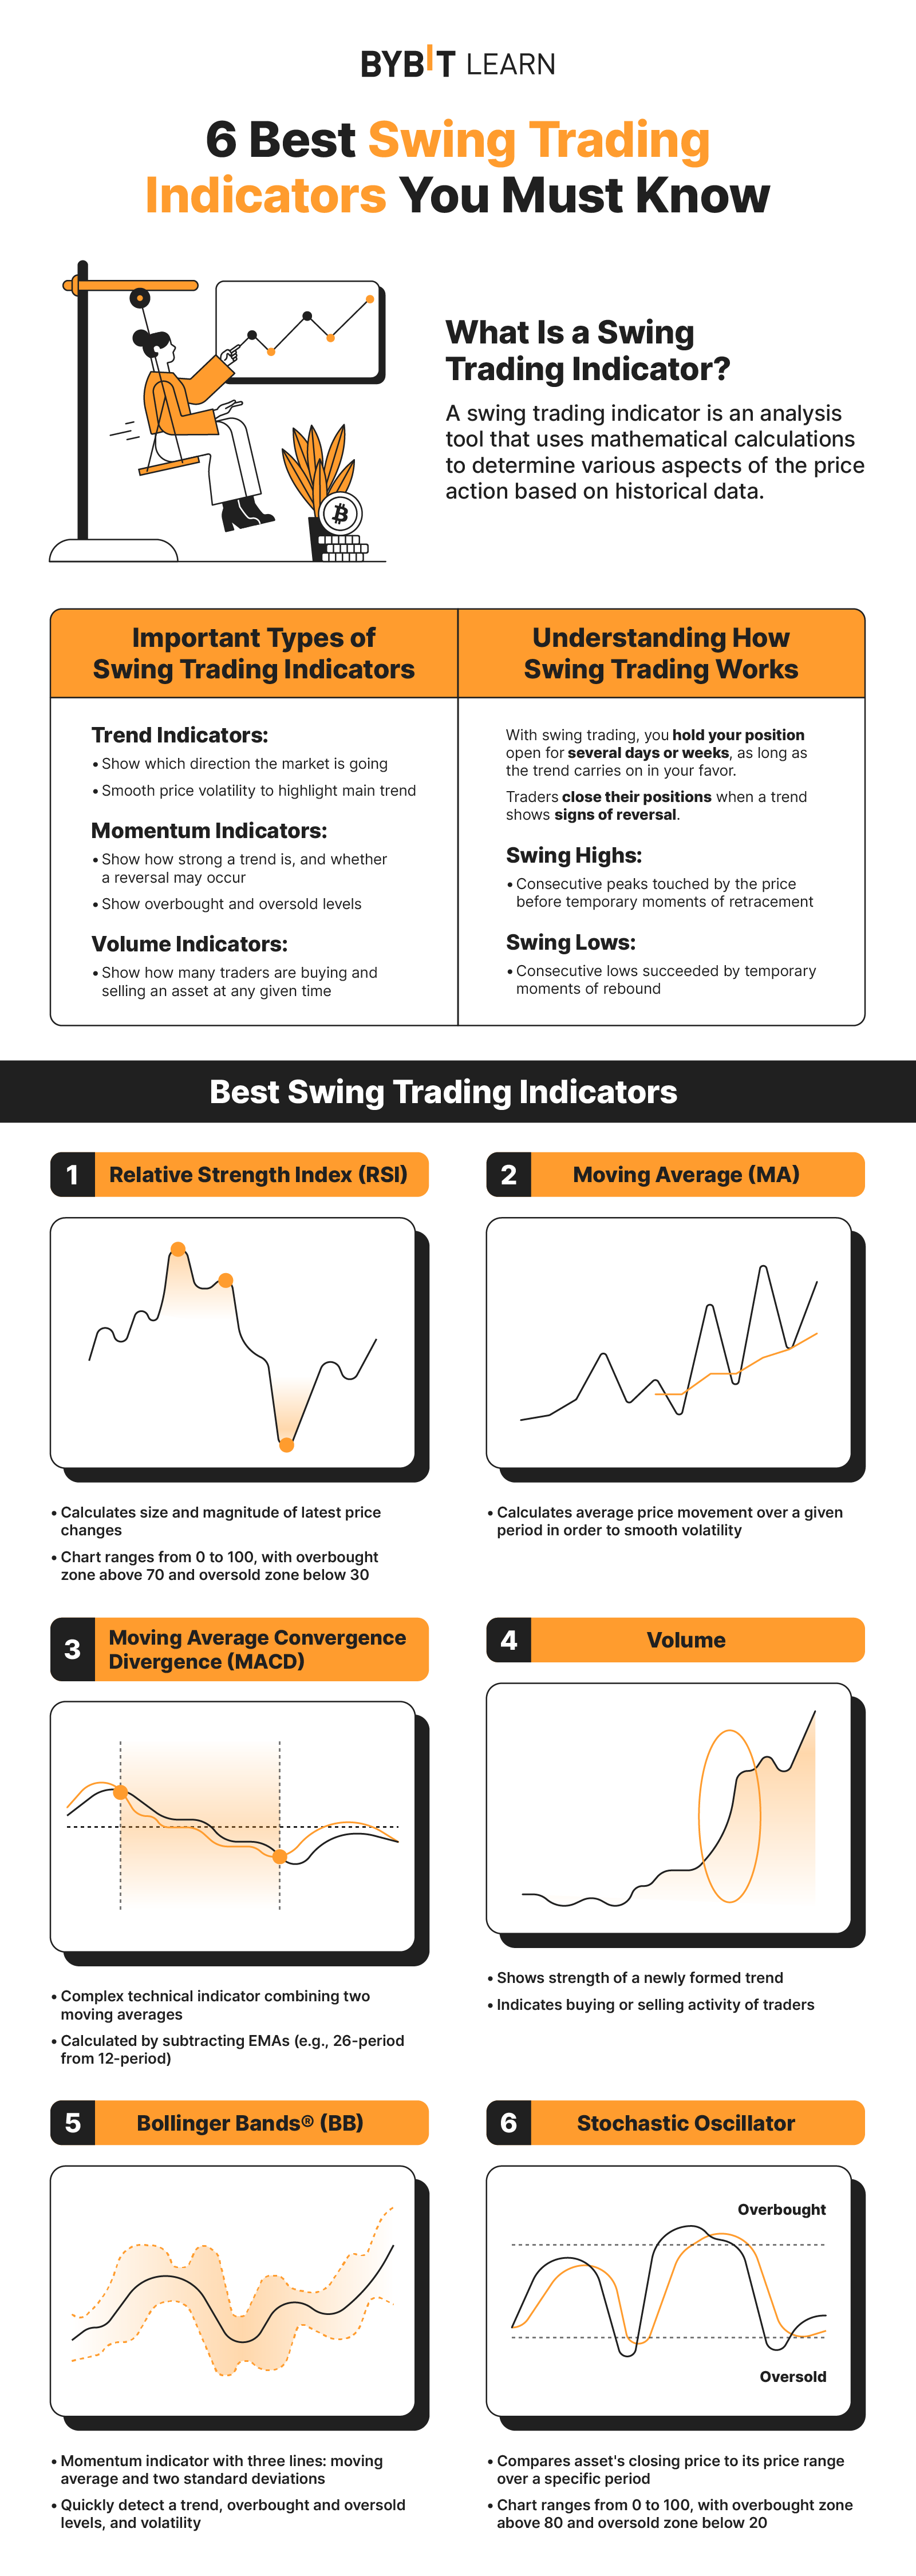
The three most important types of swing trading indicators are as follows:
Trend indicators — These indicate the market’s direction, and whether a trend can be established. Generally, trend indicators are used to smooth out price volatility in order to highlight the primary trend. Moving averages are the most well-known trend indicators.
Momentum indicators — Momentum indicators show how strong a trend is and whether a reversal might be on the horizon. They can also indicate overbought or oversold levels. The most commonly used momentum indicator is the relative strength index (RSI).
Volume indicators — These indicate how many traders are buying and selling an asset at any given time.
Best Swing Trading Indicators
In this section we’ll cover some of the best swing trading indicators. However, it should be noted that regardless of which indicators are used, it’s almost impossible to guarantee profits. This is because technical indicators are utilizing historical data to predict the future, and there will always be certain inconsistencies that will lead to different outcomes.
Here are the six most popular technical indicators used in swing trading.
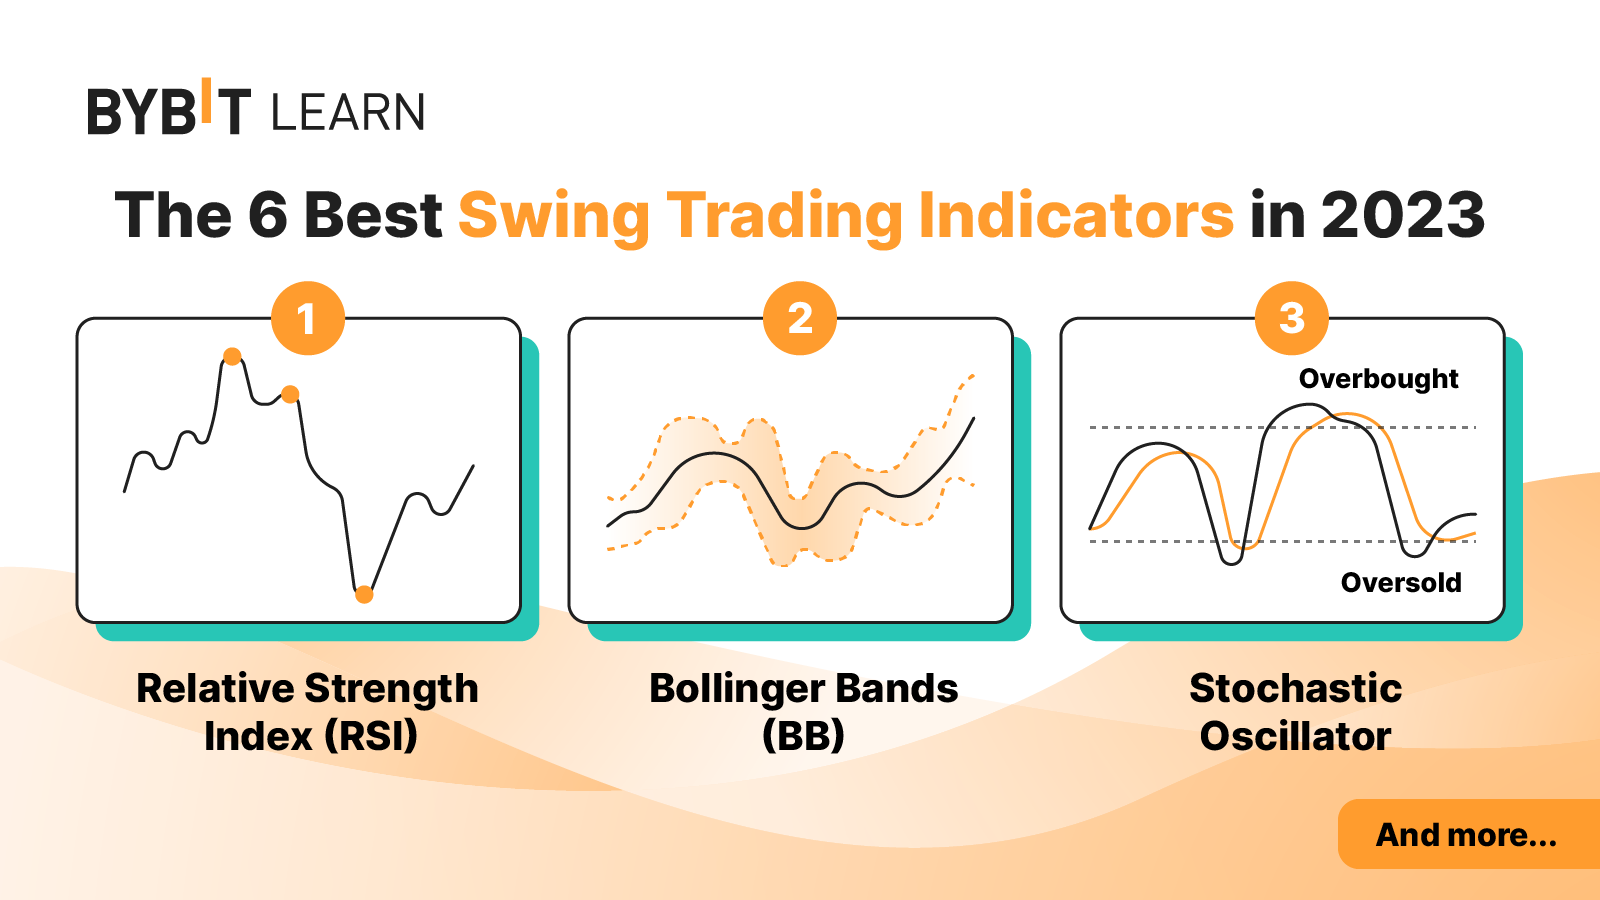
1. Relative Strength Index (RSI)
The RSI is one of the most important cryptocurrency trading indicators. You may find it under the category of “oscillators” as well. It calculates the size and magnitude of the latest price changes. Swing traders use the RSI indicator mostly to determine overbought or oversold levels of a cryptocurrency.
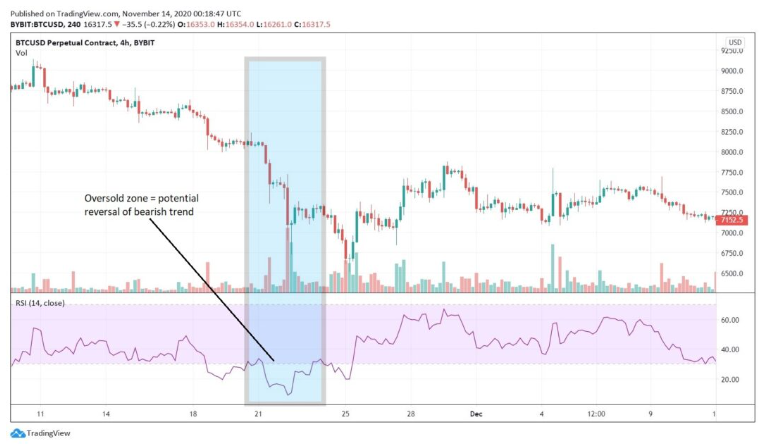
The RSI indicator is displayed as an oscillator — i.e., a line graph that moves between two extremes, ranging between 0 and 100.
When the RSI indicator is above 70, it typically signals that a particular cryptocurrency is in overbought territory, suggesting a potential reversal to an existing uptrend. On the other hand, when the RSI drops below 30, it indicates an oversold market and you can anticipate that the bearish trend could be coming to a stop soon.
Another way to use the RSI is to look for center line crossovers. For instance, when the RSI indicator breaks above its center line, it points to a rising trend.
2. Moving Average (MA)
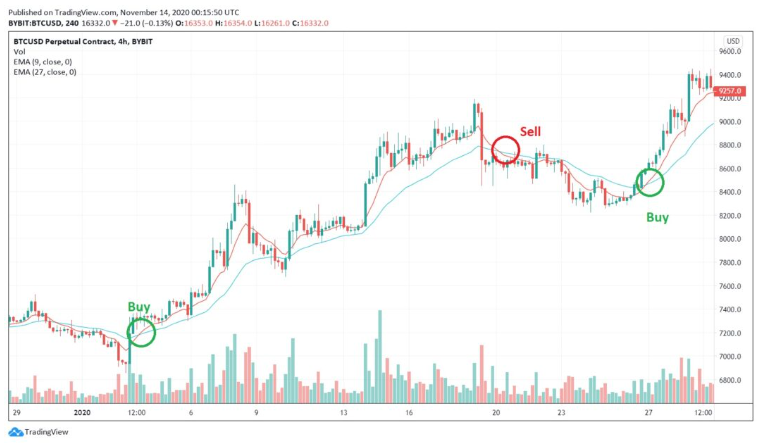
Moving average is also commonly used for technical analysis of commodities and company shares in traditional finance markets. As its name suggests, swing traders use MA to calculate an asset’s average price movement over a given period. As a result, MAs smooth out short-term volatility that may appear confusing for traders, blurring potential trends.
It’s important to understand that MAs are lagging indicators, which rely on past price action. Thus, it helps if you use them to confirm a trend rather than predict future moves.
We can distinguish between short, medium and long-term MAs, depending on how many periods they monitor. For example, short-term MAs cover between 5 and 50 lookback periods, while medium-term MAs cover up to 100.
There are two main types of MAs: simple moving averages (SMAs) and exponential moving averages (EMAs). The latter emphasizes more recent price action by giving it a higher weightage.
Typically, a bullish signal is established when a short-term MA crosses over a longer-term MA, and vice versa: When a longer-term MA crosses below a short-term MA, be cautious of a potential downtrend.
3. Moving Average Convergence Divergence (MACD)
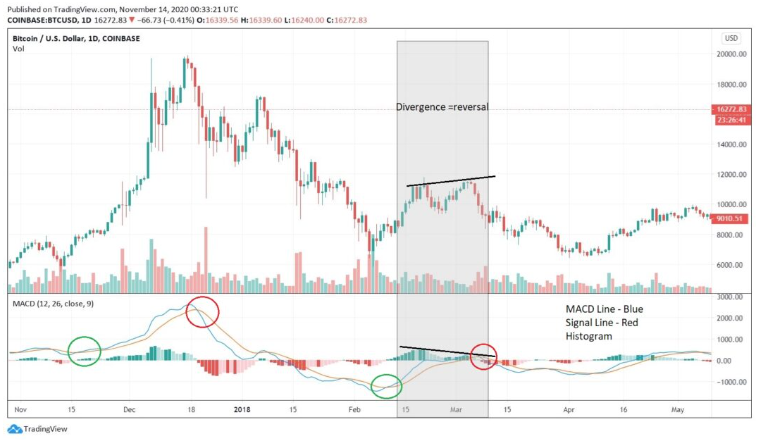
Moving average convergence divergence (MACD) is a more complex technical indicator that merges two regular moving averages. MACD is calculated by subtracting the 26-period EMA from the 12-period EMA, though these parameters can be adjusted manually based on your needs. To be clear, the two lines displayed on an MACD chart don’t represent the two MAs used for the calculations. Instead, here are the three elements of the MACD indicator:
The MACD line, which calculates the distance between two MA selecteds
The signal line, which can spot changes in price momentum, and is regarded as a trigger for bullish and bearish signals
The histogram, which represents the difference between the MACD line and the signal line
Swing traders usually buy when the MACD line crosses above its signal line, indicated by the green circles in the figure above, and go short when the MACD crosses below the signal line, shown by the red circles.
Another way to use the MACD is to look for divergence between the histogram and the price action, which usually anticipates a trend reversal.
4. Volume
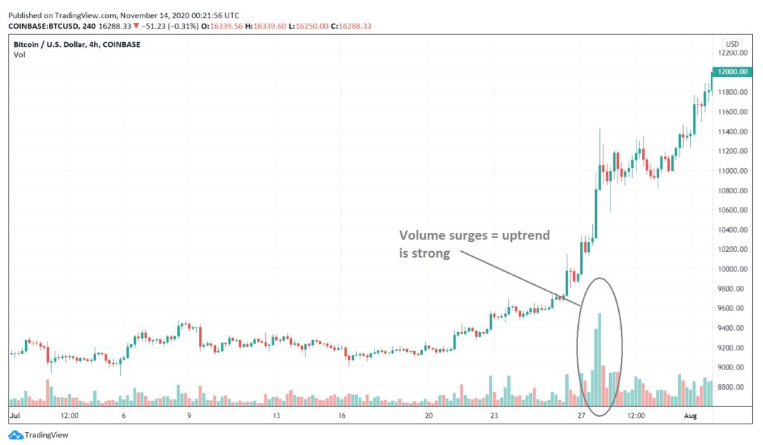
Volume is one of the most critical indicators for swing traders, though beginners often ignore it. This indicator can be indicated by default below the main chart. It offers insight into how robust a newly formed trend is. Basically, the volume indicator tells us how many traders are buying or selling a cryptocurrency or asset at a given point. Thus, the higher the volume, the stronger the trend.
Volume is especially useful with breakout strategies, i.e., when an asset’s price breaks above a resistance line or below a support line. If the breakout is accompanied by high volume, then the new trend is expected to be substantial.
5. Bollinger Bands (BB)
Bollinger Bands® (BB) are a momentum indicator consisting of three lines — a moving average and two standard deviations (positive and negative). Swing traders favor this indicator because it quickly detects a trend, overbought and oversold levels, and volatility. Also, it appears nice and clear on the chart.
The width of the BB increases along with volatility, and declines when the market is experiencing lower levels of volatility. Simply put, the closer the bands are to each other, the lower the volatility.
While BB work well in trending markets, they do an especially great job when the price is ranging, i.e., moving up and down inside a horizontal channel. In this case, when the price touches the upper line, swing traders may go short. When the price touches the lower line of the indicator, this may precede a rebound.
The point is that the price will always tend to move toward the center of the BB. If the width between the bands starts expanding, then a new trend is forming, and you need to be wary of trading within that band.
6. Stochastic Oscillator
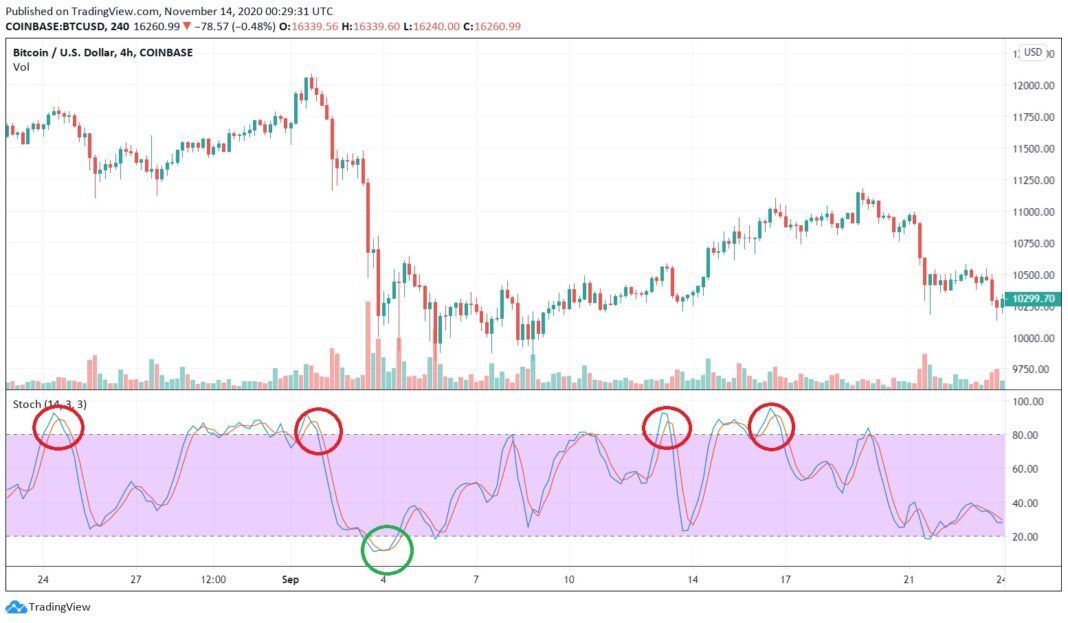
The stochastic oscillator is another momentum indicator. It works similarly to the RSI indicator, though it has different calculations. This indicator compares the closing price of an asset to the range of its prices over a certain period.
Like the RSI, the stochastic oscillator is represented by a chart between zero and 100. However, overbought and oversold zones are above 80 and below 20, respectively.
Another difference is that the stochastic consists of two lines, rather than just one as with RSI. One line shows the current value, and the other line is a three-day MA.
Traders use the stochastic to determine overbought and oversold levels. They also watch for the two lines to cross, which generally anticipates a trend reversal.
Best Swing Trading Tools to Use
The trading indicators described above can be great tools when it comes to providing relevant signals, but they become even more efficient if you combine them with other chart tools. Here are some suggestions.
Support and Resistance Lines
A swing trader needs to always pay attention to support and resistancelevels that a cryptocurrency’s price has had difficulties breaking.
In short, a resistance level is an imaginary upper line that a price fails to break (usually falling upon touching the resistance). On the other hand, a support level is an imaginary line made of recent lows, at which a price typically stops declining and rebounds upward.
Chart Patterns
Swing traders can also look for chart patterns, usually observed on candlestick charts. There are two main categories of patterns:
Trend continuation patterns, which anticipate the continuation of a trend; some examples are triangles, rectangles, flags, and pennants
Trend reversal patterns, which signal the reversal of a trend; some examples are double tops or bottoms, and head and shoulders
Final Thoughts
Swing trading might be the ideal trading style for beginners, and trading indicators can help you benefit from price volatility.
However, even though price moves in swing trading are idle, don’t ignore basic risk management techniques. By using a stop loss, you can prevent your balance from being wiped out.
Trading indicators may fall short of traders’ expectations. Still, technical indicators weren’t designed to forecast future price moves with 100% accuracy, but rather to help you make better decisions based on in-depth market insights and historical data.
#Bybit #TheCryptoArk
