
Bybit Options Weekly Review: May 26–Jun 2

TL;DR
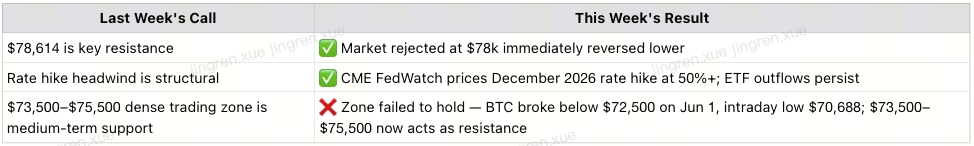
Last week's calls validated in full: $78k+ was resistance; the market was rejected there and dropped directly to ~$73,500; intraday low on Jun 1 hit $70,688 before recovering to ~$71,200 (current price)
A new resistance level has formed at $74,000 (Fibonacci 0.382, building since last Friday) — whether BTC can reclaim it is the most critical observation for next week
BTC's technical pattern has produced a Head & Shoulders formation — a bearish reversal signal; if the neckline breaks, the measured target is $65,000–$67,000
U.S. equity options alert: S&P 500 call option notional volume surged past $2.6 trillion in a single day, setting an all-time record; Goldman Sachs warns the market has entered "semi-irrational chasing" mode; Wells Fargo's contrarian sentiment indicator triggers a sell signal for the first time since November 2021 — the long-on-long squeeze hasn't started yet, but the fuse is lit
Strategy this week: DVOL at historic lows + real downside risk = recommending a small allocation to June BTC Put options as tail-risk protection
I. Last Week's Calls — Validated
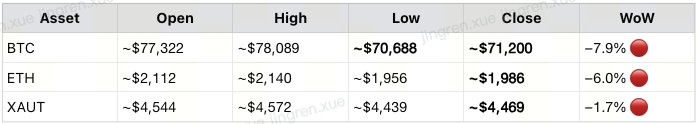
"No new positions" was equally correct — BTC fell from ~$77,000 to a weekly low of $72,500, then further dropped to $70,688 intraday on Jun 1 (a ~8.5% peak-to-trough decline from $77k). Currently recovering to ~$71,200. Holding through the uncertainty avoided this drawdown.
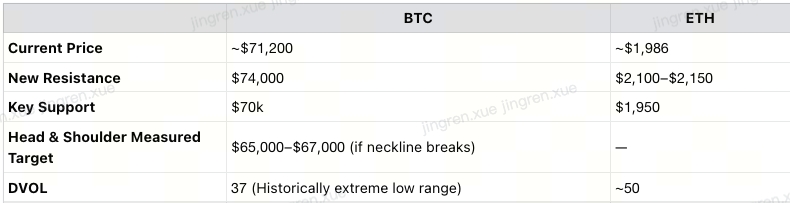
II. Weekly Market Recap
Price Action (Bybit Data | Updated Jun 2):
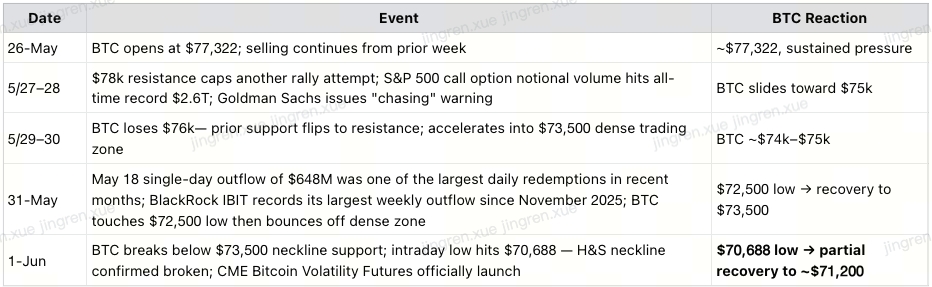
Event Timeline:
III. Technical Picture — Head & Shoulders Appears
The most important technical signal of the week.
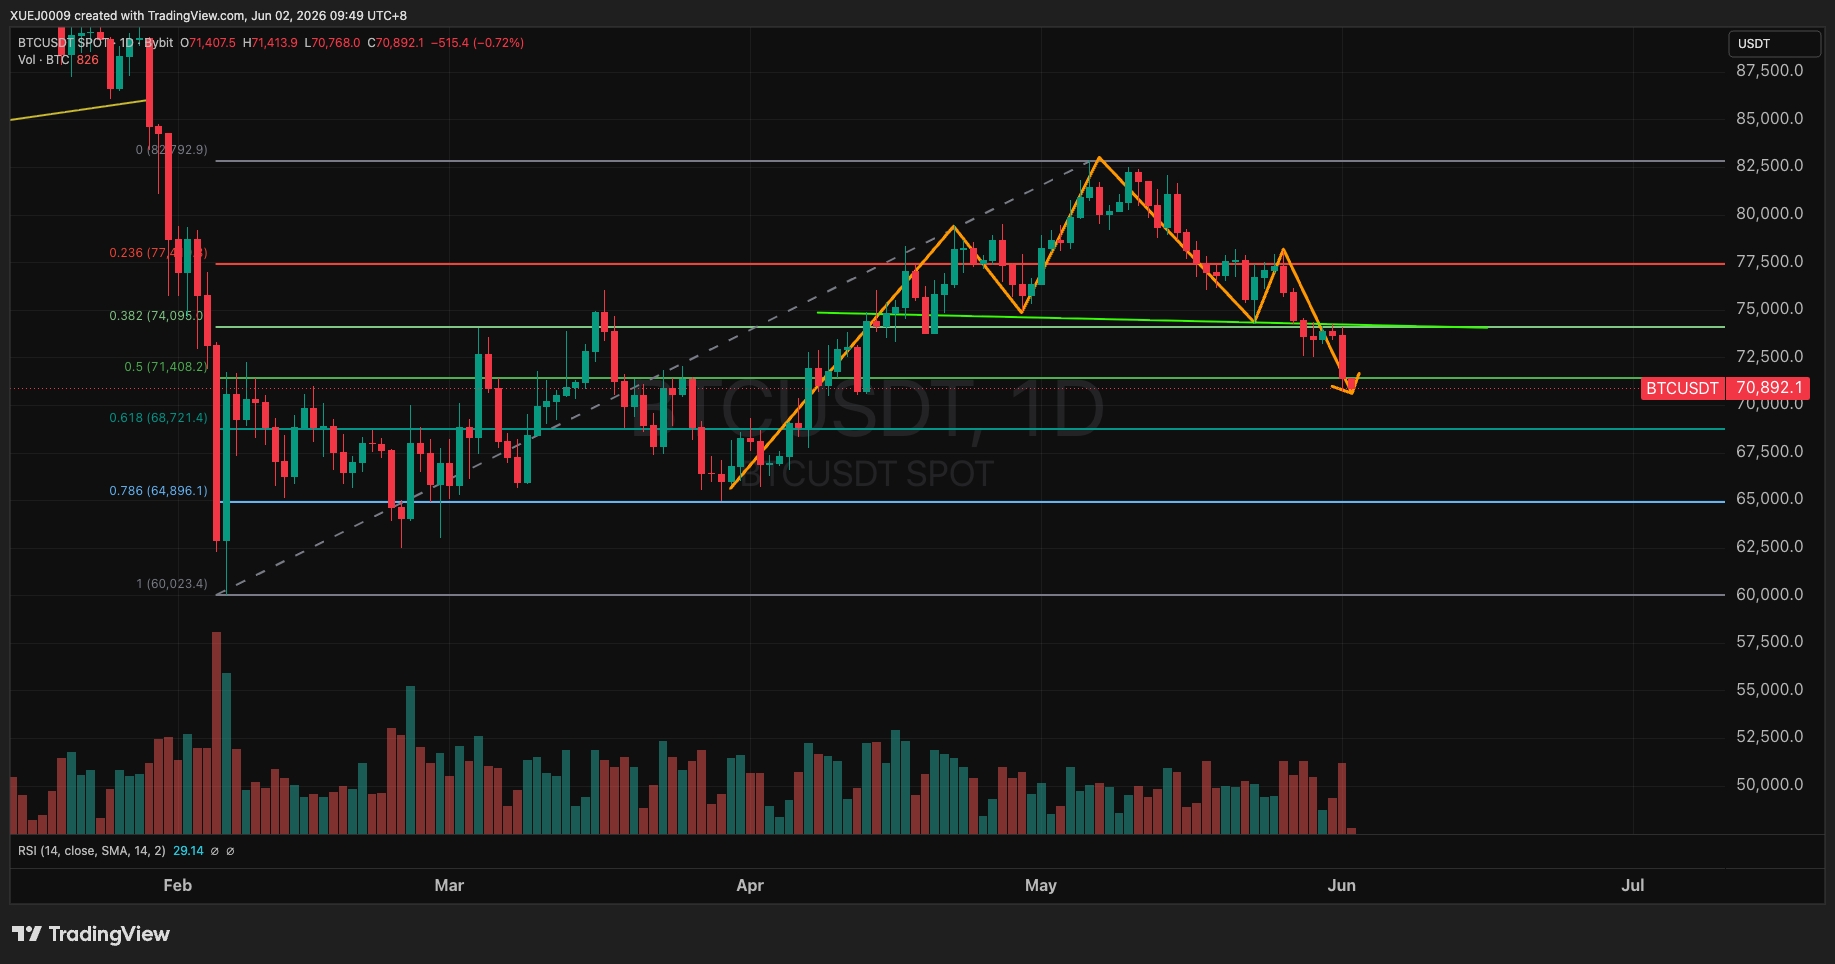
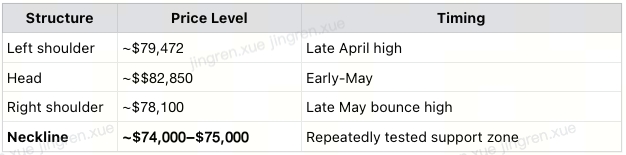
Head & Shoulders measured target:
Distance from head ($82,850) to neckline ($74.5k) = ~$8,350 Projected downside below neckline ≈ $65,000–$67,000 |
⚠️ Important caveat: A Head & Shoulders is a signal, not a guarantee. We highlight it to flag the risk, not to declare an inevitable outcome. There are many possible paths from here, and we are not aggressively bearish.
The key question: can $74,000 be reclaimed?
Reclaims and holds $74,000 → Neckline intact; potential rally toward $76,000
$73,500 confirmed breakdown → H&S neckline broken; measured target of $65,000–$67,000 activated
IV. Macro Background
4.1 The U.S. Equity Vacuum — Capital's Structural Repricing
The most notable macro observation this week is not how much BTC fell — it's why equities kept rising while BTC was falling.
U.S. stocks continued to strengthen, largely immune to war headlines. The logic:
AI-driven earnings are real and measurable: The hardware layer — optical modules, high-performance storage, and power infrastructure — has been the first to convert AI demand into quantifiable revenue and profit gains. This is showing up in actual earnings reports, not just narratives. For capital, this represents a return with certainty.
The vacuum effect is structural: Money is rotating into U.S. tech stocks where returns are visible, and systematically leaving crypto and precious metals. This is not short-term volatility — it is a structural repricing of where capital wants to be.
The unresolved tension: AI-driven inflation across the entire supply chain (data center construction, surging energy and semiconductor demand pushing up costs) is happening simultaneously with AI's dramatic improvement in total factor productivity. This contradiction puts the Fed in an extraordinarily difficult position: the inflationary pressure is supply-side capex driven, not demand overheating — and traditional monetary policy tools have fundamental limitations against that type of inflation.
4.2 ⚠️ U.S. Equity Options Alert: Bullish Sentiment at Historic Extremes, Long-on-Long Squeeze Risk Building
This is the most important market observation of the week, with direct implications for crypto's downside transmission risk.
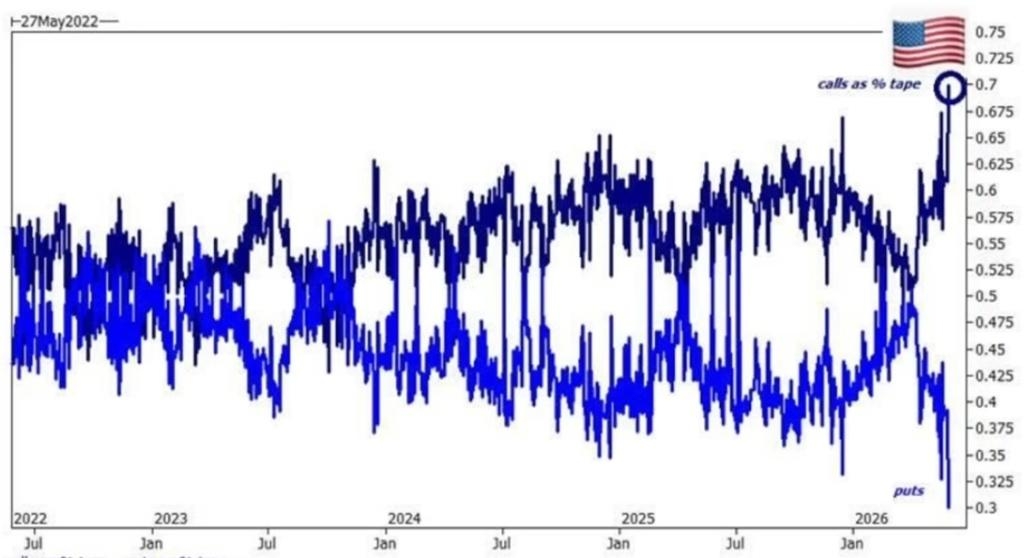
The chart above (source:Citadel) shows the S&P 500's ‘calls as % tape’ vs. ‘Puts as % tape’ since 2022. The current reading has reached a historically extreme level at the far right of the chart.
Core data points:
Structure is severely imbalanced — Call/Put near 7:3: As of May 28, total S&P 500 options volume reached 46.17 million contracts, or 219% of average daily volume. The volume put/call ratio was just 0.13 — meaning for roughly every 8 calls traded, only 1 put was traded. This degree of one-directional conviction is historically one of the hallmarks of near-term market tops.
Top-tier institutions issuing simultaneous warnings: Goldman Sachs' One-Delta desk head Rich Privorotsky said the U.S. market is now "fully in the territory of spot up, vol up, and chasing." Systematic trend-following funds (CTAs) have returned to essentially fully long. Wells Fargo chief equity strategist Ohsung Kwon flagged that its composite contrarian sentiment indicator triggered a sell signal for the first time since November 2021 — the indicator incorporates five dimensions: S&P 500 price level, put/call ratio, professional investors' futures positioning, ETF fund flows, and out-of-the-money put option costs.
The mechanics of a long-on-long squeeze:
When large call option positions are forcibly closed during a market reversal, market makers must sell the underlying asset to maintain delta-neutral hedging — creating a negative delta feedback loop that mechanically amplifies the sell-off. Wells Fargo notes that the market's "sweetener effect" has largely been exhausted, and the risk of "slowing growth combined with rising inflation" is increasing — described as the most unfavorable macro environment for equities.
The long-on-long squeeze has not started yet. But the conditions are fully in place: extreme positioning (Call/Put = 7:3), Goldman and Wells Fargo both flagging it simultaneously, CTAs at max long. Any unexpected negative catalyst — weaker-than-expected NFP, geopolitical shock, surprise hawkish Fed signal — could trigger the unwind.
The transmission path to crypto:
U.S. equity long-on-long squeeze → Forced deleveraging → BTC/ETH ETF outflows accelerate → Crypto loses its institutional support floor → Further price pressure |
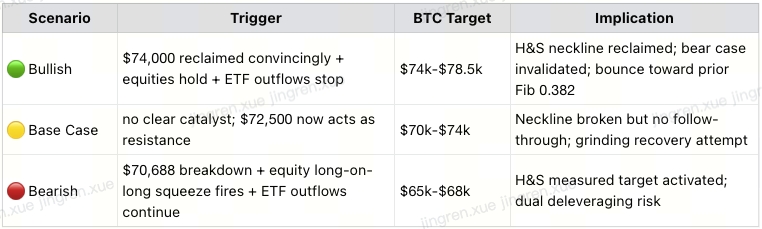
V. Outlook for Next Week (June 2–8)
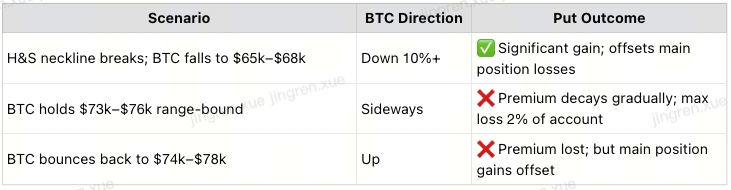
Three Scenarios:
VI. Strategy: Buy June BTC Put Options — Low-Cost Tail-Risk Hedge
Why buying Puts right now makes sense — in plain language: Vol is cheap (DVOL at historic lows) + downside risk is real (H&S pattern + equity warning + ETF outflows) = buying insurance right now offers the best value it has in months.
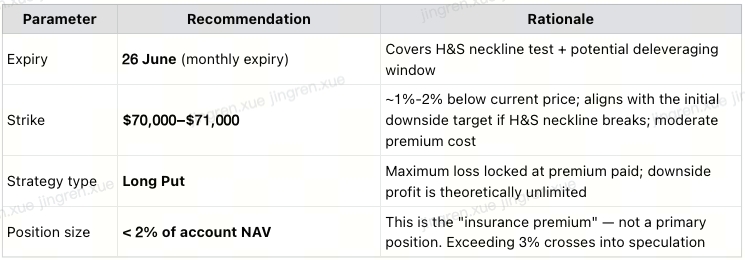
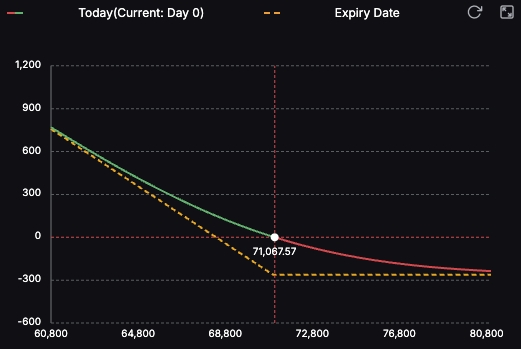
Recommended Structure: BTC June Monthly Put Options
P&L Scenarios at a Glance:
Key Risk Warnings:
Puts have time decay (Theta) — every day without a move erodes premium; don't hold too long without a thesis trigger
If BTC bounces to $76k+ short-term, the Put's value drops significantly — set a mental stop-loss (e.g., close if premium falls 50%)
This is tail-risk protection, not a directional bet. The 2%–3% size limit is not a suggestion — it is the discipline
Weekly Summary:
Last week's calls validated in full: $78,500 held as resistance, BTC dropped from $77,000 to $72,500 then further to $70,688 intraday on Jun 1 (weekly low). Currently recovering to ~$71,200.
Head & Shoulders pattern confirmed: Neckline at $73,500–$74,000. Measured target $65,000–$67,000 if neckline breaks. Currently holding — $74,000 recapture is the key signal to watch next week.
⚠️ Equity options alert: S&P 500 call notional volume breaks $2.6T record; Goldman warns of "semi-irrational chasing"; Wells Fargo's contrarian indicator fires for the first time since November 2021. A 7:3 Call/Put structure means any reversal will produce forced selling that flows directly through ETF outflows into crypto.
The vacuum effect: Optical modules, high-performance storage, and power infrastructure have already converted AI demand into real earnings — capital is rotating toward certainty. AI-driven supply-side inflation creates a structural bind for the Fed that traditional monetary tools cannot cleanly address.
Strategy: DVOL at historic lows + real downside risk = buy the Put, don't sell compressed vol. Allocate 1%–2% of account NAV to June BTC $70,000–$71,000 Puts. This is insurance. Size it like insurance.