


Bybit Options Weekly Review: Jun 30–Jul 6

TL;DR
June NFP printed 57,000 — about half the 113,000 consensus, the weakest reading since the 2020 COVID shock
BTC hit a 21-month low of $57,802 on July 1, then staged a 4-day recovery to a weekly high of $63,435; currently at ~$62,100. Over $200M in short positions were forcibly liquidated. ETH peaked at $1,808 (+12.3%), currently ~$1,740 (+8.1%), outpacing BTC's recovery
Bitcoin ETFs ended a 10-day consecutive outflow streak, with the first inflow signal appearing on July 5 — but H1 2026 recorded $5.4B in cumulative net outflows, the worst first half in ETF history
ETH DVOL at 53% vs BTC DVOL at 38% — ETH Put is preferred . ETH implied vol is in the mid-to-high range; selling near-dated Puts at the $1,550–$1,625 strike yields approximately 15%–30% APY.
Last week's Rolling Seller + quick-in-quick-out strategy validated: pre-NFP flat position was correct, fully avoiding the $57,802 low on July 1; the bullish divergence call delivered in full
I. Weekly Market Recap
Price Action (Bybit Platform Data, June 30 – July 6):

All three assets closed sharply higher. The week's price action was entirely driven by a single data point — June NFP — which within 48 hours reframed the entire crypto market narrative from "bear market under rate-hike pressure" to "dollar weakening on soft jobs, shorts forced to cover." July 4 Independence Day holiday liquidity amplified the move, with BTC reaching $63,435 and ETH touching $1,808 at the highs.
Event Timeline:
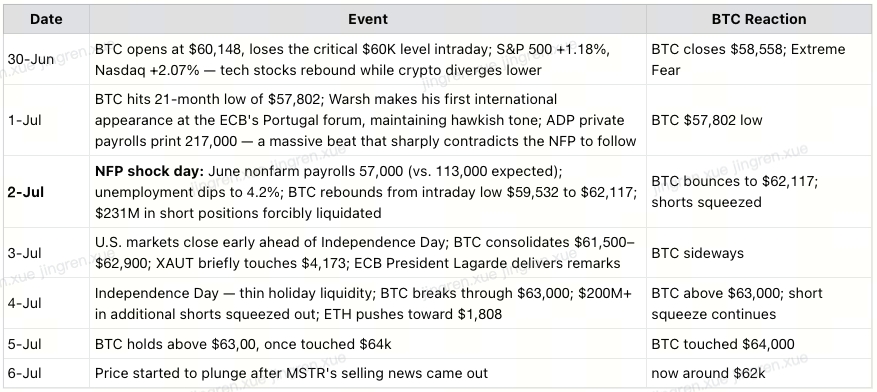
II. Technical Picture: Bullish Divergence Delivered in Full
BTC:
BTC recovered from $57,802 to $64,000 max. The technical structure is repairing:
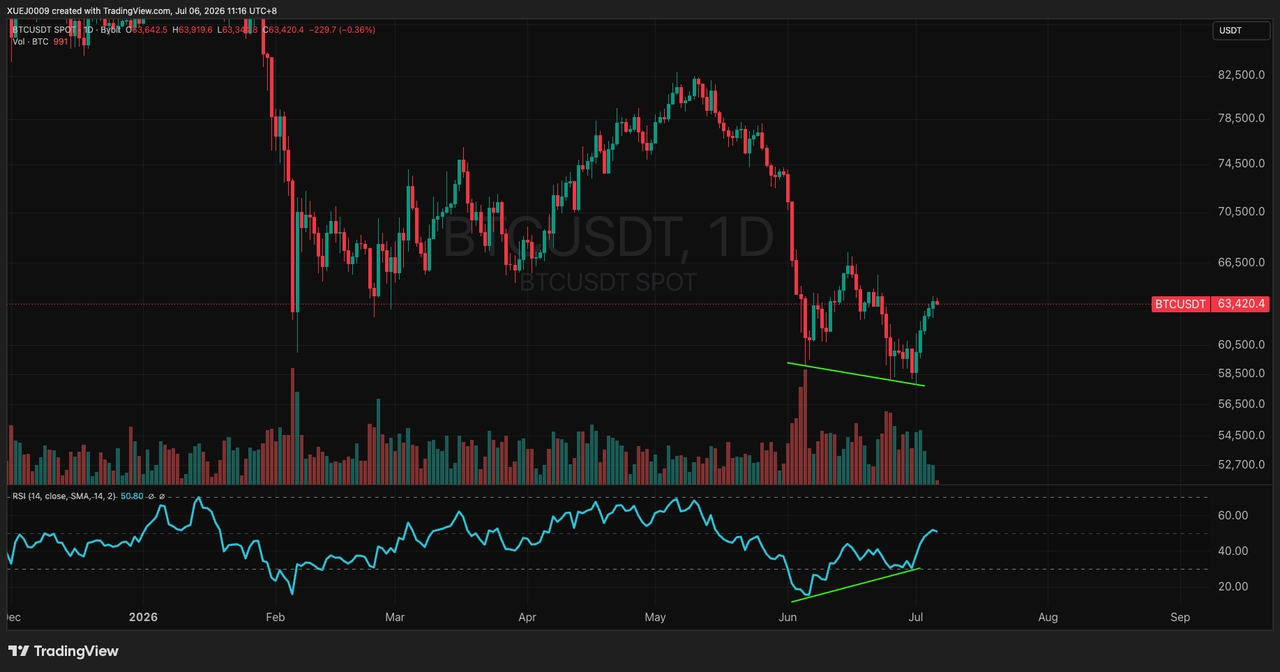
Support confirmed: $57,802 is the current 21-month low and the panic low triggered by NFP. Price formed a clear hammer candlestick at that level, followed by four consecutive green daily closes — a technically valid "phase bottom confirmation," not merely a one-day bounce
Resistance levels: $63,500 is the first resistance zone; $66,600–$67,600 is a more important structural resistance band. BTC is currently at ~$62,100, having pulled back slightly from the weekly high of $63,435 — holding above the $62,000 area is the key near-term observation
ETH:
ETH recovered from $1,550 to $1,808, a gain of +15.2%, materially outpacing BTC.
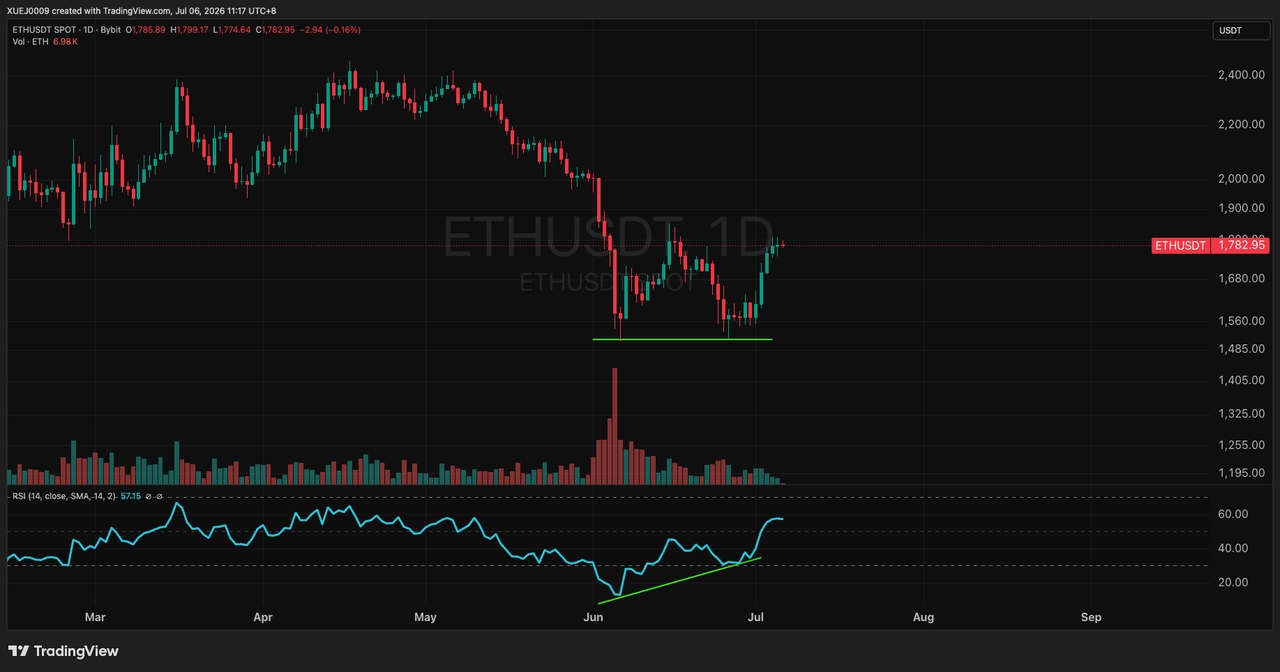
Two explanations:
1. Deeper oversold = sharper rebound: ETH had fallen further (approximately -20% in June), making it more oversold and mechanically more elastic on the way back up
2. PCR still elevated at 1.25: Heavy put positioning signals institutions are still hedging downside — this caps how far the move falls, but also means a sustained push above $1,800 requires fresh buying rather than just short covering
XAUT:
XAUT recovered from $3,942 to $4,173 (+4.6%) on the week, moving in sync with BTC and ETH; currently at ~$4,125. The driver: weak NFP → dollar index lower → gold/XAUT benefits. XAUT is now approximately 25% off its January high of $5,528, and also shows bullish RSI divergence on the daily chart. Whether the recovery sustains remains subject to the same macro constraints — Fed policy, dollar trajectory, and bond market dynamics.
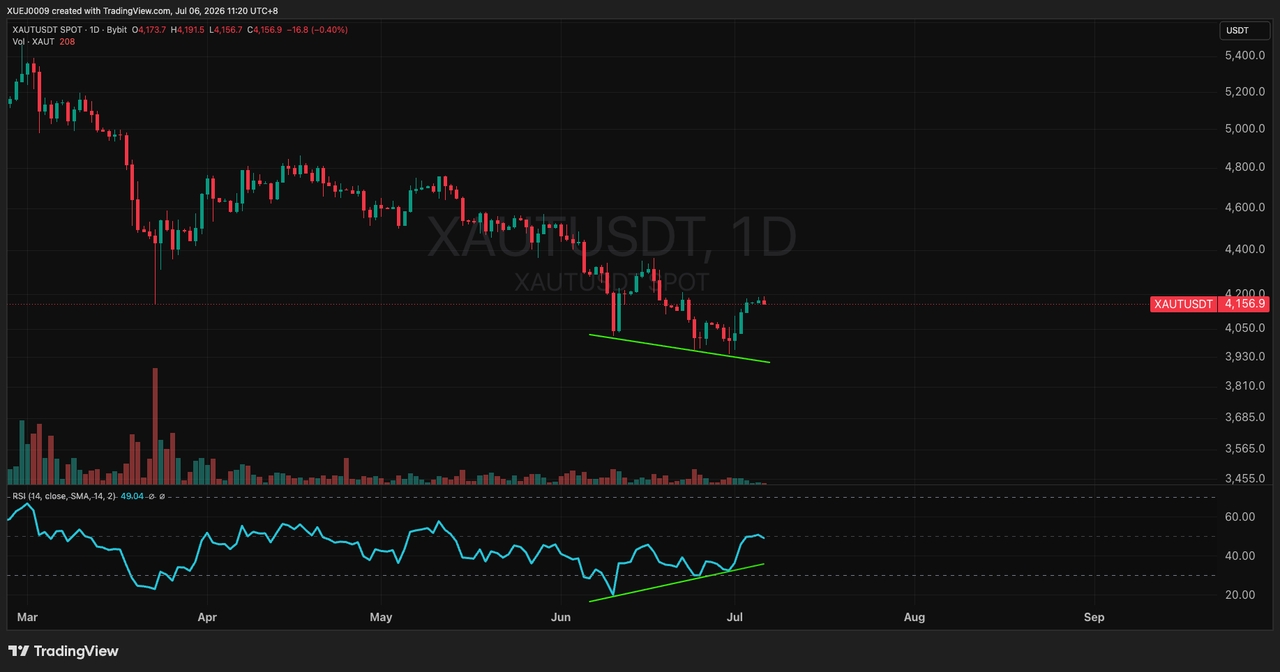
Technical conclusion: Bullish divergence has delivered. The $57,802 low is likely the effective low for this leg with reasonably high probability. But BTC has not yet broken above the $63,500 first resistance level; whether the bounce becomes a sustained trend depends on next week's CPI/PPI data. The technical signal provides a probabilistic edge of "there is demand for a bounce" — macro data will determine how far that bounce can extend.
III. Last Week's Strategy Review: Rolling Seller + Quick-In-Quick-Out, Discipline Validated
Last week's core strategy: rolling short-dated Puts (within-7-day expiry), exiting positions at 50–70% Theta decay rather than holding to expiry, and maintaining zero open exposure into the NFP window.

Results:
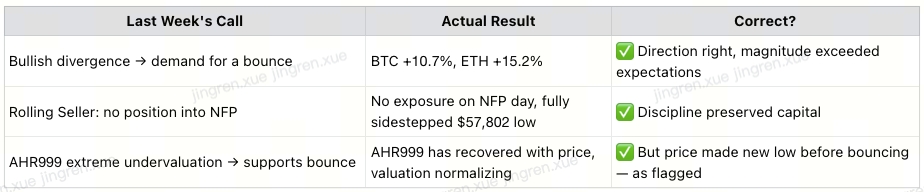
Takeaway: Going flat ahead of NFP was the single most important position decision of the week — sacrificing the last slice of premium income in exchange for zero exposure during BTC's maximum drawdown ($60,148 → $57,802, approximately -4%). The bullish divergence is a high-quality "zone bottom" signal, not a "precise bottom" signal — BTC still made a new low at $57,802 first, exactly consistent with last week's caveat.
IV. The NFP Report: Weaker Than It Looks
4.1 The Data Is Worse Than the Headlines Suggest
The unemployment rate fell from 4.3% to 4.2% — but this is a statistical illusion. The participation rate dropped from 61.8% to 61.5%, meaning more people left the workforce entirely rather than finding jobs. Leisure and hospitality shed 61,000 positions, reversing May's gains; prior months were revised down a combined 74,000. The labor market has real cracks — it just hasn't broken yet.
4.2 October Hike Odds End the Week at 62% — More Hawkish Than Before NFP
The most important macro observation of the week is not the NFP print itself, but the fact that the market digested the weakest jobs reading since 2020 and still ended the week pricing an October hike.
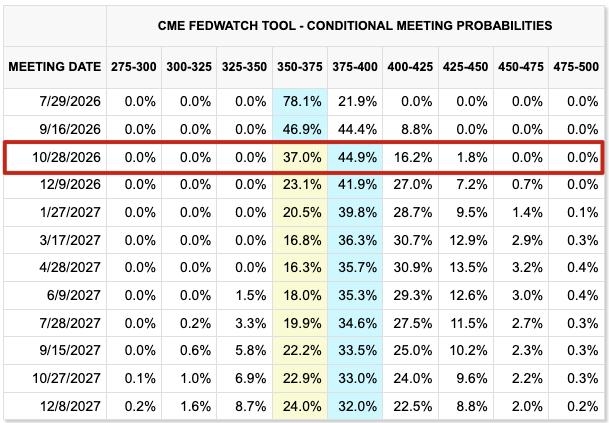
Warsh changed the reaction function the day before NFP. At the ECB Portugal forum on July 1, he made the Fed's new logic explicit — inflation is the only variable that matters; one weak jobs print doesn't constitute a pivot; and the October window stays open until inflation demonstrably cools. He effectively inoculated the market against the miss before it happened, despite admitting that “inflation risks have come down”.
Under Powell, weak employment automatically imported dovish expectations. Under Warsh, it doesn't - at least not yet. The pricing anchor has fully shifted to inflation data — which means CPI on July 14 is the first number that can genuinely move October hike odds in either direction. That is next week's story.
V. Strategy sells 3,588 BTC to fund preferred dividends
Saylor confirmed via X on July 6: Strategy sold 3,588 BTC for $216 million to fund distributions on its Digital Credit preferred securities, under the Board-approved BTC Monetization Program. Holdings now stand at 843,775 BTC with $2.55 billion in USD reserves. BTC briefly dropped below $62,000 on the news before recovering.
Unlike the unexplained 32-BTC sale in May, this sale is disclosed, structured, and recurring — tied directly to preferred dividend obligations. The mechanism is transparent; yet the implication is not: Strategy's stack is no longer purely accumulative, and the market now has a new variable to price every reporting cycle — how large is the next sale, and when.
VI. DVOL Analysis and Strategy Framework

Strategy Evolution Path:

VII. Outlook for Next Week (July 7–13)
This week is a data vacuum — no CPI or PPI. The real event is next week: CPI (July 14) and PPI (July 15) will directly reset Fed pricing and determine whether the current recovery holds. This week is the calm before that storm — ETH Put Seller can run relatively undisturbed through July 13, at which point position sizing should be reduced to 50%–60% of normal ahead of the CPI print.
Key levels to watch this week:
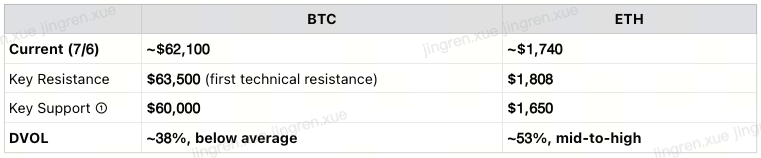
Three Scenarios for Next Week:

VIII. Strategy: ETH Put Seller — Relatively Calm Window Before CPI
Strategy rotation: No Trade (last week, pre-NFP flat) → ETH Put Seller (this week, ETH DVOL 53%)
ETH DVOL at 53% gives the seller an edge: selling near-dated Puts at the $1,550–$1,625 strike yields approximately 15%–30% APY — materially better than BTC at the same delta
BTC DVOL at 38% — the yield isn't worth the risk: premium collected relative to potential downside exposure doesn't justify a BTC Put Seller position this week
Long Strangle/Straddle cost too high: with both assets mid-range on vol (not at historical lows below 35%), buying both legs of a strangle is expensive relative to the expected payoff
This week is a data vacuum: no CPI or PPI until July 14–15. The ETH Put Seller can operate in a relatively benign environment
Reference Structure (illustrative — actual strikes and premiums depend on live IV at entry):
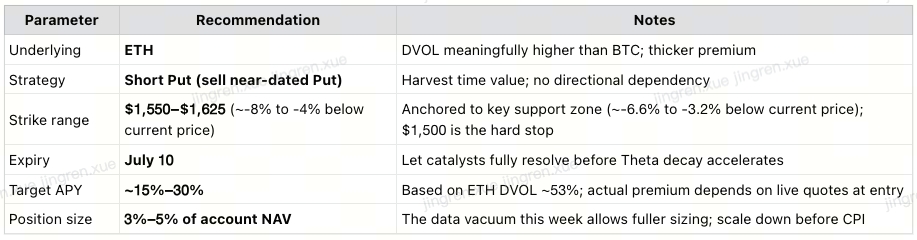
⚠️ This strategy is for informational purposes only and does not constitute financial advice. Seller-side option strategies carry tail risk. Actual strikes, premiums, and APY depend on live IV at time of entry. |
Weekly Summary:
Bullish divergence delivered. BTC recovered from the 21-month low of $57,802 to a weekly high of $63,435 (+5.5%); currently at ~$62,100 (+3.2% on the week). ETH peaked at $1,808 (+12.3%), currently ~$1,740 (+8.1%). XAUT peaked at $4,173 (+4.6%), currently ~$4,125 (+4.6%). NFP (57K vs. 113K expected) triggered dollar weakness and a short squeeze. Price made a new low before bouncing, as flagged: divergence is a zone signal, not a precise bottom signal.
October hike odds ended at ~62%. Warsh's inflation-first framework is fully priced in; soft labor data alone no longer moves the rate needle. CPI on July 14 is the decisive test — but that's next week's story.
This week is a data vacuum — no CPI or PPI. ETH Put Seller can run at full-sized through July 13, then scale down to 50–60% ahead of the CPI print on July 14.
Strategy: ETH Put Seller (strike $1,550–$1,625, target APY ~15%–30%). ETH DVOL 53% is worth harvesting; BTC DVOL 38% is too thin; Long Strangle costs too much at current vol levels. Enjoy the quiet week.