
Bybit Options Weekly Review: Jun 23–Jun 29

TL;DR
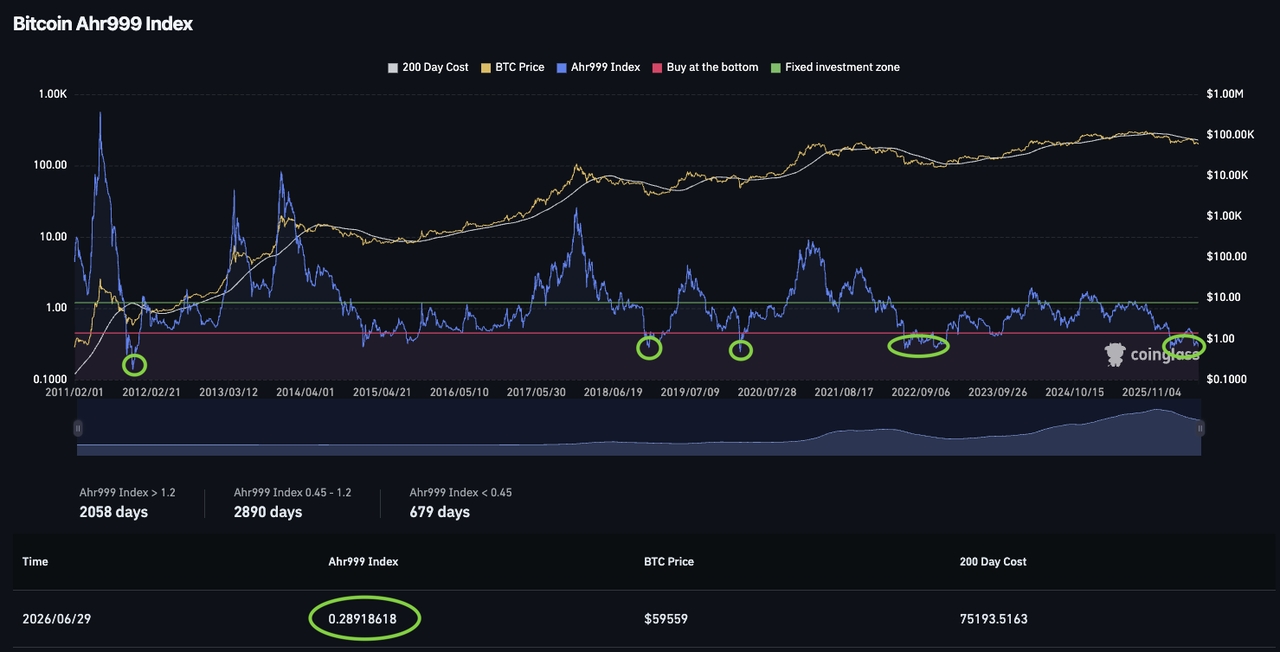
The AHR999 bottom-fishing indicator fell to 0.287, an extreme undervaluation zone historically seen only in early 2011, the 2018 bear market bottom, the 2020 COVID crash, and the 2022 FTX collapse
May PCE rose 4.1% YoY, core PCE 3.4% — the hottest reading since fall 2023; yet the data triggered a "sell-the-bad-news" reversal, with gold staging a rally of over $65
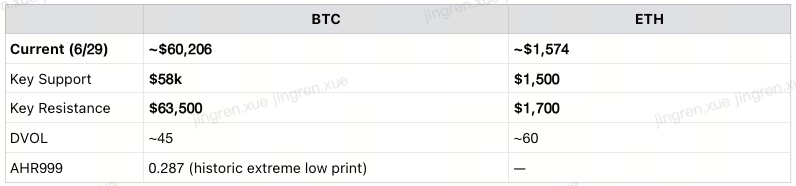
BTC and ETH both show bullish RSI divergence on the daily — BTC printing higher lows in the range, ETH recovering near $1,574
This week's technical analysis supports selling short-dated Puts near support to harvest premium, but with a clear distinction between "probabilistic edge" and "guaranteed protection"
Coming up: nonfarm payrolls headline the calendar alongside Warsh's international debut — JOLTS, ADP, and NFP land within three days, with Warsh's central banking forum speech potentially compounding the data
DVOL: ETH meaningfully higher than BTC; rolling seller strategy continues, discipline unchanged — be ready to exit at any time
I. Weekly Market Recap
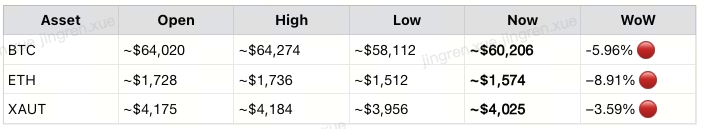
Price Action (Bybit Platform Data, updated June 29):
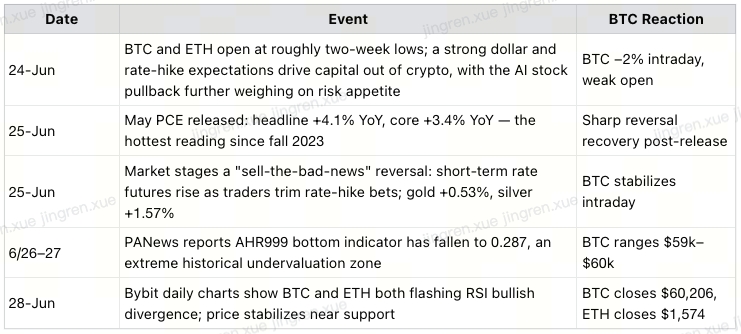
Event Timeline:
II. Technical Deep Dive: Bullish Divergence and Its Options Application
This is the week's most important chart story — two charts, one conclusion.
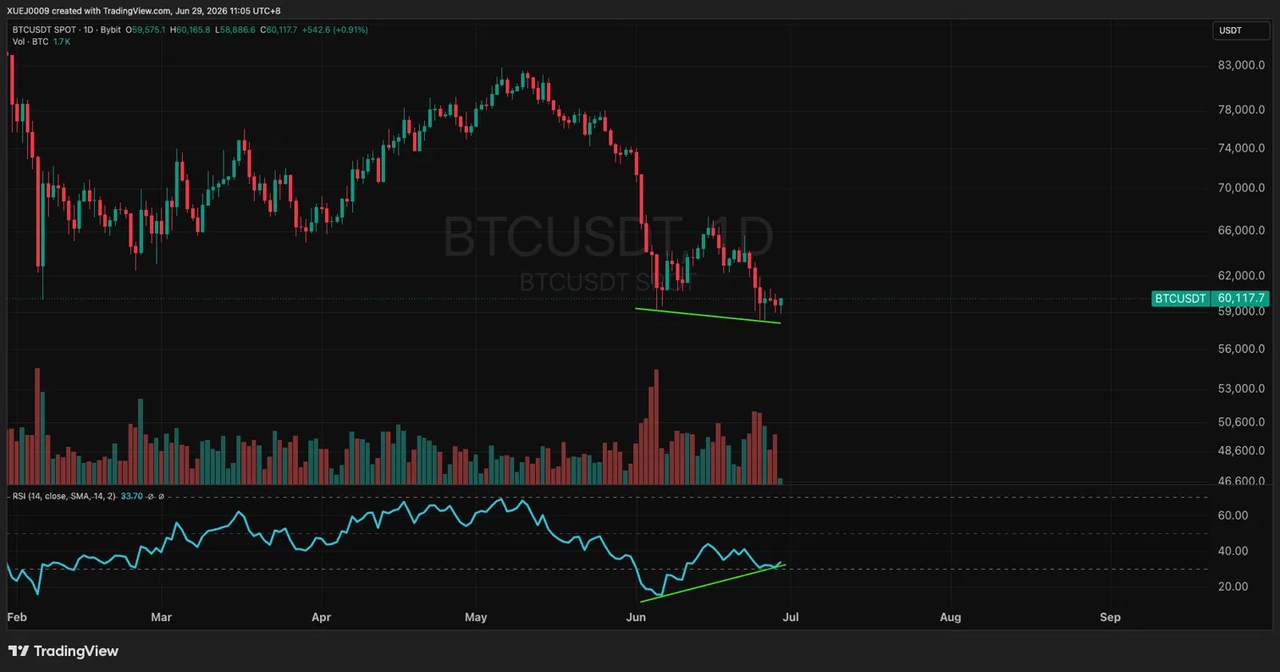
BTC's RSI(14) reading 33.79. The chart reveals two key structures:
Price-level divergence: The May low zone and the June low zone form a horizontal support band that price has failed to break below further
RSI divergence: RSI has recovered from ~20 in early June to 33.79, tracing a clear series of higher lows (green trendline), even as price itself oscillates near similar levels — a textbook "momentum recovering faster than price" divergence structure
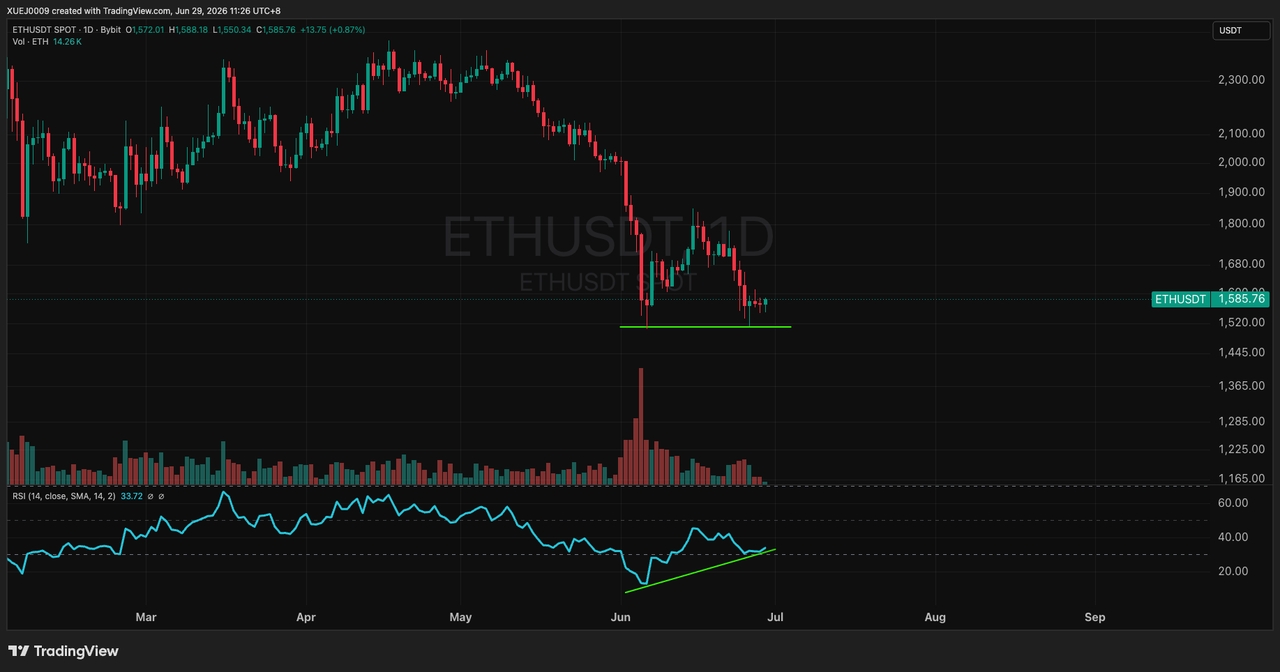
ETH's RSI(14) reading 31.72. The structure closely mirrors BTC:
Price is holding above the $1,500 psychological level with no confirmed breakdown
RSI has recovered from a ~20 low in early June to 31.72, similarly showing signs of momentum exhaustion fading
Volume spiked sharply in early June before tapering off — the most violent phase of selling pressure may already be behind us
What these two signals together imply:
Bullish divergence is a probabilistic momentum signal, not a guaranteed reversal signal. It tells us "downside pressure is weakening" — it does not tell us "when" a rally happens or "how much" it might move. Historically, divergences resolve in three ways:
a genuine bounce (the market's base case)
extended consolidation where the divergence gets "resolved by time rather than price," or
the divergence simply fails and price makes new lows — particularly common during systemic macro-driven declines, where technical signals lose reliability.
Options application — selling Puts near support:
If the judgment is that near-term support (BTC ~$59,979–$60,000, ETH ~$1,500) has a low probability of being decisively broken, selling Puts near that level is an efficient way to convert a probability judgment into yield — more capital-efficient than holding spot outright, and safer than a naked short Call.
But two critical limits must be made explicit:
1. Bullish divergence provides no extra protection against a fresh fundamental shock. The market is still simultaneously navigating Warsh's communication paradigm shift and the fragility of the Lebanon situation — if either deteriorates suddenly, this RSI divergence chart gets run straight through; a "clean-looking" divergence structure earns no exemption.
2. Selling a Put collects premium, but underwrites the full downside risk if support breaks. Divergence offers a "probably won't break" edge — it offers zero protection on "how far it falls if it does."
Conclusion: selling Puts near support is a reasonable approach, but it is a bet that the divergence holds with high probability. Position sizing should stay conservative, with explicit stop conditions defined for a support breakdown — divergence is not a license to size up with confidence.
III. The AHR999 Index: A Historically Extreme Bottom-Fishing Reading
Based on Bitcoin's current price and a 200-day DCA cost basis (C200) of $75,821, the AHR999 bottom indicator reads approximately 0.287 — an extreme undervaluation zone. The year-to-date low was 0.27, set on February 6, 2026.
What this number has historically meant:
Statistically, an AHR999 reading below 0.3 is an extremely rare signal, typically appearing only during systemic panic or major bear-market bottoms. Historically, the indicator broke below 0.3 during the early 2011 market, the 2018 bear-market bottom (a low of roughly 0.24), the 2020 COVID flash crash, and the 2022 FTX collapse and associated ETH liquidation cascade.
The AHR999 formula is: (current price ÷ 200-day DCA cost) × (current price ÷ exponential growth valuation estimate). A reading below 0.3 means two things are simultaneously true:
Current price is trading at a deep discount relative to long-term DCA cost basis
Current price is trading at a deep discount relative to the historical exponential growth trendline
This cross-validates the RSI divergence covered in Section II: one is a momentum indicator, the other a valuation indicator, and both point in the same direction — "current levels are historically an extreme undervaluation zone." But neither tells us "when" a rebound happens or "whether price makes new lows first." In the 2018 and 2022 cases, the market took weeks to months of further probing lower after AHR999 first broke below 0.3 before genuinely confirming the bottom.
IV. Last Week's PCE Data, Revisited:
May PCE Breakdown
The Data: PCE rose 4.1% YoY (prior: 3.8%); core PCE hit 3.4% — the hottest reading since fall 2023. Oil prices driven by the US-Iran conflict were the headline driver, but the parallel rise in core PCE signals the pressure goes beyond energy.
Why did hot data trigger a rally? Markets had already fully priced it in, with short positioning turning crowded. Once the data landed as expected, the logic flipped: uncertainty resolved → shorts covered en masse, dip-buyers rushed in. Nasdaq futures +2.37%, S&P +0.81%, gold +0.53%. A textbook "sell-the-news" short-term pulse.
Don't mistake this for a trend:
If core inflation shows no signs of cooling over the next two months, a September hike becomes a live risk
Implication for crypto: This rally resolves "near-term uncertainty" — it does not resolve the "medium-to-long-term high-rate constraint." A short pulse, not a trend reversal.
V. This Week's Calendar:
The U.S. Bureau of Labor Statistics will release the June nonfarm payrolls report on July 2; the market expects 113,000 new jobs and a 4.3% unemployment rate. Analysts note that if the data surprises to the upside, it could further cement market expectations for a Fed rate hike.
Three data points warming up ahead of NFP:
Ahead of the payrolls release, the market gets three additional reads on labor market momentum:
Tuesday (June 30) brings May JOLTS job openings and labor turnover data
Wednesday (July 1) brings June ADP private payrolls
Thursday (July 2): weekly initial jobless claims land the same day as NFP itself.
These four data points arrive in rapid succession over three days, progressively sketching out the full picture of June's labor market.
Equally important: Warsh's international debut
The ECB's central banking forum will be held in Portugal from June 29 to July 1, bringing together global central bank officials to discuss accelerating growth, AI, and financial stability.
This will be Warsh's first international public appearance since taking office. |
Markets will focus closely on Warsh's remarks the evening of July 1. If he maintains a hawkish tone at the forum, it would further reinforce market expectations for a Fed rate hike — and this speech happens to land squarely between JOLTS (6/30), ADP (7/1), and NFP (7/2), meaning the market will be digesting "what Warsh said" followed immediately by "what the NFP data said" simultaneously over the following 24 hours; either thread turning hawkish could reinforce the other.
Why this round of employment data is especially sensitive:
In the current environment of renewed rate-hike fears, the logic has flipped — strong employment data may actually be worse for risk assets than weak data.
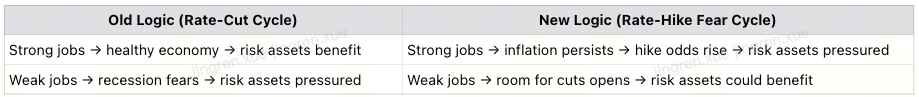
The core backdrop behind the FOMC's collective hawkish shift is precisely this: the labor market remains stubbornly strong and inflation concerns are reigniting. New Fed Chair Warsh has downplayed the "rate-cut narrative," prioritizing inflation-fighting and sharply raising sensitivity to any single inflation print.
This means the market will be pricing the next three days through a distorted lens where "bad news might actually be good news." A hot JOLTS print, a strong ADP number, payroll growth above the 113,000 consensus, or unemployment falling below 4.3% — any one of these, combined with a hawkish tone from Warsh at the forum, could create a compounding effect between the data and policy fronts, adding further pressure to zero-yield assets like BTC and ETH.
VI. Outlook for This Week (June 29 – July 5)
JOLTS (6/30) → ADP (7/1) → Warsh's Forum Speech (evening of 7/1) → NFP (7/2) — four events compressed into three days.
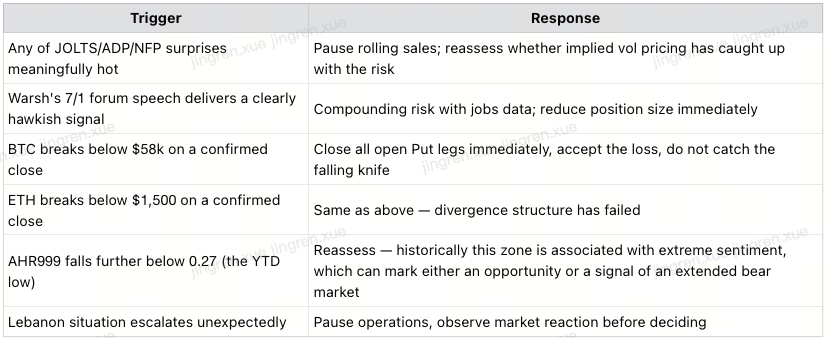
Three Scenarios:
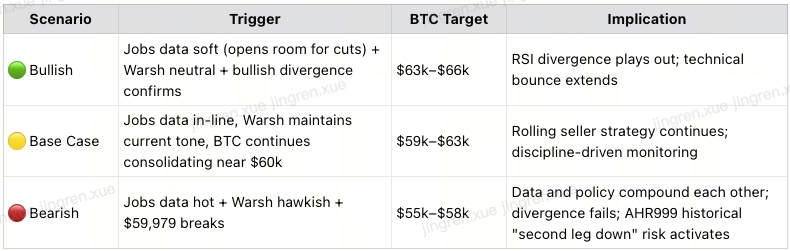
VII. Strategy: Rolling Seller Continues, but Heightened Vigilance
Core strategy unchanged: sell short-dated Puts near support to harvest premium. Discipline is the foundation, not confidence.
⚠️ This strategy is for informational purposes only and does not constitute financial advice. Seller-side option strategies carry tail risk — bullish divergence is a probabilistic signal, not guaranteed protection. Actual strikes, premiums, and risk exposure depend on live quotes at time of entry. |
Weekly Summary:
BTC and ETH both flash bullish RSI divergence on the daily, with price holding above support (BTC ~$58k, ETH ~$1,500). Divergence is a probabilistic signal, not a guaranteed reversal — selling Puts near support to harvest premium makes sense, but position sizing should stay conservative with readiness to exit at any time.
AHR999 has fallen to 0.287, a historically extreme undervaluation zone — a level seen only during four systemic panics (2011, 2018, 2020, 2022), cross-validating the RSI divergence signal.
May core PCE hit 3.4% YoY, the hottest reading in three years, yet the market staged a "sell-the-news" reversal — because hike expectations were already fully priced in, the release itself triggered a short-term relief rally, lifting gold and silver in tandem. This is a short-term pulse, not a trend reversal; the medium-to-long-term high-rate constraint remains intact.
This week, NFP headlines while Warsh makes his international debut. JOLTS (6/30), ADP (7/1), Warsh's forum speech (evening of 7/1), and NFP (7/2) all land within three days — in the current rate-hike fear cycle, the logic has flipped: strong employment data could be worse for risk assets than weak data, and a hawkish Warsh would compound the effect.
Strategy: rolling seller strategy continues, but vigilance is elevated. The technicals offer a probabilistic edge, but the fundamentals (jobs data + Warsh's remarks + the Lebanon situation) could break through this structure at any moment — discipline always comes before confidence.