


Bybit Options Weekly Review: Jul 7–Jul 13

TL;DR
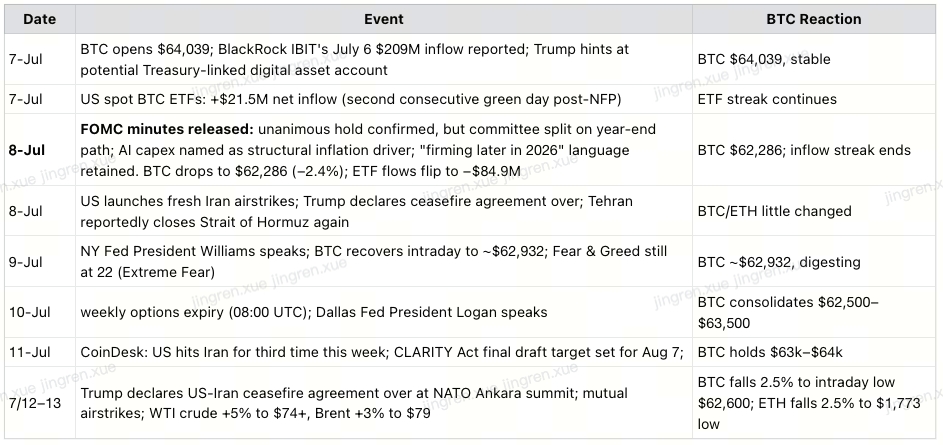
FOMC minutes (July 8) confirmed a unanimous hold at 3.50%–3.75%, but revealed a split committee on the year-end rate path — AI capex named as a structural inflation driver; "firming later in 2026" language explicitly preserved
ETF inflow streak ended in just two days — July 6's $266M inflow was followed by a −$84.9M outflow on the day the FOMC minutes hit; the demand signal is notable but not yet durable
BTC opened the week at $64,039, pulled back to $62,286 on the minutes, recovered to close near ~$64,100 — effectively flat WoW (+0.7%)
Trump declared the US-Iran ceasefire agreement over at the NATO summit in Ankara; both sides exchanged airstrikes; WTI crude surged 5% to $74+; BTC fell to an intraday low of $62,600
Four structural headwinds operating simultaneously: hawkish Fed, geopolitical re-escalation (ceasefire declared over), STRC still below par, Clarity Act odds below 50% — explaining why BTC hasn't broken $65,000 despite the weakest NFP since 2020
This week: CPI (Jul 14) + Warsh Congressional testimony (Jul 14–15) + PPI (Jul 15) — policy signal and inflation data on the same day; the compounding event risks are the single largest market factor to watch this week
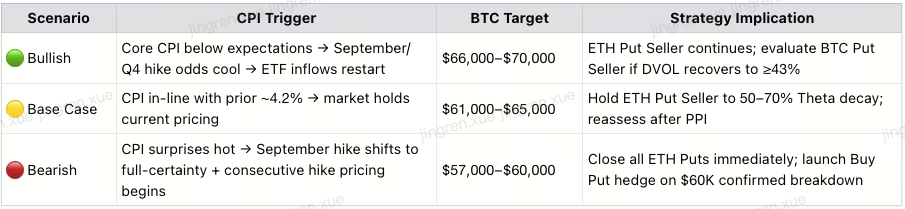
DVOL: ETH ~50%+, BTC ~38%; ETH Put Seller remains active — reduce to 50–60% of normal sizing before CPI opens
I. Weekly Market Recap
Price Action (Bybit Platform Data, July 7–13):

All three assets closed lower. XAUT settled at $4,050 (−2.7%) — one of the more telling signals of the week. The ceasefire collapse should have been a tailwind for gold, yet XAUT ended down. The explanation: rising oil prices are reinforcing rate hike expectations, and in a high real-rate environment, gold's zero-yield profile faces the same headwind as Bitcoin. The compression of all zero-yield assets — crypto and gold alike — into the same "higher-for-longer" repricing is the clearest signal yet that this is a macro-driven selldown, not a crypto-specific one.
Event Timeline:
II. Two Core Events This Week
2.1 FOMC Minutes: Split Committee, September Hike Door Stays Open
Three things mattered:
① Unanimous hold — but the unanimity is deceptive
All participants voted to hold at 3.50%–3.75%. But the minutes reveal genuine disagreement on what comes next — some participants viewed the current rate level as sufficient, while others wanted to explicitly preserve the option for further tightening. The vote was unanimous; the outlook was not.
② AI capex named as a structural inflation driver — the most important language in the document
The minutes cited three specific inflation risk factors: tariffs, energy prices, and AI-driven demand. Defining AI capex — data center construction, compute demand — as a structural driver is significant. Presistent AI-driven inflation may not dissipate as the economy cools; it requires rates to stay elevated longer. Traditional monetary tightening has fundamental limitations against supply-side capex-driven inflation. This is precisely the Warsh framework we've been tracking.
③ "Firming later in 2026" language survived
Despite the June NFP miss (57K jobs vs. 113k est.) having been published after the minutes were written, the June minutes still contain explicit language leaving the door open to additional rate increases later in the year. The market had hoped for a softer read. Instead, the minutes confirmed the hawkish stance already telegraphed by the dot plot. September hike odds held near ~80% rather than cooling.
Conclusion: The FOMC minutes confirmed what Warsh told us at the ECB forum - inflation is the only variable that drives rate decisions.
2.2 Ceasefire Formally Collapsed — Geopolitical Risk Upgrades from "Friction" to "Structural Reset"
Although markets remain relatively unperturbed by the latest geopolitical flare-up, the latest developments in the Middle East conflict feels qualitatively different from every prior Iran headline.
Trump declared at the NATO Ankara summit: "The memorandum of understanding and the ceasefire with Iran is over, as far as I'm concerned." Both sides exchanged airstrikes. WTI crude surged 5% to over $74 a barrel; Brent crude rose 3% to approach $79.
For weeks, the market had grown partially immune to Iran headlines — every escalation/de-escalation cycle had followed a similar pattern. That immunity ends here. This is not friction within a ceasefire framework — this is the framework itself collapsing. The impact on oil prices could be more entrenched, and the transmission to CPI may be deeper.
The transmission channel is now actively open:
Ceasefire collapse → sustained oil price rise → energy inflation → CPI surprises hot → rate hike expectations reinforce → BTC/ETH under pressure |
Notably, BTC's 2.5% intraday decline was roughly in line with gold's −1.6% move — the smallest crypto reaction to a major Iran shock since the conflict began, suggesting partial geopolitical desensitization. But desensitization to the shock does not remove the inflation transmission risk from elevated oil prices feeding into future CPI prints.
III. Technical Analysis: Both Key Thresholds Failed
BTC: $64,000 resistance confirmed
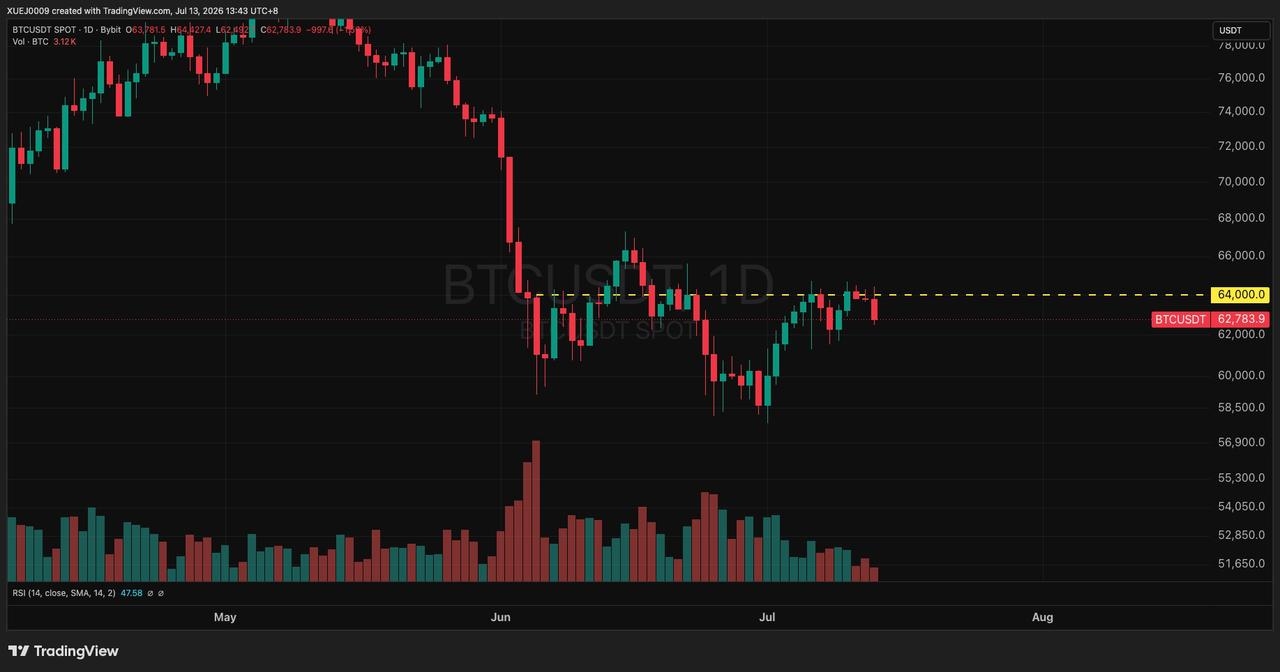
This week BTC made multiple attempts to hold above $64,000 (yellow dashed line), but every touch was met with selling — no confirmed daily close above the level. The weekend's ceasefire collapse pushed BTC to an intraday low of $62,600. RSI(14) at 47.58 — neutral, with no oversold support and no overbought pressure. A textbook "waiting for catalyst" consolidation structure.
ETH: $1,800–$1,850 resistance band validated
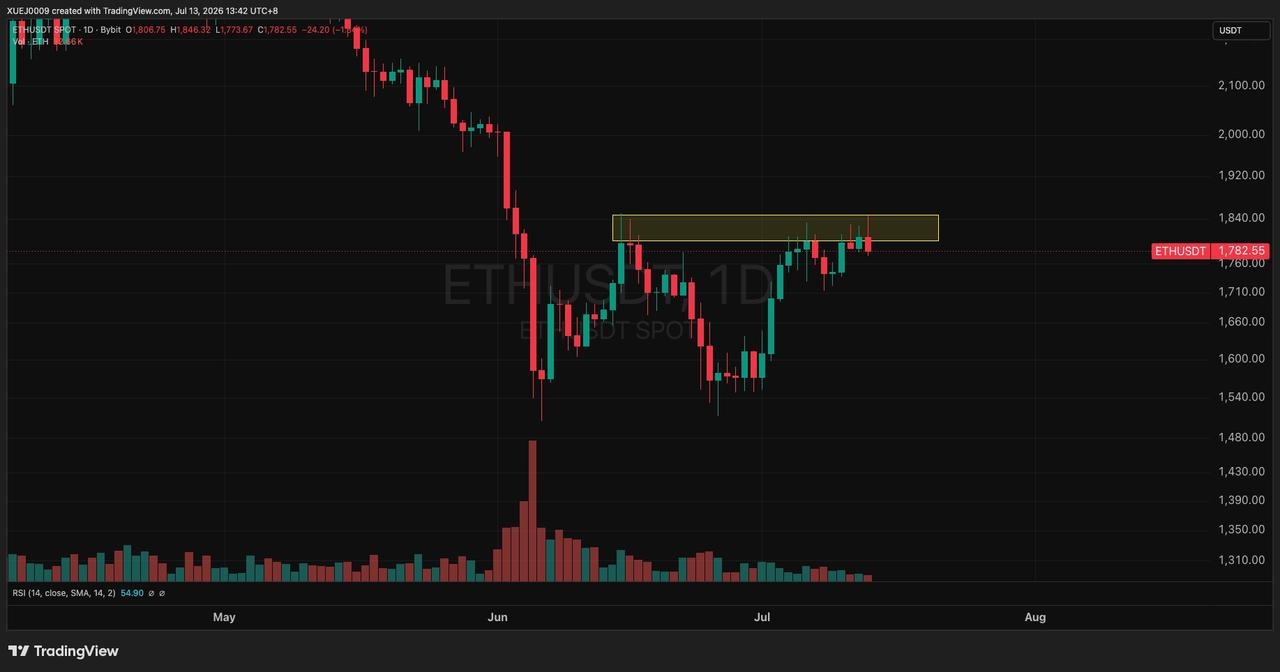
The yellow rectangle on the chart ($1,800–$1,850 zone) marks the resistance band ETH has been testing since early July. ETH briefly touched $1,846 in Monday's early session before reversing sharply on the ceasefire collapse news, still stronger than BTC, consistent with ETH's recent relative outperformance — but the $1,800–$1,850 resistance band has been explicitly validated as a ceiling.
Summary of both thresholds:

Neither threshold broken — the recovery remains a bear market relief rally in structure.
The incoming CPI figures may serve as the nearest catalyst that could change this judgment, barring surprisingly strong policy signals from Chair Warsh who had already eschewed "forward guidance".
IV. Four Structural Headwinds: Why BTC Hasn't Broken $65,000 Despite the Weakest NFP Since 2020
The bounce happened. The structural ceiling hasn't lifted.

These four factors collectively explain why BTC, despite absorbing a 57K NFP print, has been unable to break through $65,000 on a sustained basis. Positive data can trigger short-term relief; structural headwinds cap the runway for a genuine trend reversal.
CPI is one of the most important near-term tests: a soft print partially relieves all four headwinds; a hot print compounds all four simultaneously.
V. ETF Flows: Two-Day Streak Ends, Structural Demand Unconfirmed
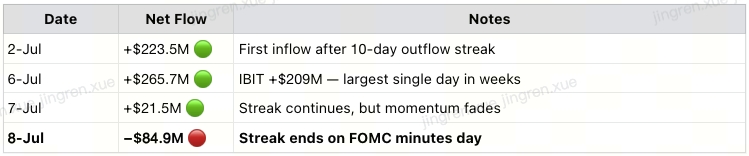
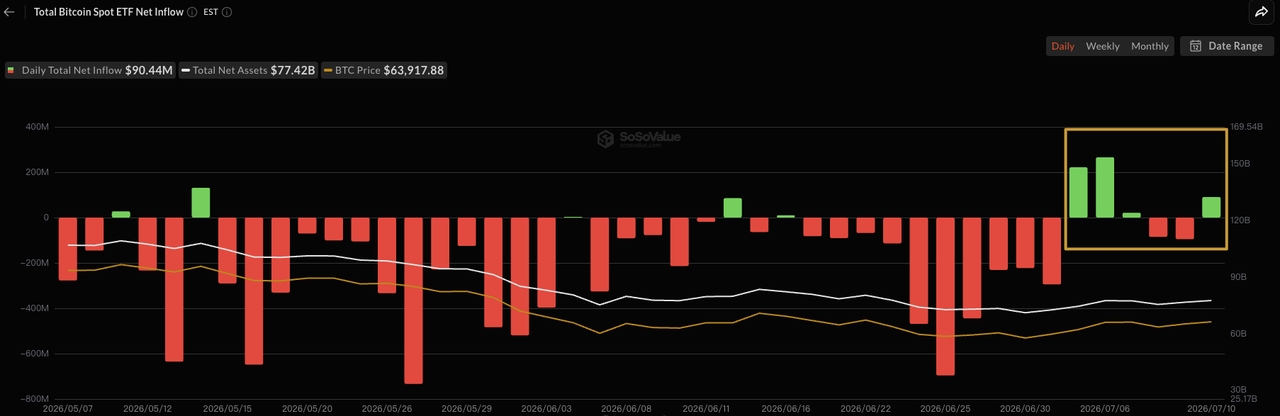
This is not ETF demand disappearing — it is demand halting at the first significant macro resistance. Market participation breadth and trading volumes remain subdued in the summer lull, leaving BTC highly sensitive to macro and geopolitical events. Whether the scheduled events on July 14th restarts the inflow impulse is the most important flow observation of the cycle.
VI. Outlook for This Week
CPI (Jul 14) + PPI (Jul 15) + JPMorgan/Goldman Sachs Q2 earnings (Jul 14) — the most macro-dense 48 hours of the cycle.
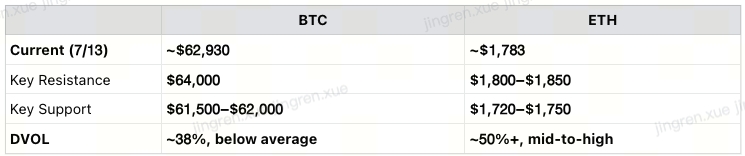
Next week's macro calendar:
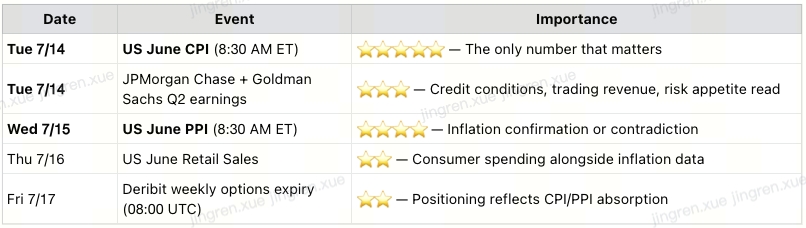
Three Scenarios:
VII. Strategy: ETH Put Seller — Size Down Before CPI Opens
The strategy is unchanged; the sizing discipline is everything.
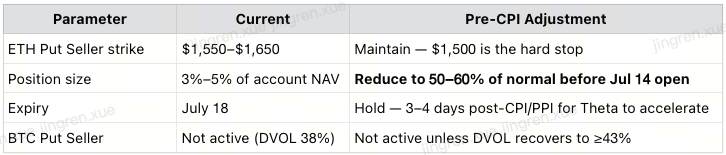
Why size down but not exit entirely?
Exiting completely means forfeiting Theta decay on a position that may behave well through expiry. Reducing to 50–60% of normal sizing means: if CPI is soft, the position runs and collects premium through the July 18 expiry; if CPI is hot, the reduced size limits the drawdown to a manageable level before the $1,500 ETH hard stop is triggered.
Post-CPI decision tree:
CPI soft → restore full sizing; evaluate rolling to next cycle; consider BTC Put Seller if DVOL ≥43%
CPI in-line → hold at reduced sizing through PPI; reassess after both prints
CPI hot → close immediately; no averaging, no waiting for a bounce
Both CPI and PPI surprise hot (stagflation) → full exit + launch Buy Put hedge (ETH: $1,500 breakdown confirmed; BTC: $58,000 breakdown confirmed)
⚠️ This strategy is for informational purposes only and does not constitute financial advice. Actual strikes, premiums, and risk exposure depend on live IV at time of entry. |
Weekly Summary:
FOMC minutes confirmed a split committee: unanimous hold at 3.50%–3.75%, but genuine disagreement on the next steps; AI capex named as a worrying inflation driver; "firming later in 2026" language survived. September hike odds hold near ~80%.
Four structural headwinds operating simultaneously: hawkish Fed (AI inflation structurally defined) + geopolitical re-escalation (ceasefire declared over) + STRC below par + Clarity Act odds below 50% — collectively explaining why BTC hasn't broken $65,000 despite the weakest NFP in years.
ETF inflow streak ended in two days: July 6 +$266M, July 7 +$21.5M, July 8 −$84.9M on the FOMC minutes. Post-NFP demand is notable but fragile; institutional structural conviction has not yet reversed.
Ceasefire formally collapsed — geopolitical risk upgrades from friction to structural reset. Trump declared the agreement over at the NATO Ankara summit. WTI crude surged 5% to $74+. BTC fell to an intraday low of $62,600. This is not another Iran flare-up — this is the framework itself breaking down, and higher oil feeds directly into future CPI prints. Yet, markets appear sanguine, for now.
Tomorrow's CPI is the signal. Soft print partially relieves all four headwinds. Hot print compounds all four simultaneously.
Strategy: ETH Put Seller, reduce to 50–60% of normal sizing before CPI opens. The vol premium in ETH remains worth harvesting; the discipline is entirely in the sizing. Soft CPI → restore full position. Hot CPI → close immediately, no hesitation.