
Bybit Options Weekly Review: April 29–May 5

Opening Snapshot | The Week in Short
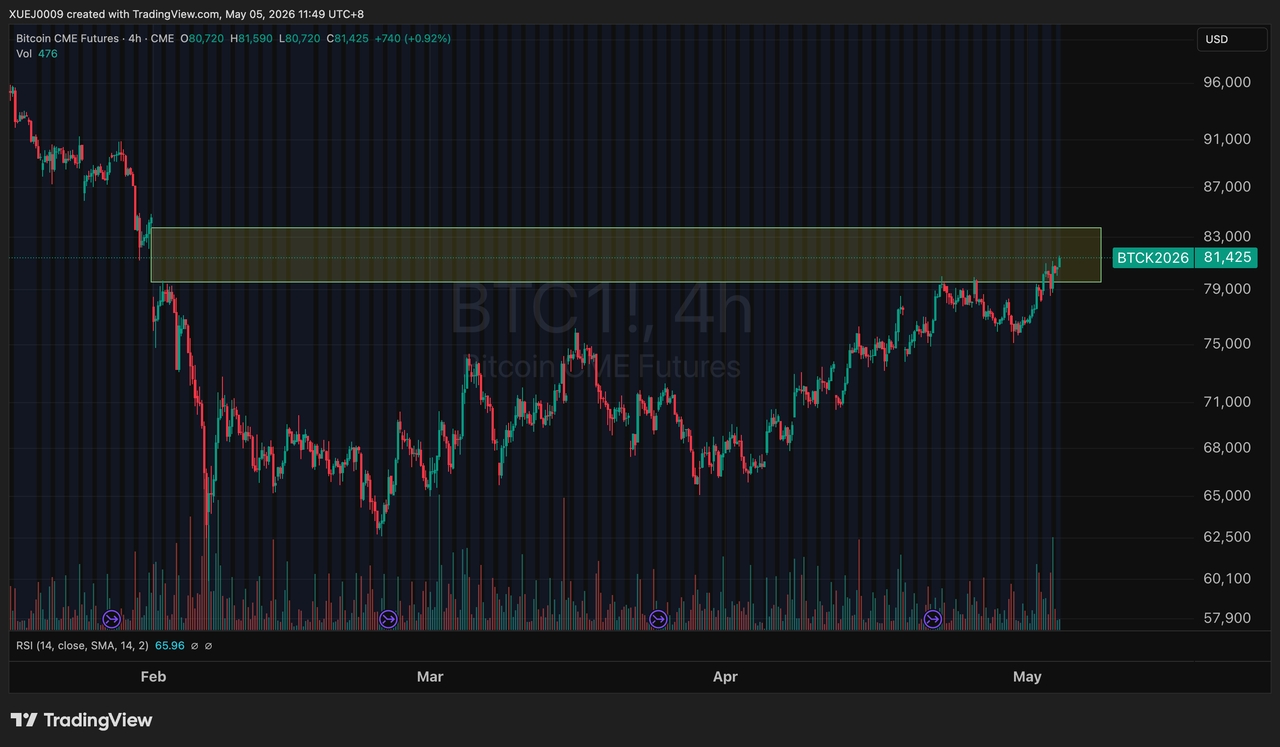
The Long Strangle appears to have worked. BTC sold off for what may be the 9th time in 10 FOMC meetings. Then it didn't just rebound — it may have broken through a key ceiling. BTC pushed past $80,000 for the first time since end-January. The put leg likely paid on the FOMC selloff; the recovery may have done the rest. But here's the twist worth watching: while BTC hit a 3-month high, DVOL fell further to 38, closing at 39.51. Price at a potential 3-month high. IV at what could be a multi-year low. This may be the setup for Round Two — but the market could surprise in either direction. |
This past week was the "setup week."
The coming week stands to be "execution week."
The strangle may have paid. And conditions that could support Round Two appear to have formed.
I. Market Recap | The Script May Have Run on Time — Then Possibly Went Off-Script
We noted last week that BTC has dropped after 9 of the last 10 FOMC decisions, and this FOMC appeared to have two sell-the-news catalysts stacked in the same week — the Fed meeting and the Bitcoin Conference.
Here is how it appeared to play out.
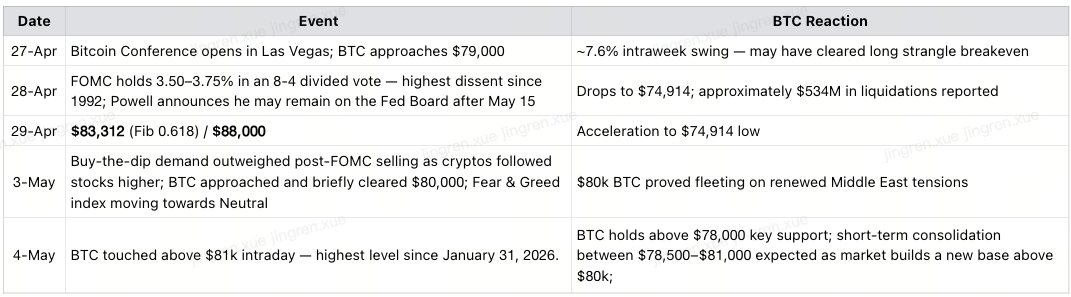
Bitcoin touched $79,000 on April 27 as the Bitcoin 2026 Conference opened at The Venetian in Las Vegas. By April 28, the price had slipped back to roughly $76,300. Then FOMC started, BTC fell from $77,000 to $75,834, slicing below its 20-day moving average — consistent with 9 of the last 10 FOMC meetings.
What followed may not have followed the expected script. Instead of consolidating at lows, BTC was bought and even went on to briefly clear $80,000 for the first time since January 31st. DVOL, meanwhile, moved in the opposite direction, falling to a weekly low of 38 before closing at 39.51.
Weekly Price Action:
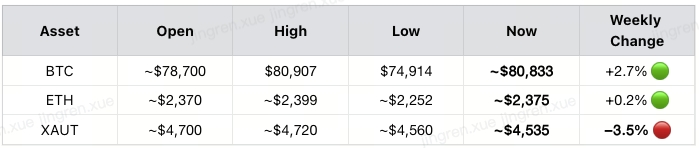
XAUT's decline may tell a story: Gold sold off as BTC pushed higher — potentially suggesting capital rotating toward risk-on assets. The −3.5% week for XAUT against a +2.7% week for BTC could indicate a rotation, though this interpretation warrants caution given ongoing geopolitical uncertainty.
"April 2026 closed with $1.72 billion in spot Bitcoin ETF net inflows, marking a strong month of institutional demand. Cumulative net inflows for the 11 US-listed spot Bitcoin ETFs stand around $58B, still down from a peak of $63 billion.
A joint Coinbase Institutional / Glassnode report suggested 75% of institutional investors and 71% of retail investors may currently view BTC as undervalued — though individual assessments will vary.
Event Timeline:
II. Options Data | Strangle May Have Paid, DVOL Fell Further — A Divergence Worth Watching
This week's most notable signal may not be the price action itself. It could be the fact that DVOL fell further to 38 while BTC approached a 3-month high and sentiment may have moved to Greed.
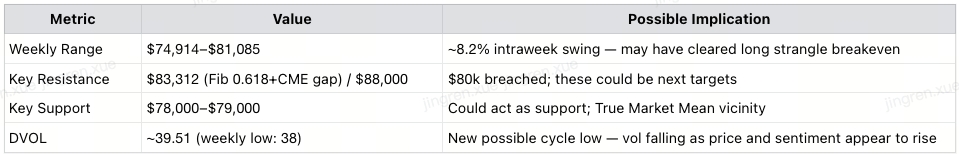
BTC moved from $74,914 to $80,907 — a roughly 8% move that appeared to break above a key range. DVOL printed a new weekly low of 38, closing at 39.51. These signals potentially point in different directions:
Price may suggest: breakout, possible new range
DVOL may suggest: the market expects little further movement
Whether DVOL's reading is "wrong" is uncertain — but the divergence is notable and worth monitoring closely.
Post-FOMC Options Snapshot:
What this possible three-way divergence could mean:
When price, sentiment, and implied vol appear to diverge at extremes, historical patterns suggest the gap tends to close — though the direction and timing are uncertain. If the breakout continues, DVOL may need to reprice higher. If the breakout fails, DVOL could also reprice higher from the other direction. Whether DVOL at 39.51 is "mispriced" remains an open question — but the divergence creates a potentially asymmetric setup for options buyers.
Post-Expiry Derivatives Dynamics:
Around $7.27B BTC open interest with a possible slight short majority — approximately 47.5% longs vs. 52.5% shorts. If BTC continues to hold near $80k, this short positioning could create upward pressure — though a swift reversal could liquidate long positions instead.
The 30-day funding rate is around −5% — suggesting shorts are being compensated to hold, yet BTC may have moved above $80k anyway. This could indicate spot-driven demand, though interpretation of funding rates involves uncertainty.
DVOL at 39.51 means entering a long strangle now could be cheaper than entering at last week's 41 level — though lower premiums also reflect the market's view that large moves are less likely.
ETF Flows — April's Possible Final Tally:
April 2026 closed with about $1.7 billion in spot Bitcoin ETF net inflows, marking a strong month of institutional demand, with IBIT leading the way as usual. Morgan Stanley's MSBT already attracted nearly $200M in its early weeks.
Bitcoin spot ETFs recorded 9 straight days of inflows, totalling over US$ 2 billion through April 23rd, before the wininng streak ended with a $263 million net outflow on April 27th, and the net selling persisted through April 30th.
The price recovery from $74,914 to $80,907 could suggest institutional re-entry after the FOMC event — though causal attribution of price movements is inherently uncertain.
READ MORE: "Institutional Demand Underpins BTC’s Best Month Since April 2025"
III. Macro Background | Powell's Final Meeting, Warsh's Incoming Tenure
The Fed's Most Divided Vote Since 1992:
The FOMC held rates at 3.50–3.75% in an 8-4 vote — potentially the most divided Fed decision since 1992. Governor Stephen Miran voted for a 25bps cut; while 3 other presidents opposed suggestions of an "easing bias" in the policy statement. Powell has indicated he may stay on the Fed Board after May 15 — which could be unusual by historical standards.
This internal division could create friction between Powell and incoming Chair Kevin Warsh, though the actual dynamics of that relationship remain to be seen. Whether BTC's move toward $80k reflects genuine indifference to Fed transition risk, or simply short-term positioning, remains an open question.
Oil, Inflation, and Possible Fed Constraints:
Powell indicated that higher energy prices may be pushing inflation higher. Brent crude averaged approximately $103/barrel in March; the EIA has forecast a possible Q2 peak near $115 before a potential decline below $90 in Q4 — though forecasts carry significant uncertainty. Both headline and core inflation may be running above target through separate channels.
Trump is keeping the Hormuz blockade in place, while Iran continues to hold firm on its conditions. BTC's move toward $80k despite elevated oil prices could suggest the market is treating the conflict as a more predictable risk factor — though this interpretation could change quickly if the situation escalates.
Kevin Warsh — A Variable With Unclear Direction:
Warsh's actual policy stance as Chair may differ from pre-appointment commentary, given the divided FOMC voters and the highly-uncertain inflation outlook. A dovish surprise at the June 18 FOMC could alter the sell-the-news dynamic — but this is speculative. Post-FOMC signals have been relatively constructive, though whether they point toward $88k or simply reflect temporary positioning is uncertain.
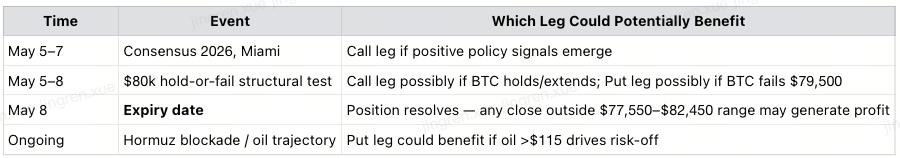
Consensus 2026 (Miami, May 5–7) — Potential but Uncertain Catalyst:
Consensus 2026 begins May 5 — a significant crypto policy and institutional event. Discussions may touch on regulation, ETF developments, and institutional adoption. Past Consensus events have produced both meaningful policy signals and market-neutral outcomes. With BTC near $80k and sentiment bordering Neutral, a positive regulatory signal could support further upside — but disappointing headlines from an already borderline neutral market could also trigger consolidation.
IV. Outlook for Next Week (May 5–11)
$80,000 may be a new resistance level. Sentiment may abandon Fear. DVOL is at 39.51. Whether these conditions persist is the key question.
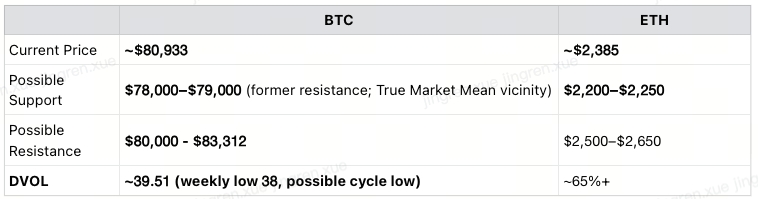
Whether the $80k level is conquered as resistance , or whether the recent move proves to be an overextension, remains genuinely uncertain. Structural support may exist between $65,000–$70,000, with the −1 standard deviation band near $68,000 as a potential floor if price reverses — though these levels are not guarantees.
Three Scenarios — Each Could Imply a Significant Move:
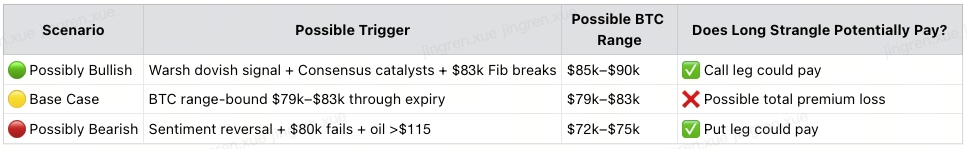
Worth noting: The sideways base case — while historically less common after major breakout attempts — is a genuine possibility that options buyers must price into their risk tolerance. The strangle strategy's thesis is that DVOL may be underpricing future moves, but this view could prove incorrect.
CME Gap in Late January& Early February
The $83,000–$83,500 area may represent compounded resistance where the CME gap ceiling, the Fib 0.618 at $83,312, and the average ETF cost basis all converge. A decisive close above $83,500 on volume could open the path toward $88,000; a rejection at this cluster may push price back toward the $79,500 gap floor and benefit the Put leg of the strangle. |
V. Trading Strategy | Long Strangle — Round Two
🔄 Strategy Review: Round One May Have Worked. Similar Conditions Could Support Round Two.
Last week's thesis: DVOL 41 + catalyst density = options buying may be favored over selling.
Possible outcomes:
BTC moved from ~$78,700 to $74,914 low — Put leg may have paid ✅
BTC recovered to $80,416 — possible breakout benefit ✅
Intraweek range: ~7.6% — may have cleared strangle breakeven
The sell-the-news pattern may have confirmed again — followed by what appeared to be an unusually strong post-FOMC recovery.
Why Iron Condor may be less suitable here:
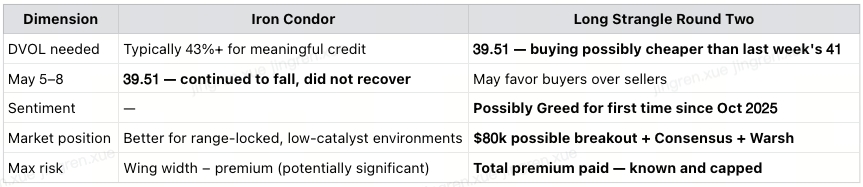
✅ Possible Strategy: Long Strangle (5/8 Expiry)
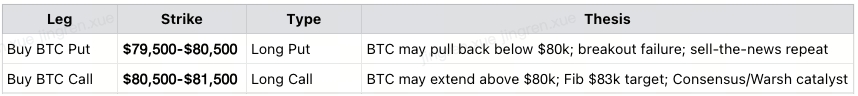
Structure:
P&L Profile (per the reference diagram — illustrative only, not financial advice. Actual outcomes may differ.)
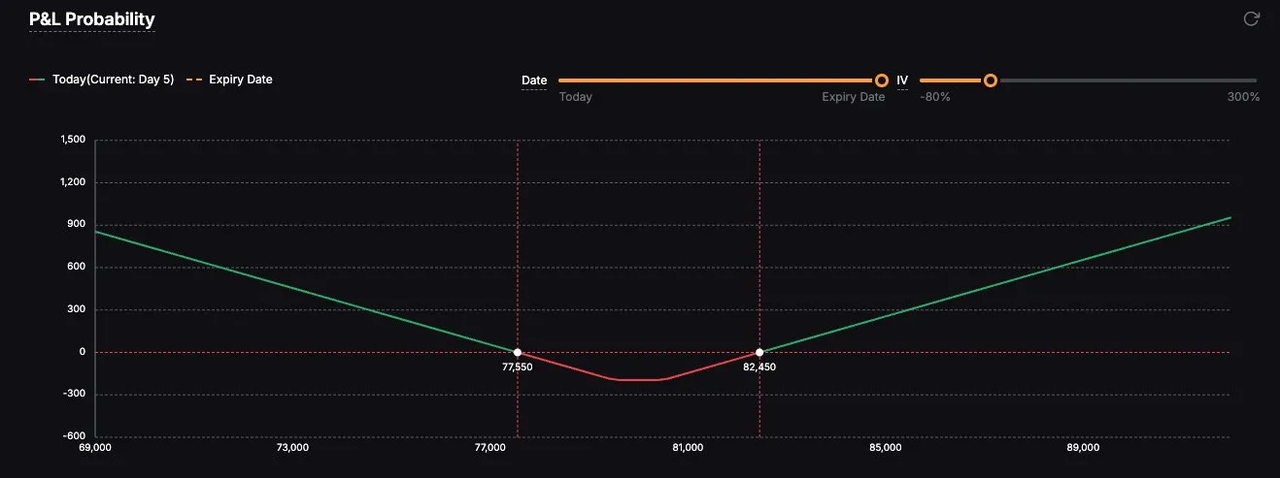
Breakeven (downside): — BTC needs to fall below this level for the Put leg to potentially turn profitable at expiry
Breakeven (upside): — BTC needs to rise above this level for the Call leg to potentially turn profitable at expiry
Max loss: Total premium paid on both legs — occurs if BTC expires anywhere between $79,500 and $81,500; loss is capped and known in advance
Potential profit zone (downside): Below ~$77,550 — the further BTC falls, the more the Put leg may gain
Potential profit zone (upside): Above ~$82,450 — the further BTC rises, the more the Call leg may gain
Why this specific structure:
Near-the-money strikes : Tighter than a conventional strangle — the gap between strikes reflects the view that BTC is sitting precisely at the $80k decision point. The market may move sharply in either direction from this level; being near-the-money may provide faster delta exposure once a direction is chosen
DVOL 39.51 entry advantage: Entering both legs at a possible cycle vol low may reduce premium cost relative to historicalT norms — though lower vol also reflects the market's view that large moves are less likely
5/8 expiry: Potentially covers Consensus 2026 (May 5–7) and the early post-FOMC positioning unwind window; short enough to limit time-decay drag, long enough to capture the catalyst window
📅 Key Dates and Possible Leg Outcomes
⚠️ Key Risks
Primary risk: BTC expires between $79,500 and $80,500 on May 8 — both legs expire worthless, resulting in total premium loss. At current price ($80,933), BTC is sitting almost exactly in the max-loss zone
Time decay: With 5/9 expiry, theta drag will accelerate meaningfully in the final 2–3 days if BTC remains range-bound near current levels
Mitigation options: ① If a sharp move occurs before May 8, consider closing the profitable leg early ② Cap total premium to 3–5% of account NAV ③ Monitor $79,500 and $80,500 as early warning triggers — a sustained close outside either strike may signal which direction is developing
Slight Put overweight consideration: With BTC currently above the midpoint and sentiment possibly at Greed near resistance, a slightly larger allocation to the Put leg (55/45) may provide partial protection against breakout failure — though this is a personal risk management judgment
⚠️ The P&L diagram is provided for illustrative reference only. Actual breakeven levels, premium costs, and outcomes depend on live option prices, bid-ask spreads, and implied volatility at the time of entry. Past strategy outcomes do not predict future results. This is not financial advice. |
Closing Summary | Three Things to Consider
① The Long Strangle may have executed well — DVOL 41 + dense catalyst week may have produced the volatility the market wasn't fully pricing. BTC appeared to swing $78,700 → $74,914 → $80,416 , possibly clearing the two-month ceiling. The sell-the-news pattern may have confirmed again — followed by what looked like an unusually strong post-FOMC recovery. Whether this constitutes a durable breakout remains to be seen. ② Two signals, one possible paradox: BTC at 3-month high ($81k), and DVOL at cycle low of 39.51 (weekly low: 38). Whether this divergence resolves through a sharp directional move or simply closes gradually is uncertain — but the setup is worth monitoring closely. ③ The strategy remains Long Strangle — a possible Round Two. DVOL at 39.51 may make entry cheaper than Round One. $81k proximity + $83k Fib resistance/CME gap + Consensus 2026 + Warsh transition could represent a catalyst-dense two weeks. If this approach is taken: slight Put overweight (55/45) may be worth considering given Greed near resistance; cap premium at 3–5% of account; 5/8 or 5/15 expiry may cover the key window. This is not financial advice — all trading decisions carry risk. |