


Bybit Options Weekly Review: Jul 14–Jul 20

TL;DR
June CPI fell 0.4% MoM — the largest single-month decline since April 2020; YoY slowed to ~3.5% (vs. 3.8% expected, prior 4.2%)
June PPI: 5.5% YoY (vs. 6.2% expected), core PPI 4.7% (vs. 5.2%), MoM −0.3%;
Warsh Congressional testimony Day 1: deliberately cautious — "one data point, I don't want to overread"; "mission accomplished is not my view." Day 2: unexpected dovish signal — AI demand price pressures are a "one-time change," supply response expected, not necessarily requiring a monetary policy response
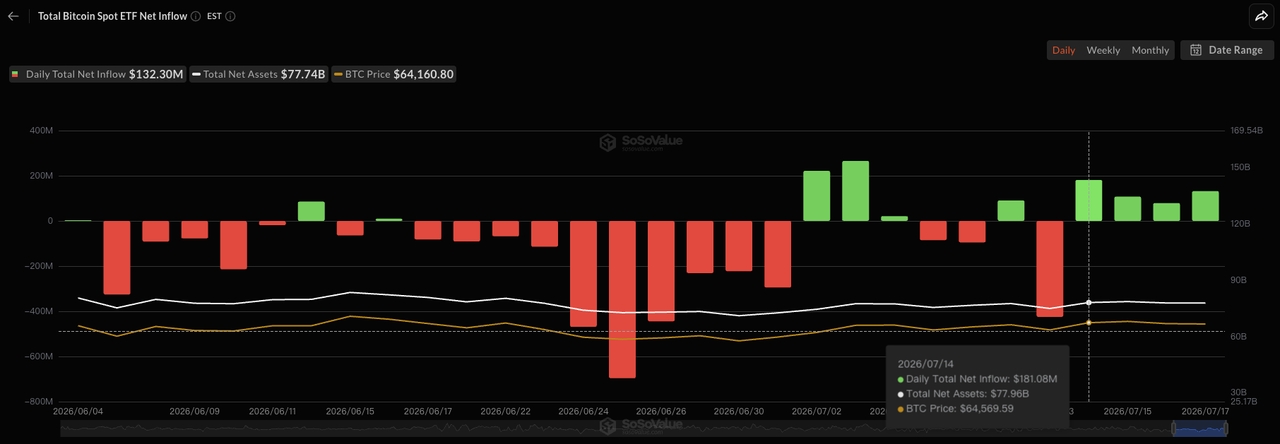
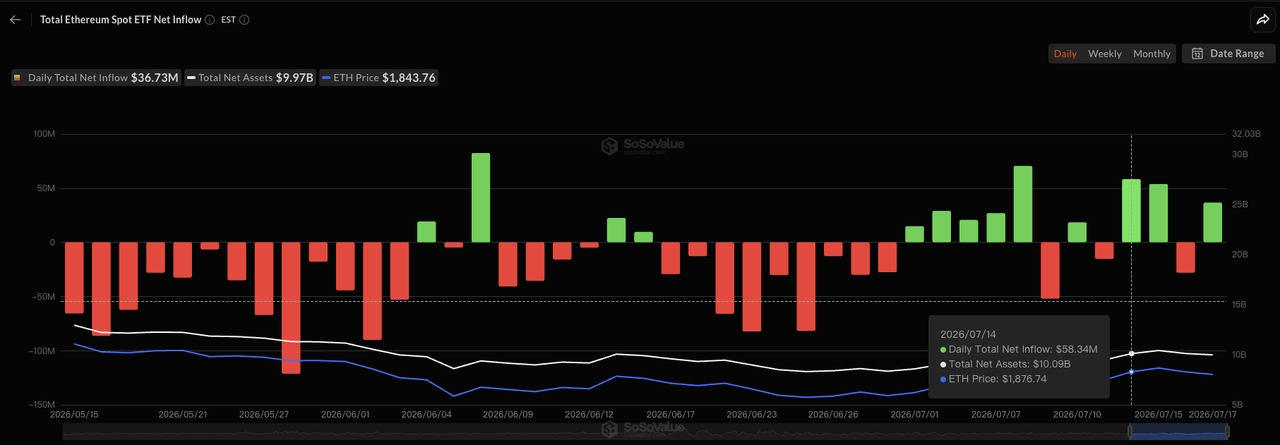
Second consecutive week of ETF net inflows; Bitcoin ETFs took in $500.2M across four sessions; ETH ETFs accounted for 58% of total crypto ETF flows;
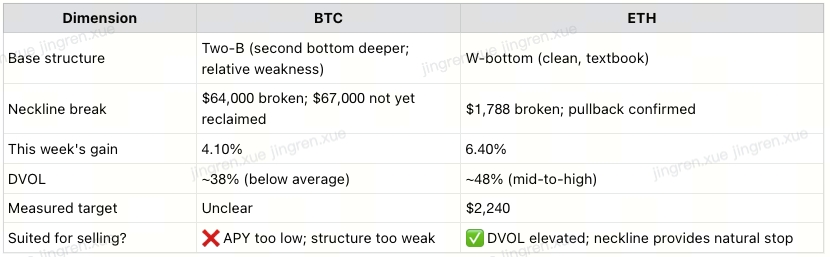
Technicals: ETH confirmed W-bottom double base, potential measured target $2,240; BTC formed a Two-B structure (second bottom deeper than first), weaker recovery than ETH, $64,000 flipped from resistance to support, $67,000 is the key validation level
This week's strategy: ETH's elevated DVOL relative to BTC may continue to offer more favorable premium capture around the $1,700–$1,750 zone — a level that could benefit from structural support near $1,788. BTC's heavier overhead supply may warrant patience before any directional commitment.
I. Weekly Market Recap
Price Action (Bybit Platform Data, July 14–20):

All three assets closed higher. The week's core driver was the CPI + PPI double miss, which collapsed July rate hike expectations from 50% to 13% and triggered a wave of forced short covering. ETH materially outperformed BTC, with the ETH/BTC ratio recovering significantly — the most important relative price signal of the week.
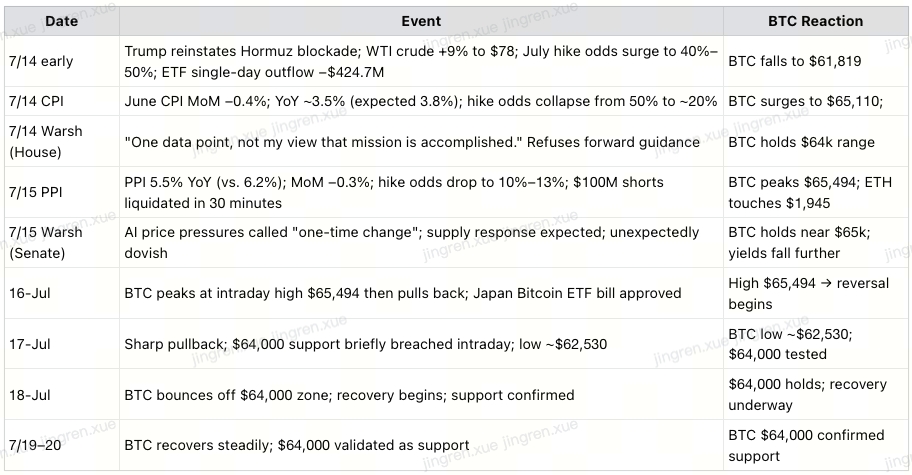
Event Timeline:
II. CPI/PPI Double Miss: Too Early to Call Disinflation
The data:
June CPI fell 0.4% MoM — the largest monthly decline since April 2020 — with YoY slowing to ~3.5% (expected 3.8%). PPI came in at 5.5% YoY (expected 6.2%), core PPI at 4.7% (expected 5.2%), MoM −0.3%. Both prints missed to the downside. September hike odds halved from fully expected (100%) to 55%.
Why the foundation is fragile:
June CPI's decline was almost entirely driven by energy — gasoline fell roughly 10% in June because the Strait of Hormuz reopened during the US-Iran ceasefire. But Trump reinstated the Hormuz blockade the day before CPI was published, and crude surged over 9% on the day, with Brent climbing above $87. The friendly CPI number looks backward; oil prices are already looking forward. PPI's signal is more structurally meaningful — wholesale pipeline pressure easing across the supply chain is the more reliable component of this week's data.
Warsh testimony: two days, two tones
Day 1 (House): deliberately cautious. Asked about the CPI print, Warsh told lawmakers: "There might be some who say, 'Look, mission accomplished, everything is swell.' That is not my view." He offered no forward guidance and refused to read policy conclusions from a single data point.
Day 2 (Senate): an unexpected dovish signal. Warsh conceded AI-related demand could cause price pressures in the coming months, but declined to call it inflationary — describing it as a "one-time change in prices" with a supply response expected, which would ultimately be disinflationary. This is a meaningful softening from the FOMC minutes' language of "AI capex as a structural inflation driver," and bond yields fell further in response.
III. Technical Analysis
3.1 ETH: W-Bottom Confirmed, Measured Target $2,240
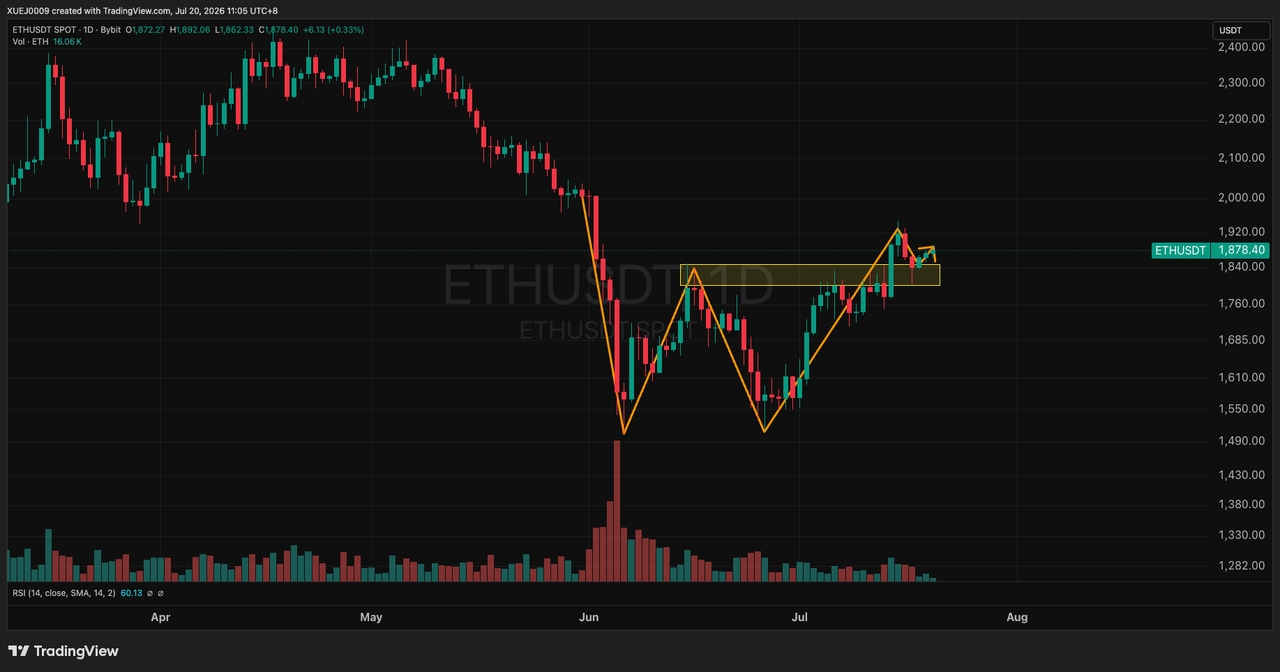
ETH has formed a textbook W-shaped double bottom:
Left base: ~$1,500 (early June crash low)
Neckline: ~$1,788 (tested multiple times, held each time)
Right base: ~$1,550–$1,600 (early July second test)
Breakout: July 14 — CPI-driven volume surge; ETH broke above the $1,788 neckline convincingly
Pullback confirmation: Post-breakout low-volume pullback to neckline, followed by renewed upside — the most technically significant confirmation in the entire structure
Volume profile validation:
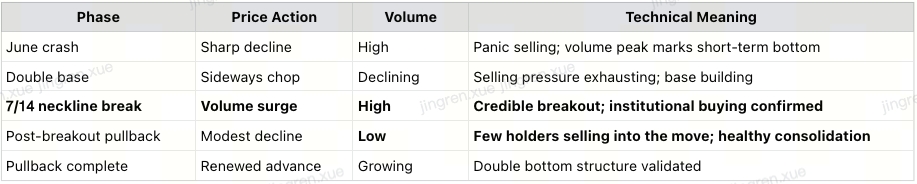
The low-volume pullback is the highest-conviction element of the structure. When a breakout is followed by low-volume consolidation rather than high-volume reversal, it signals that sellers have been exhausted — holders are unwilling to sell, and overhead supply is limited.
Measured target: $2,240
Neckline ($1,788) + distance from neckline to base (~$288) = measured target approximately $2,240–$2,280. This level is not arbitrary — it coincides with a historically significant dense trading zone where substantial prior cost basis is concentrated, creating both a technical and supply-side resistance wall.
The path upward is not clear — three resistance levels to work through:

3.2 BTC: Two-B Structure, Weaker Recovery, $64,000 Flips to Support
Unlike ETH's clean W-bottom, BTC formed a "Two-B" structure — two bottoms, the second one deeper.
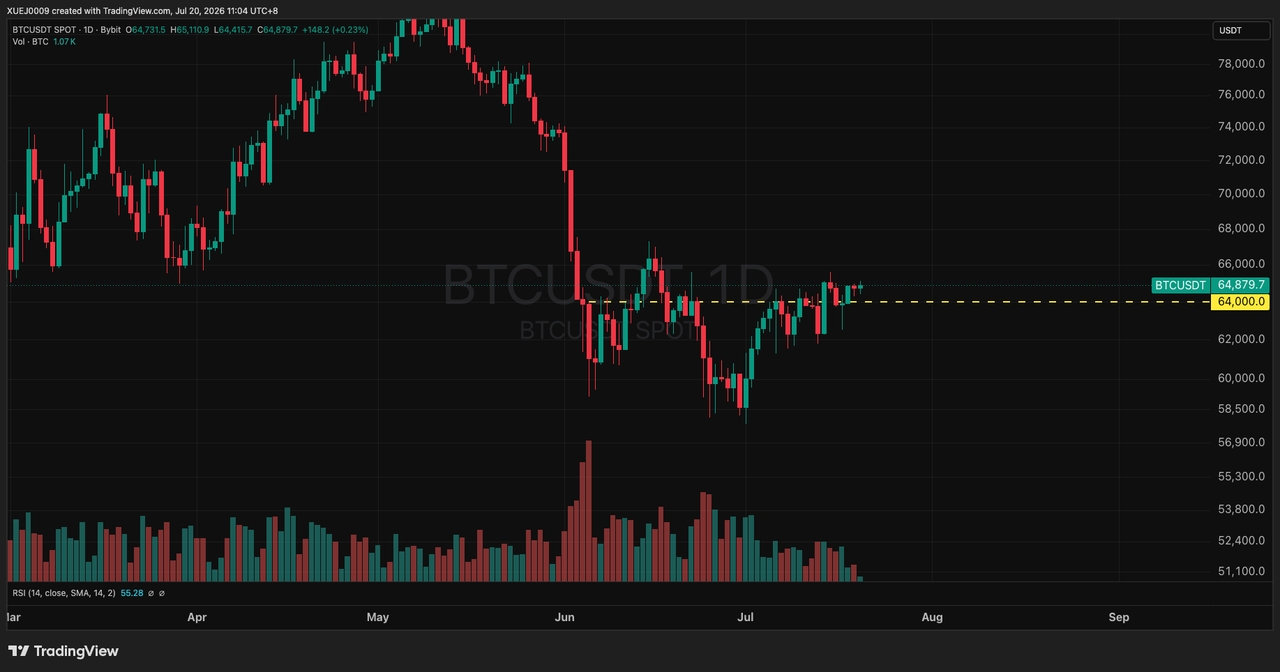

BTC made successive new lows ($59,130 → $57,802), while ETH's two bottoms were roughly in the same zone (~$1,500–$1,550), forming the cleaner W pattern. The distinction is critical: under identical macro triggers, BTC fell further and recovered less — that divergence is itself a relative weakness signal.
$64,000: from strongest resistance to most important support
After breaking above $64,000 on July 14, BTC flipped the level that had capped every rally attempt for weeks. Resistance-to-support flips are among the highest-conviction signals in technical analysis — those who sold at $64,000 previously now have incentive to buy there to recover their basis, mechanically creating a support base.
But how durable this support proves to be remains to be seen. BTC already faced visible selling pressure at $65,000 this week, confirming the road above $64,000 is not clear.
Key resistance levels above:

$67,000 is the Two-B validation level. BTC has not yet reclaimed its prior recovery high of $66,400–$67,000. Until that level is cleared, the Two-B structure remains incomplete and a cautiously bearish bias is warranted above current levels.
ETH vs BTC structure summary:
IV. ETF Flows: Second Consecutive Week of Inflows, ETH Dominates
Total BTC ETF Net Inflow
According to data from Sosovalue.com, Bitcoin ETFs recorded a −$424.7M outflow on Monday before posting +$500.2M in net inflows across the following four sessions; IBIT drew $204.1M for the week; competing BTC products saw a combined $128.6M in outflows — capital remains highly concentrated in BlackRock's franchise.
Total ETH ETF Net Inflow
ETH ETFs outperformed: ETHA attracted $135.3M; ETH products accounted for 58% of total crypto ETF flows for the week; BlackRock drew $343.4M across both BTC and ETH products, while all other issuers collectively saw $162.4M in outflows.
The key read: This is the second consecutive week of ETF net inflows — one of the bottom confirmation conditions we flagged in prior reports. But Monday's −$424.7M single-day outflow is a reminder that geopolitical shocks can reverse these trends instantly. The direction is right; the magnitude still needs to prove itself.
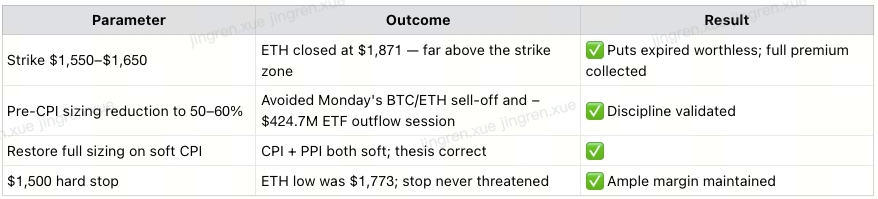
V. Last Week's Strategy Review: ETH Put Seller Delivered in Full
VI. This Week's Strategy: ETH Near-Dated Put Seller — Harvest Premium in a Quiet Week
This week is relatively calm. Next week's FOMC is the real event. The macro calendar this week is light — no tier-one data, no scheduled Fed communications — and that is precisely the environment where a seller strategy works best: no major catalyst = implied vol stays anchored = theta decays predictably = premium income is reliable.
Why we continue with ETH Put Seller:
Two independent sources of conviction reinforce the trade this week:
Macro: CPI/PPI double miss has removed the most acute near-term headwind; the market has shown resilience after multiple shocks; the primary bearish catalysts have been priced
Market structure: ETH outperformed BTC significantly last week (+10.7% vs +3.1%); ETH ETFs are attracting consistent institutional flows; the W-bottom technical structure validates the seller framework
This also confirms the thesis we have operated on for weeks — running Put Seller on ETH has delivered consistent premium income across multiple market environments.
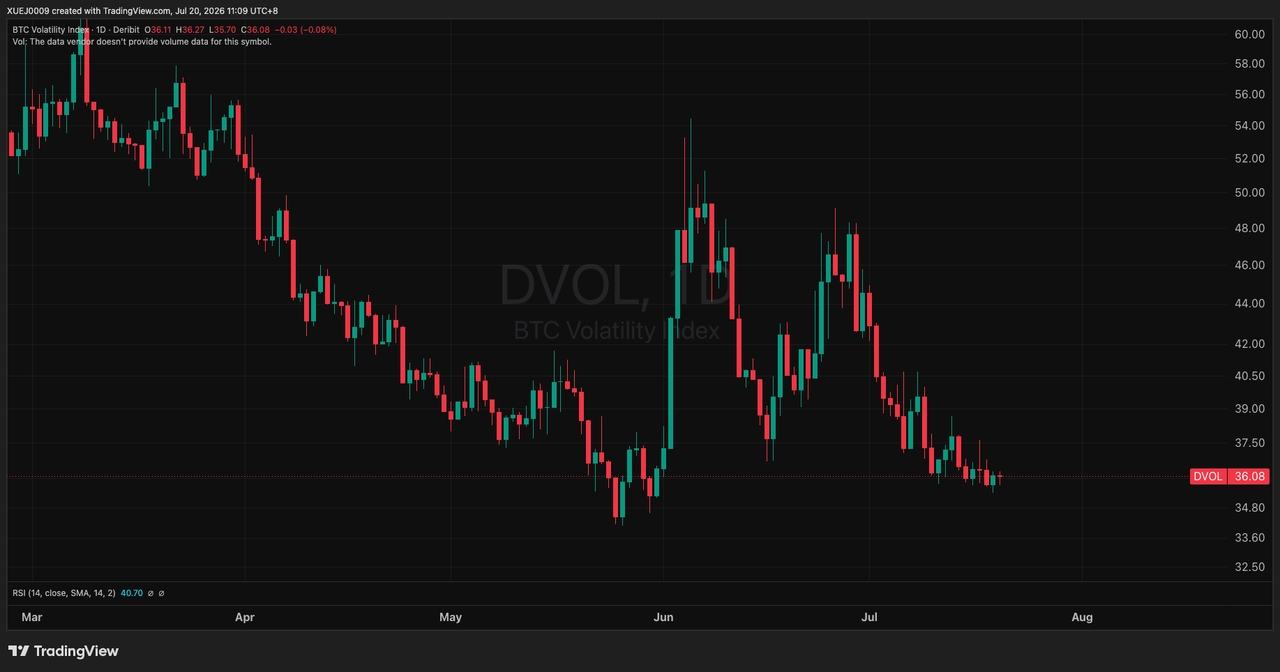
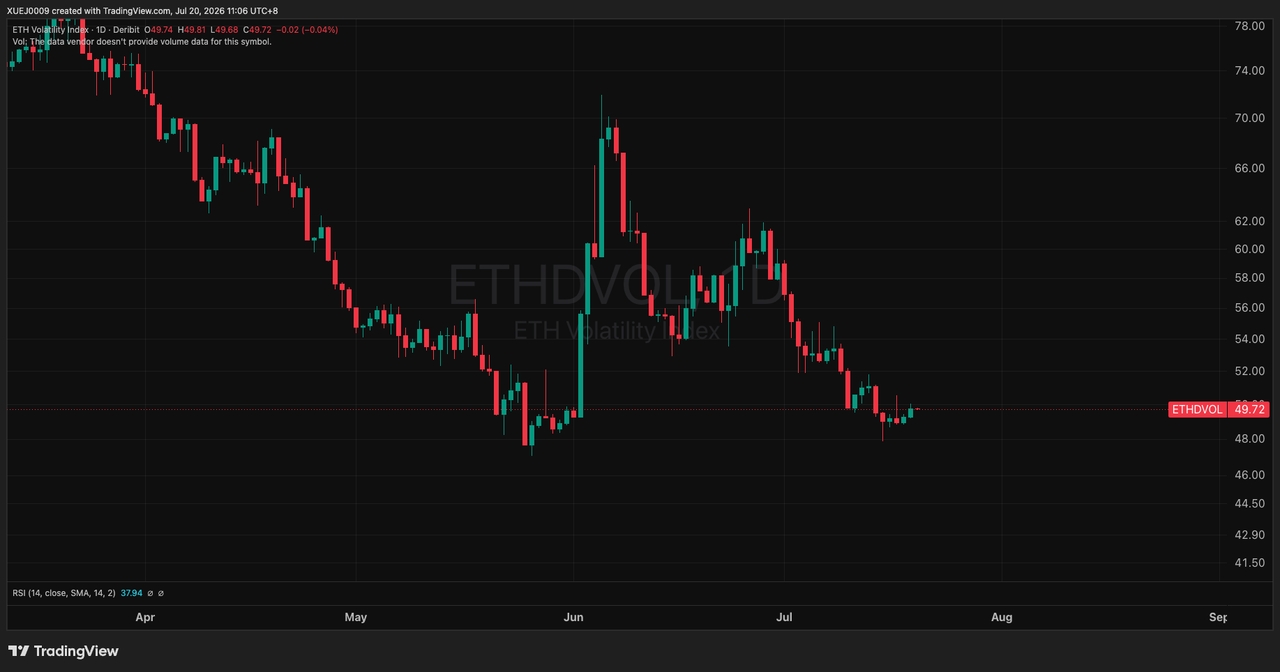
This week's specific trade — ETH near-dated Put Seller:
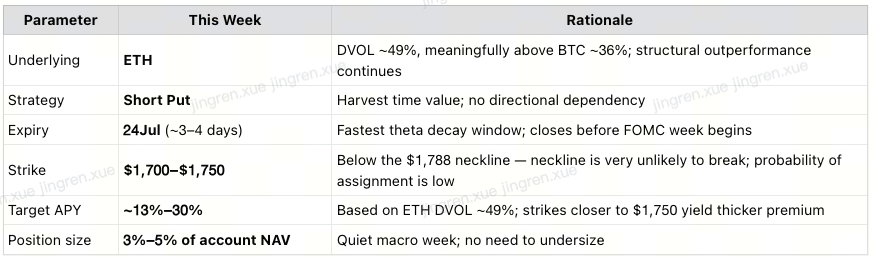
Why $1,700–$1,750 — the neckline logic:
The ETH neckline sits at ~$1,788, the keystone of the entire W-bottom structure. Placing the strike below that level at $1,700–$1,750 creates two layers of protection:
ETH would need to first break the $1,788 neckline before approaching the strike
The neckline commands strong structural buying — in a W-bottom formation, the neckline is the last line of defense for the entire pattern; holders defend it actively
In essence, the strategy's effective stop-loss is placed at the level where the entire double-bottom structure fails — the technical framework and the options structure are aligned.
Stop discipline:
ETH daily close below $1,750 → evaluate early exit
ETH daily close below the $1,788 neckline on a confirmed basis → close immediately, do not hold to expiry
Any unexpected geopolitical event or surprise Fed communication → pause operations
Why not BTC Put Seller:
BTC's Two-B structure means a more tortured recovery path — fell further, bounced less, more overhead trapped supply. $64,000 flipping to support is constructive, but without $67,000 being reclaimed, there is no technical basis for aggressive BTC positioning in either direction. We do not run BTC directional trades this week.
Looking ahead to next week:
After the FOMC decision, we will reassess the full strategy framework in next week's report — evaluating the Fed's language, BTC's technical position, and DVOL levels to plan the next phase. If FOMC confirms a hold with neutral language, it sets up one of the best new position windows of the entire cycle.
⚠️ This strategy is for informational purposes only and does not constitute financial advice. Actual strikes, premiums, and risk exposure depend on live IV at time of entry. |
VII. Outlook for This Week (July 21–27)
A relatively quiet week. Next week's FOMC is the major event horizon.

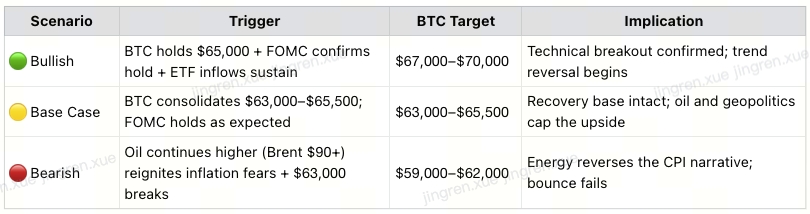
Three Scenarios:
Weekly Summary:
CPI/PPI double miss collapsed September hike odds from 100% to 55%
Warsh: one hawk, one dove. Day 1 refused to declare victory over stubborn inflation; Day 2 called AI price pressures a "one-time change" not requiring a policy response — the closest to dovish Warsh has been since taking office. Bond yields fell further on the signal.
ETH W-bottom confirmed, measured target $2,240; BTC Two-B structure, $67,000 is the key validation level. ETH's neckline breakout with low-volume pullback confirmation is technically clean. BTC's Two-B structure — deeper second bottom, weaker recovery — reflects structural relative weakness that directly explains its underperformance this week.
Second consecutive week of ETF net inflows; ETH accounted for 58% of total crypto ETF flows. ETHA drew $135.3M — ETH is attracting independent institutional demand, not just riding BTC's coattails.
This week's strategy: ETH near-dated Put Seller, strike $1,700–$1,750, target APY ~13%–30%. Quiet macro week with no tier-one data; FOMC not until July 30. This is the optimal window for steady theta harvest. The $1,788 neckline is the natural stop — as long as ETH holds the double-bottom structure, the put seller has textbook technical support beneath the strike.