
Symmetrical Triangle Pattern: What It Is & How to Use It for Crypto Trading

Triangles are one of the most popular chart patterns because they're easy to spot, have a high success rate and can be traded in different ways. Triangle patterns are formed by two converging trend lines that create three sides of a triangle.
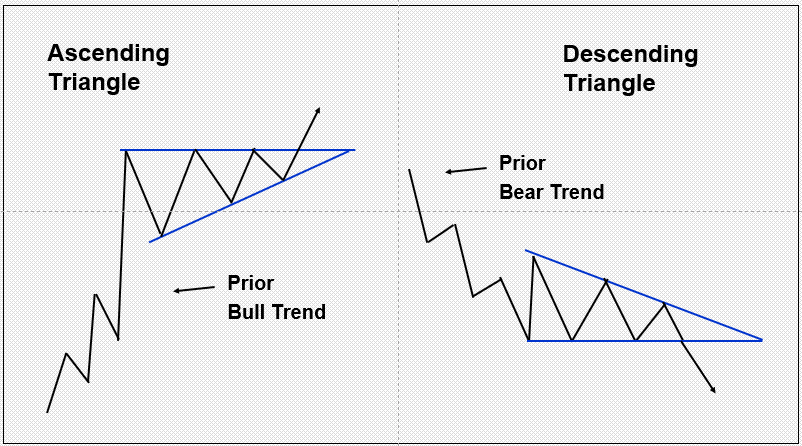
Three basic triangle patterns occur on a price chart: Ascending triangle (bullish), descending triangle (bearish) and symmetrical triangle (continuation or reversal). These represent a period of indecision by traders, and are used to identify a breakout that may lead to a pickup in momentum and a continuation of the preceding direction.
The different types of triangles can be distinguished by their slope or angle (the upward or downward direction in which they move). Furthermore, a symmetrical triangle typically forms over a longer period (greater than three weeks) than the other triangles (up to three weeks).
In this article, we’ll discuss the symmetrical triangle pattern and compare it with the ascending and descending triangle patterns. Additionally, we’ll provide insights for successfully trading the symmetrical triangle pattern.
Key Takeaways:
A symmetrical triangle pattern is characterized by two converging trend lines that create a triangle shape. Traders can use it to identify entry and exit points.
The symmetrical triangle is a neutral pattern with no horizontal line, unlike the bullish ascending and bearish descending triangles.
To confirm their analyses, many traders combine symmetrical triangles with other technical analysis tools.
What Is a Symmetrical Triangle Chart Pattern?
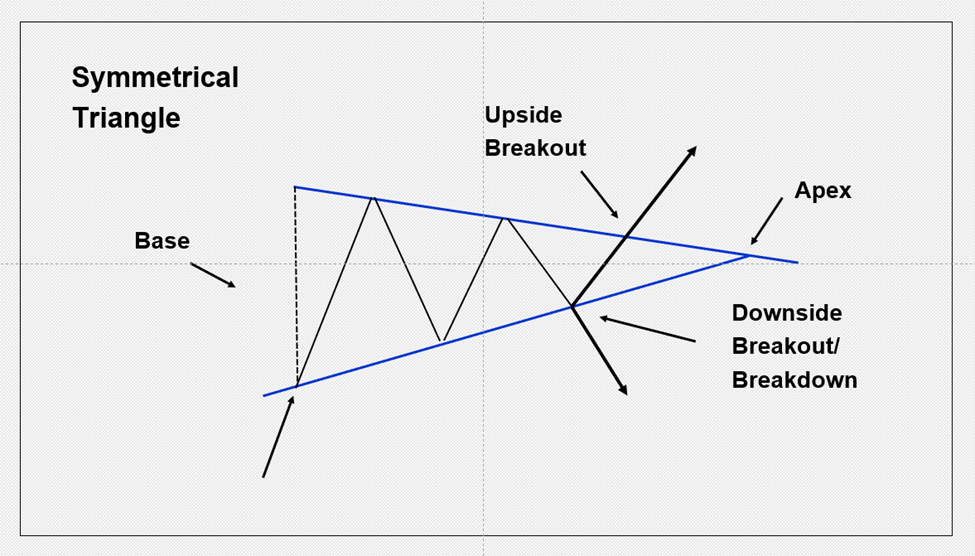
A symmetrical triangle has two converging trend lines on the border of the pattern. The triangle is formed when a declining line across the top meets a rising line along the bottom. A minimum of four points are required to form a symmetrical triangle — two on the top line and two on the bottom line.
Often referred to as a coiled spring, the symmetrical triangle experiences a narrowing price range as it approaches the apex, causing traders to lose interest. This price compression can then lead to explosive moves as traders' interest returns.
Although the symmetrical triangle is classified as a neutral pattern, it’s bullish in an uptrend and bearish in a downtrend, as it’s expected that the original trend will continue. The pattern is confirmed once there’s a breakout. Until then, the pattern is only considered a potential symmetrical triangle.
Meanwhile, ascending and descending triangles are characterized by a horizontal line on their pattern border, with a breakout occurring when the price moves through that line. An ascending triangle features an upper horizontal line and a rising lower trend line connecting higher lows, as buyers become more aggressive during price weakness. In contrast, the descending triangle has a bottom horizontal lower line and a descending trend line that touches lower highs, demonstrating heightened seller aggression, which pushes prices down.
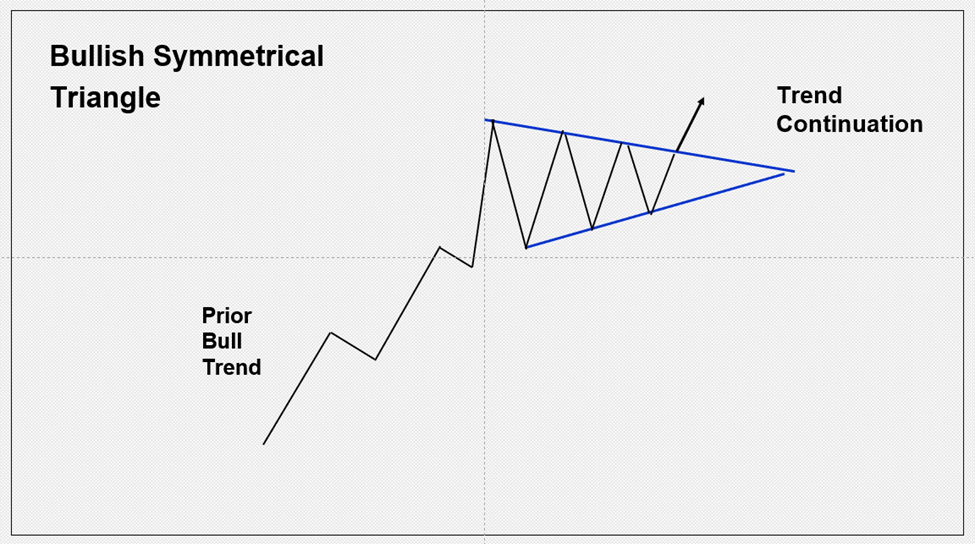
Bullish Symmetrical Triangle
A bullish symmetrical triangle has a clear uptrend before the pattern’s formation. After identifying two points that can be used to draw the top and bottom trend lines, the pattern is created. As the price moves above the top line, a breakout is triggered, with the breakout confirmed on a daily close above the line. Until a breakout occurs, the pattern is not a confirmed symmetrical triangle, as it can always evolve into a different pattern.
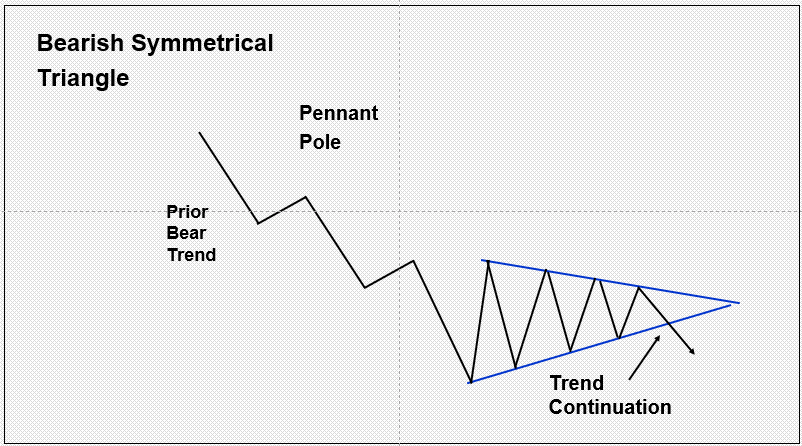
Bearish Symmetrical Triangle
A bearish symmetrical triangle takes place within a downtrend, which is expected to continue once the price falls below the lower line and then closes below it.
How to Spot the Symmetrical Triangle Chart Pattern
We’re looking for symmetrical triangles that occur in trends. Therefore, we first want to identify a trend and look to see if there’s a consolidation pattern that qualifies.
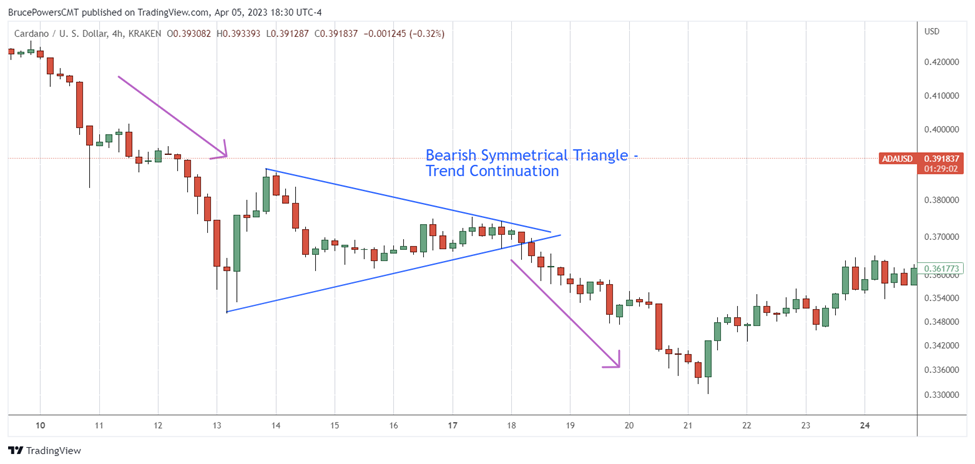
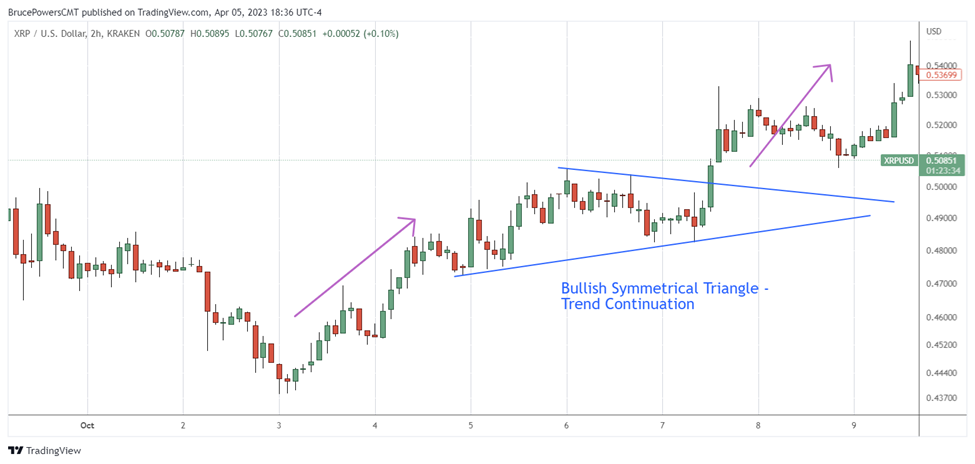
Bearish and Bullish Symmetrical Triangle Continuation Patterns
The following 4-hour chart of ADA/USD shows a bearish symmetrical triangle. It occurs within a downtrend, and triggers a continuation as it breaks down out of the pattern.
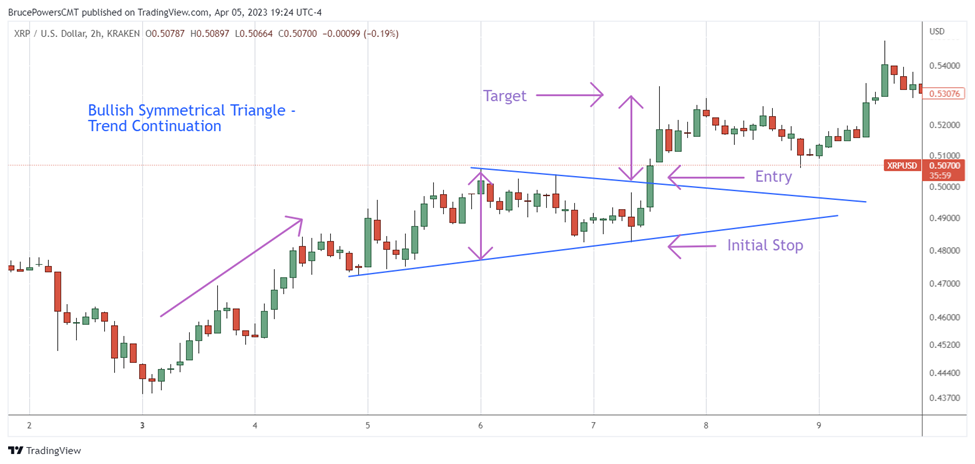
Next is an example of a bullish symmetrical triangle in a 2-hour chart of XRP/USD. The consolidation pattern occurs following a clear uptrend, and triggers an outside breakout on a move above the top line.
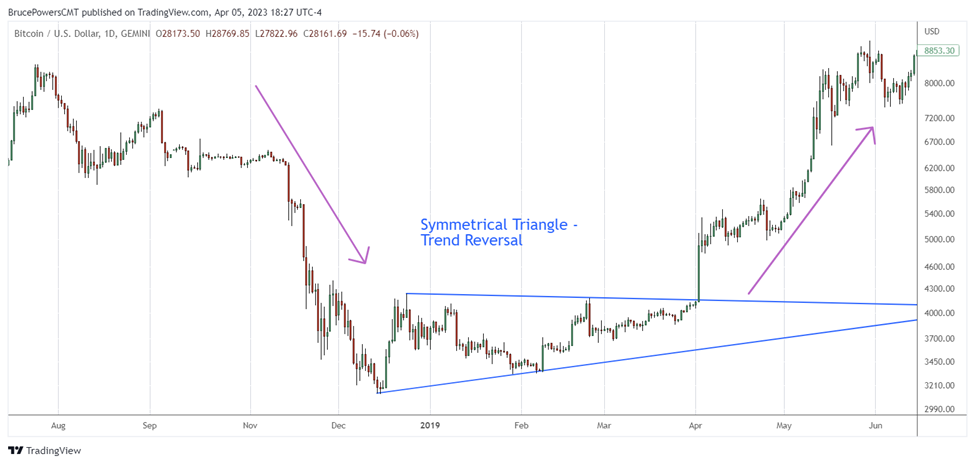
Symmetrical Triangle Reversal Pattern
Primarily, symmetrical triangles are a continuation pattern, but they can also signal reversals.
Below, BTC/USD is in a clear downtrend before consolidating into a symmetrical triangle. Rather than triggering a breakdown and continuing the downtrend, the pair breaks up instead, signaling a bullish reversal.
How to Trade With the Symmetrical Triangle Pattern
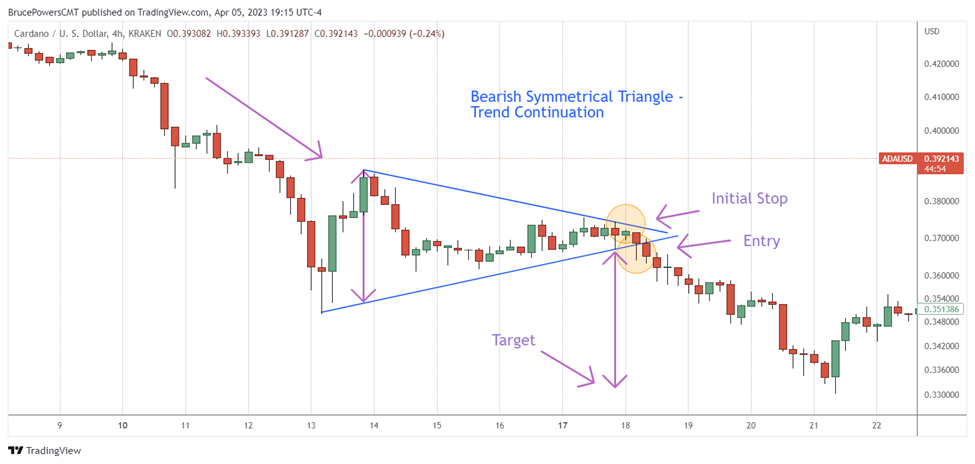
Here we’ll discuss how to create a symmetrical triangle trading strategy by analyzing three scenarios; Bear trend continuation, bull trend continuation and reversal. The trading strategy will encompass an entry trigger, an initial protective stop and a target, which is determined by calculating a measuring objective from the pattern structure. This is achieved by measuring the vertical distance between the bottom and top lines where the lines begin, and then adding or subtracting that price range from the breakout level.
Bear Trend Trading Strategy
The following 4-hour chart depicts a bearish symmetrical triangle strategy for ADA/USD. The initial direction is downward, indicating an expected continuing downtrend. Enter at $0.3672, slightly below the lower trend line at $0.3682 where the price has broken down. An initial protective stop is placed above the top trend line at $0.3745, as a rally above that line means the outlook is no longer bearish. The measuring objective is around $0.0359 ($0.3888 – $0.3529). That value is then subtracted from the breakdown price of 0.$3682 to arrive at an initial minimum target of $0.3323.
Bull Trend Trading Strategy
Next, let's examine a bullish symmetrical triangle chart pattern, where the trend is initially upward before formation. The entry point is $0.5020, slightly above the breakout level of $0.5015 at the top trend line. Meanwhile, the initial protective stop is set at $0.4834, just below the bottom trend line. If the price drops below this level, the pattern is no longer bullish. Finally, the measuring objective value of $0.0284 ($0.5055 – $0.4771) is added to the breakout level of $0.5015, resulting in an initial target of $0.5299.
Trend Reversal Trading Strategy
The example below illustrates a bullish reversal for BTC/USD. The entry is set at $4,150, which is $2.00 above the trend line at the top border of the pattern ($4,148). The measuring objective is around $1,055 ($4,238 – $3,183), which is then added to the breakout level of $4,148 to reach a minimum target of $5,203.
Differences Between a Symmetrical Triangle and Pennant
To effectively trade using this pattern, traders need to understand the differences between the symmetrical triangle chart pattern and the pennant chart pattern. Despite their visual similarities, a symmetrical triangle is larger than a pennant, and usually takes more than three weeks to form. In contrast, the pennant is shorter in duration, developing in up to three weeks. In addition, the pennant is preceded by a sharp rally or decline, while the symmetrical triangle simply requires a trend, and not necessarily an aggressive one.
While both patterns fall under the trend continuation category, the symmetrical triangle can also indicate a potential reversal. The symmetrical triangle employs the triangle's structure to establish a target, whereas the pennant measures the sharp trend that occurs prior to the pattern's formation.
Advantages and Limitations of the Symmetrical Triangle Pattern
The symmetrical triangle pattern can be useful, but it has some limitations for traders to be aware of. Using the pattern in the proper context — and combining it with other technical analysis tools — is essential in order to make more informed trading decisions.
ADVANTAGES | LIMITATIONS |
Predictive ability of future price movement | May provide false signals; breakouts can fail |
Clear entry and exit points | Traders may identify the pattern differently with slight variations |
Can provide a good risk/reward ratio, as price levels are clear | Practice is needed to successfully identify the pattern |
Used in order to confirm an existing trend | Not as accurate in choppy markets |
Price target can be estimated | Let’s look at a few ways to counter the limitations. |
Identify false breakouts. What happens following a breakout can have a lot to do with the quality of the trend prior to the triangle’s formation. A clear, strong trend with improving volume and sustained momentum, either upward or downward, enhances the likelihood that the trend will continue following a breakout. Trend indicators such as moving averages can assist in determining the trend's quality and in drawing accurate trend lines.
Use multiple time frames. Using multiple time frame analysis will help. If the monthly, weekly and daily charts are all heading in the same direction, and the daily is your primary time frame, the chance of the price continuing as anticipated is greater. Higher time-frame charts inform lower time frames.
Study chart history. Improve your ability to identify symmetrical triangle patterns and discern variations with constant practice. Study price history on charts. Draw the pattern wherever it’s found, and study what happened both before and after.
Don't use it in choppy markets. Only use symmetrical triangle patterns in clearly trending markets. No matter how expert a trader is, choppy markets are challenging. Avoid them in order to thwart heavy losses.
The Bottom Line
In conclusion, the symmetrical triangle pattern is a popular technical analysis tool that crypto traders can use to estimate future price movements. The pattern provides clear entry and exit points, and can help traders establish a favorable position. However, the pattern also has limitations, including false breakouts and subjectivity, and it may not work well in all market conditions.
As with any technical analysis tool, using the symmetrical triangle pattern in conjunction with other indicators is vital. By appropriately using the symmetrical triangle pattern, you can make informed trading decisions — and profit in volatile crypto markets.
Candlestick Patterns Professional Traders Use
Best Candlestick Patterns— A curated list of candlestick patterns most frequently used by traders
How to Read Candlestick Charts in Crypto— Learn the basics of candlestick patterns
Crypto Chart Patterns (Chart basics: Trend, neckline, wedges)
Doji Candlestick— Basic candlestick unit
Bullish candlestick patterns:
Bearish candlestick patterns:
Other candlestick patterns:
Harami Candlestick — Features both bullish and bearish candlestick
Hammer Candlestick — Features both bullish and bearish candlestick
Double Top and Bottom — Features both bullish and bearish candlestick
Spinning Top Candle — Features both bullish and bearish candlestick
Marubozu Candlestick Pattern — Features both bullish and bearish candlestick
Tweezer Top and Bottom Pattern — Features both bullish and bearish candlestick
Continuation Patterns — Determining a continuing trend
#Bybit #TheCryptoArk
