
Pin Bar Strategy Mastery: Unlocking Market Opportunities

If you're an active trader or investor in the cryptocurrency market, it's essential to understand various price patterns that can help you make informed trading decisions. One such pattern is the pin bar, one of the most popular candlestick patterns technical analysts use to identify potential trend reversals in the market. In this guide, we’ll delve into the nuances of the pin bar pattern, explore its variations and how to spot it on charts, and discuss various pin bar trading strategies.
Key Takeaways:
The pin bar is a reversal pattern characterized by a long tail or wick and a small body.
A bullish pin bar indicates a potential reversal from a downtrend to an uptrend, while a bearish pin bar suggests a possible reversal from an upward to a downward trend.
Strategies such as the Pin Bar Combo Pattern, Double Top/Bottom and Moving Average Bounce/Rejection can be used to enhance the accuracy of pin bar trading.
What Is a Pin Bar?
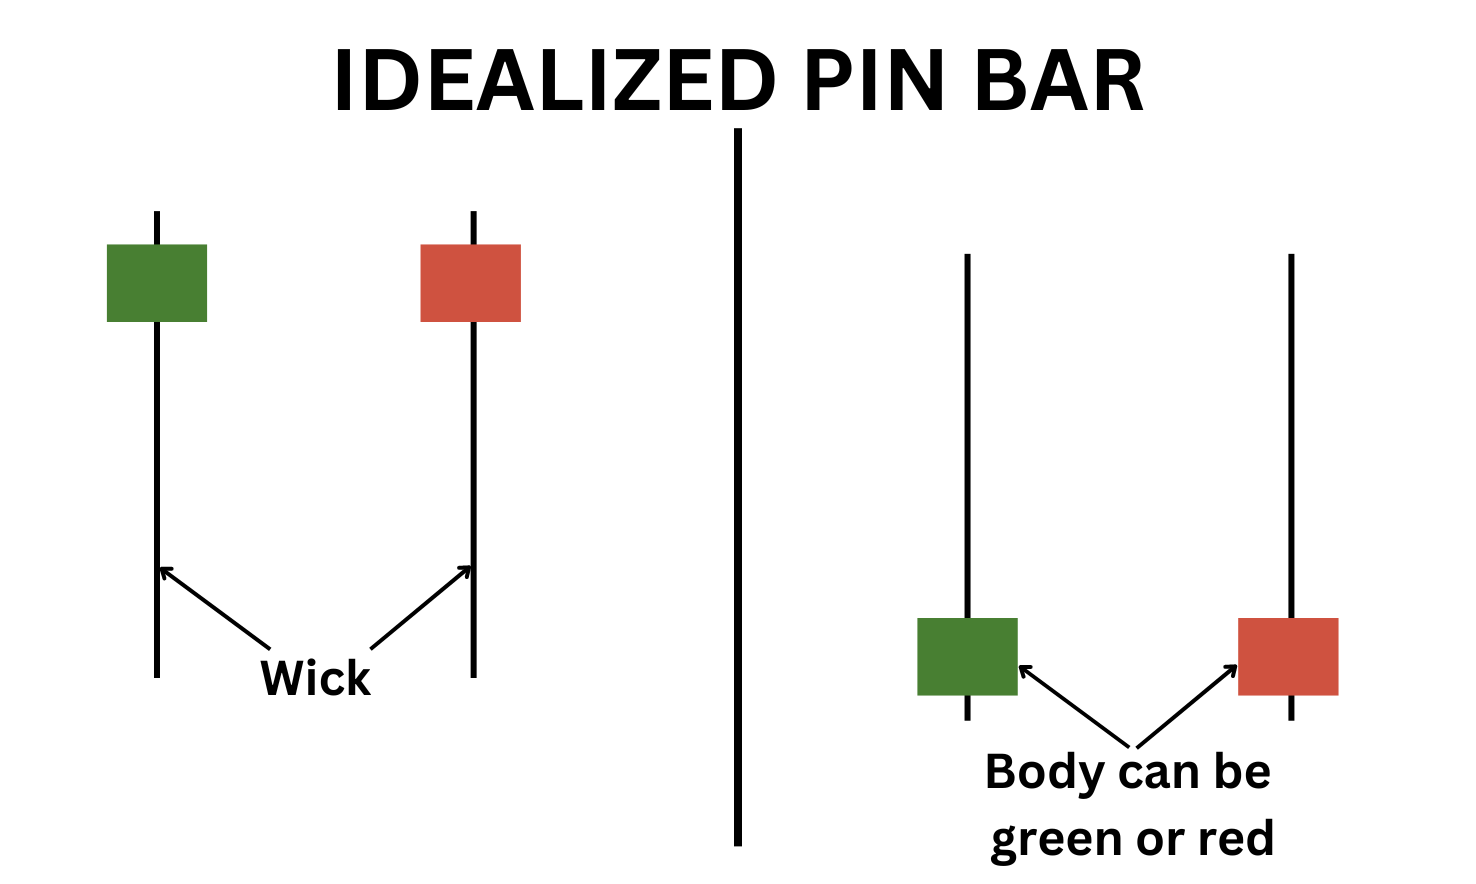
Also known as a Pinocchio Bar, a pin bar is a single candlestick pattern consisting of a long wick or tail and a small body. A distinctive characteristic of a pin bar is that the tail extends beyond the surrounding price action, creating a pin-like appearance.
The pin bar candlestick pattern can be found on any financial chart, within any time frame, and is generally considered a reversal pattern.
Bullish Pin Bar
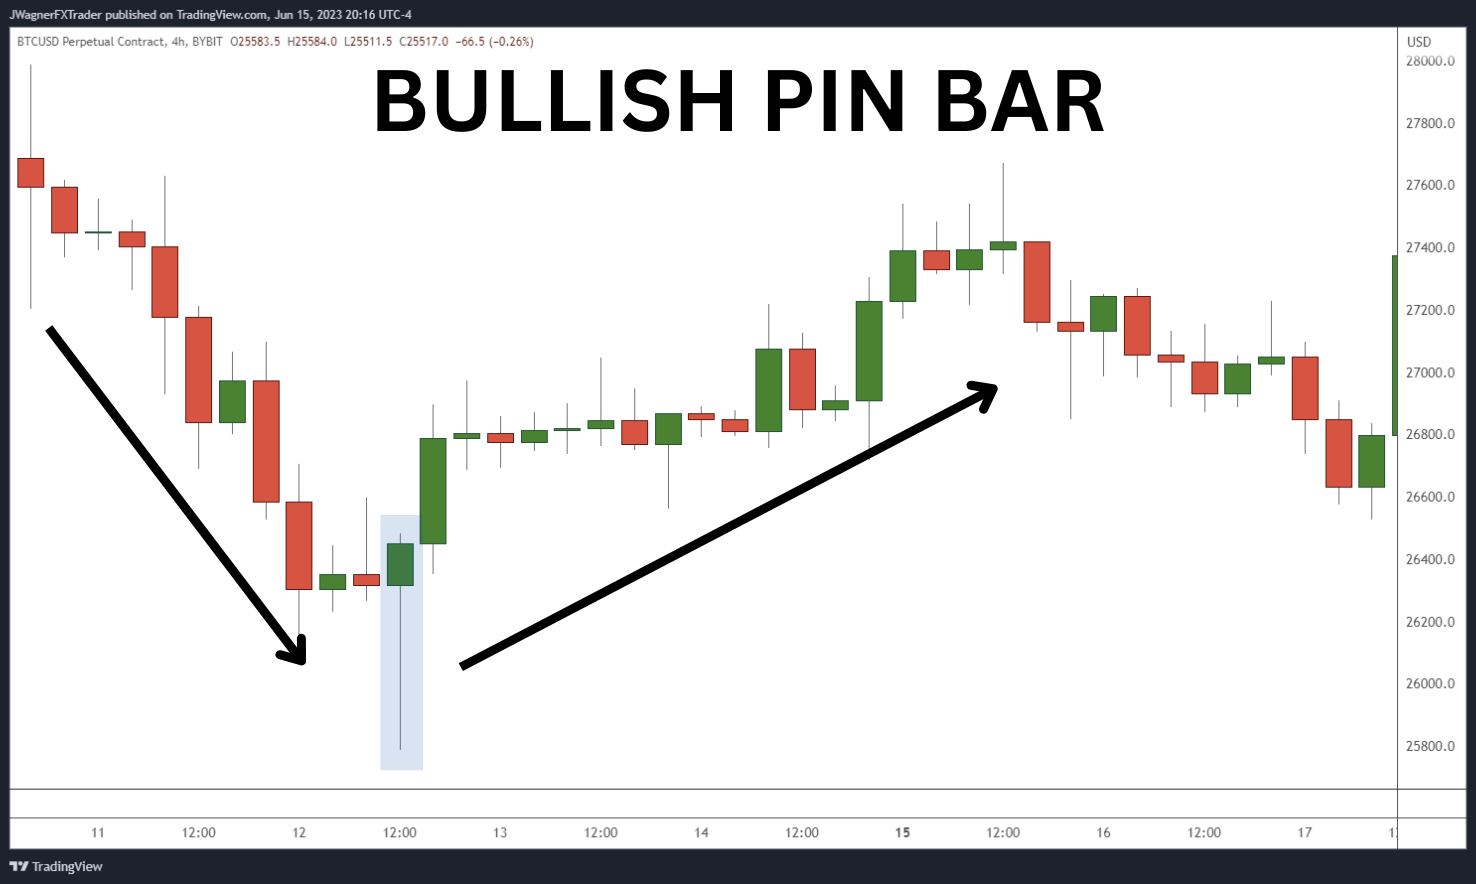
A bullish pin bar occurs when opening and closing prices are near the top of a candle's range, with a long lower tail extending beyond the recent price action. The above illustration represents a pin bar reversal that’s changing the trend from downward to upward. In this example, the lower pin bar tail indicates that sellers initially pushed the price lower, but buyers regained control, driving the price back up. The closing price of the candle appears near the opening, creating a small body.
Traders often interpret this price action as a bullish signal, indicating a shift in market sentiment. It suggests that buyers are stepping in, and the price may therefore continue to rise. The signal from a bullish pin bar is stronger when the tail or wick temporarily breaks a technical level of price support.
Bearish Pin Bar
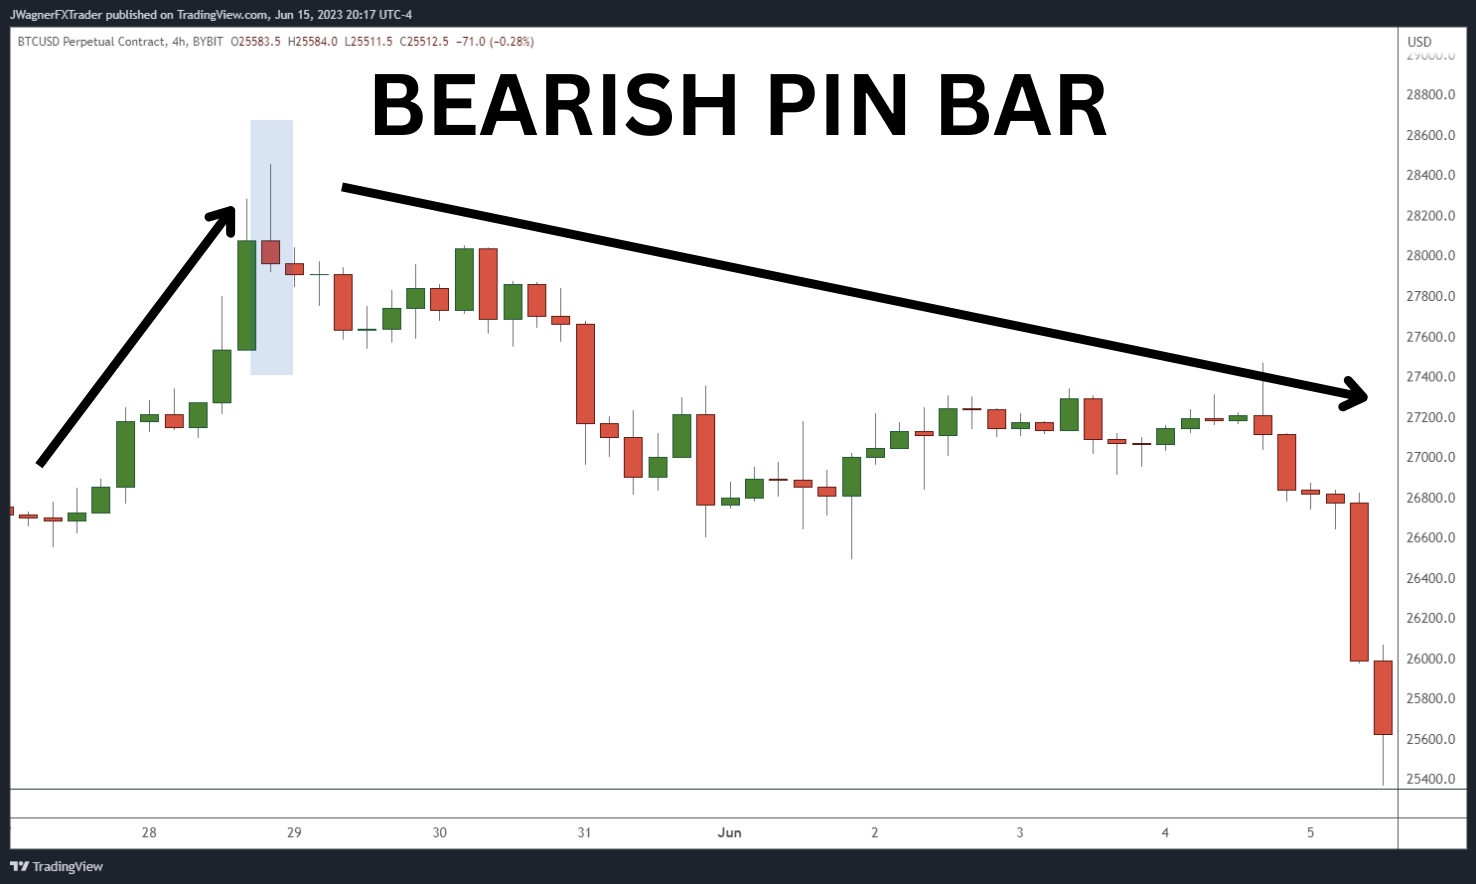
On the other hand, a bearish pin bar forms when the opening and closing prices are near the bottom of the candle's range, with a long upper tail extending beyond recent price highs. This pattern indicates a potential reversal from an uptrend to a downtrend. The long upper tail suggests that buyers initially pushed the price higher, but sellers took control, driving the price back down to close near the low of the candle.
Traders view this price action as a bearish signal, suggesting a potential decrease in price. It indicates that sellers are gaining strength, and the market sentiment may turn bearish.
As with any candlestick pattern, it's important to consider additional factors, such as support and resistance analysis, to confirm a potential reversal signaled by a bearish pin bar.
Types of Pin Bars
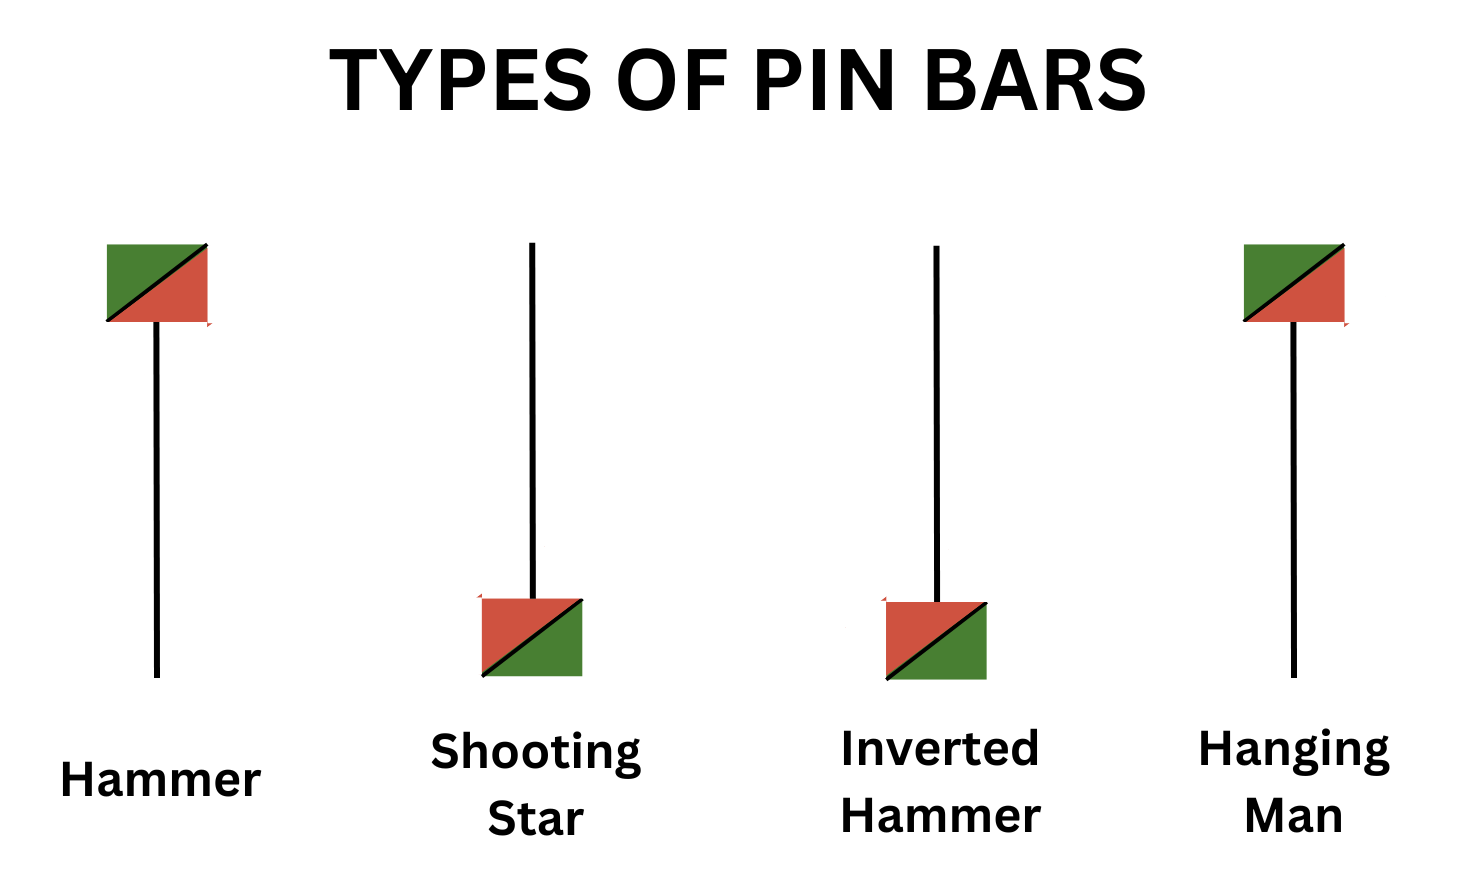
There are four different types of pin bar candlestick patterns.
Hammer
A hammer candlestick pattern is a bullish pin bar with a small upper body and a long lower wick, resembling a hammer. It signifies a potential trend reversal from a downtrend to an uptrend. The long lower wick indicates a brief period during which sellers were in control, only to be outmatched by buyers later on. This pattern is a strong bullish signal, and is viewed as a potential buying opportunity.
Shooting Star
Resembling a meteor falling from the sky, the shooting star candlestick pattern is a bearish pin bar with a small lower body and a long upper wick. The pattern signals the potential for a bearish trend reversal from an uptrend to a downtrend. The long upper wick indicates that buyers temporarily pushed prices to a new high, only for sellers to take over and press the price back down. This pattern is an indication for a trader to consider closing long positions, or entering new short positions.
Inverted Hammer
The inverted hammer candlestick pattern is bullish and looks very similar to a shooting star, but with one major difference: the inverted hammer appears after a downtrend, while the shooting star appears after an uptrend. The inverted hammer has a long wick to the upside, but the wick might not protrude above the previous candle. This pattern implies that prices have attempted to rally, but haven’t had enough strength, and have been pushed back down by sellers.
Hanging Man
The hanging man candlestick pattern is a bearish pin bar, similar to a hammer pattern. The main difference between it and the hammer is that a hanging man pattern forms after an uptrend, frequently near resistance, signaling a shift in sentiment from bullish to bearish. On the other hand, the hammer forms after a downtrend, and possibly near support.
How to Spot a Pin Bar Pattern
Understanding the nuances of the pin bar will help you spot and interpret the pattern. Identifying a pin bar is fairly straightforward, since it’s a single-candle pattern. The pattern can be found in any tradable market, whether crypto, forex, stocks, indices or commodities, and can be seen on all chart time frames.
Fortunately, there are two easily identifiable features to this pattern.
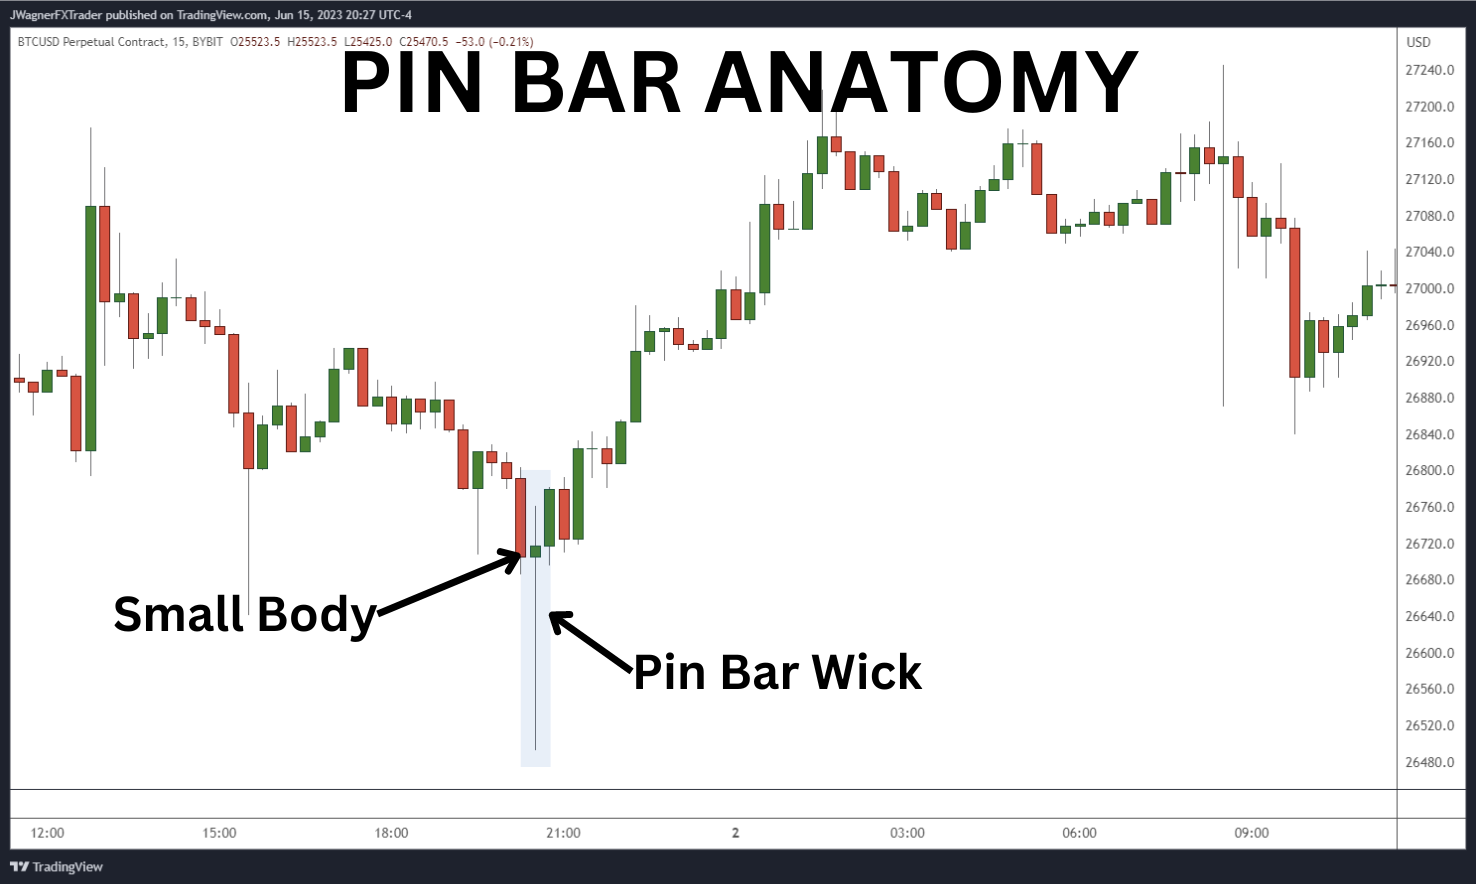
Look for a long tail: A pin bar is characterized by a long tail or wick that often protrudes from the surrounding price action. This tail should be at least two times the length of the candle's body.
Identify the small body:The body of the pin bar is relatively small and is located at one end of the candle. It represents the opening and closing prices, which are typically close to each other.
How to Trade With Pin Bars
Trading pin bars is fairly straightforward. A successful trader will begin trading only after the pin bar setup develops, based on the following checks.
Check the position of the tail: Stronger pin bar reversals form in the direction opposite from the tail. In a bullish pin bar trade, the long tail extends beyond the lower side of the body, while in a bearish setup, the tail extends above the body. The pin should be prominent and noticeable.
Consider the context: A pin bar setup is most effective at key support or resistance levels, trend lines or Fibonacci retracement levels. Look for these areas to increase the reliability of a pin bar reversal.
Analyze volume: While not a requirement, observing volume during the formation of a pin bar can be helpful. An increase in volume can further confirm the validity of the pin bar reversal.
Seek confirmation: To further enhance the reliability of the pin bar reversal pattern, consider using additional technical indicators or price action patterns. Additionally, signs of bullish or bearish divergence, trend line breaks or other reversal pattern signals will help.
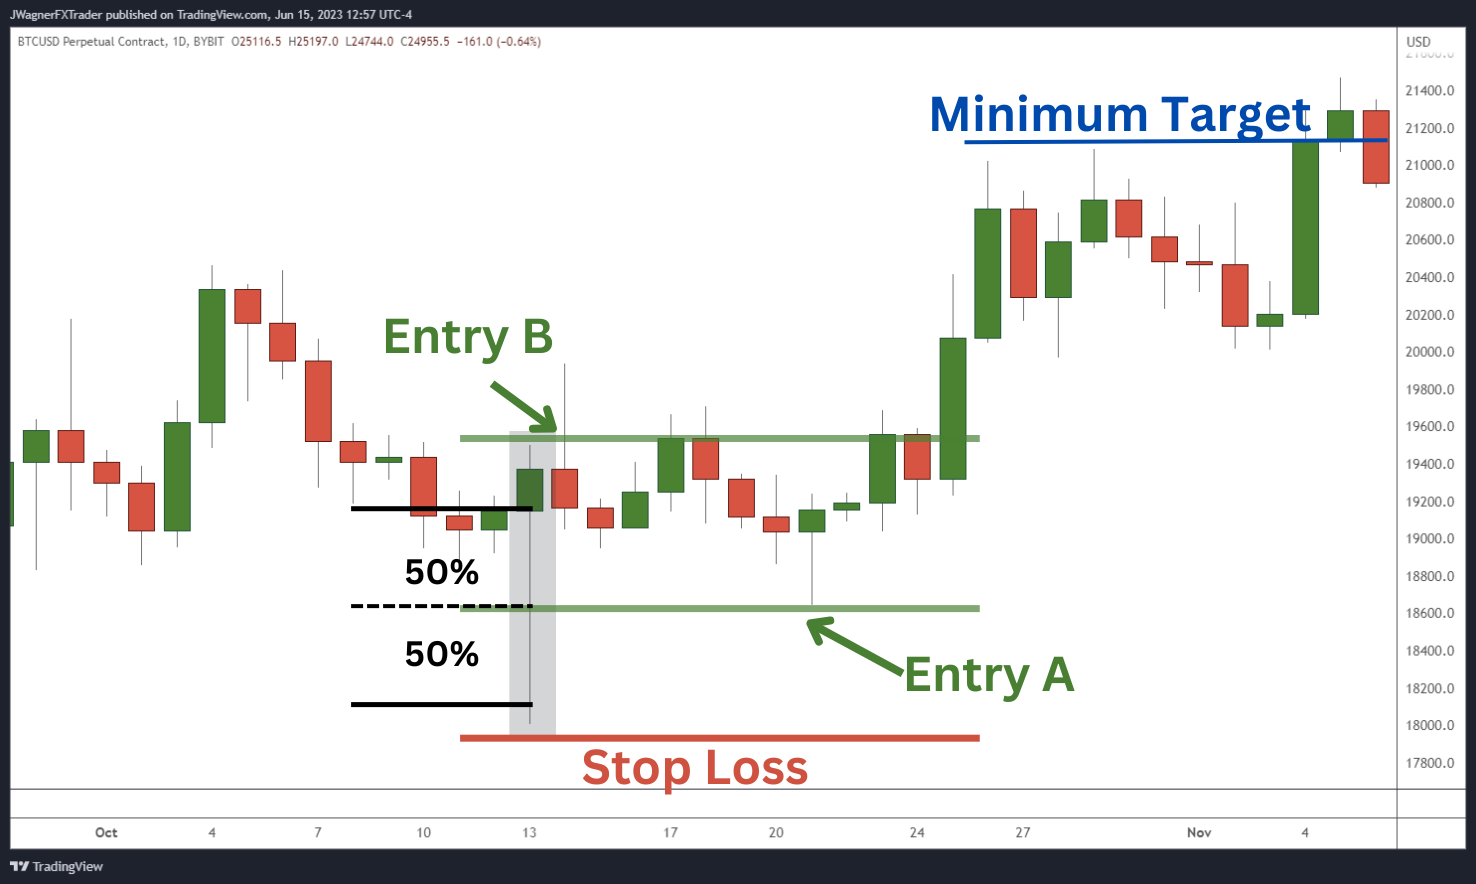
In the Bitcoin example above, a pin bar is spotted near a key support level. An effective pin bar trading strategy would be to wait for the price to retrace about half the distance of the wick.
A trader can buy near the 50% retracement of the wick, or simply wait for a breakout and place a buy stop above the pin bar’s high.
The stop loss would be placed just below the pin bar low. The minimum take-profit target would be at the same distance as the height of the entire pin bar.
Pin Bar Trading Strategies
Now that you’re familiar with the pin bar, it’s best to incorporate it with other technical analysis tools and chart patterns in order to improve its accuracy. To trade pin bars, consider the following strategies.
Pin Bar Combo Pattern
While the pin bar is one of many reversal patterns, an inside bar is a continuation pattern. Coupling the pin bar with a continuation pattern like the inside bar creates a powerful combination. Essentially, the pin bar is the mother bar of the inside bar pattern.
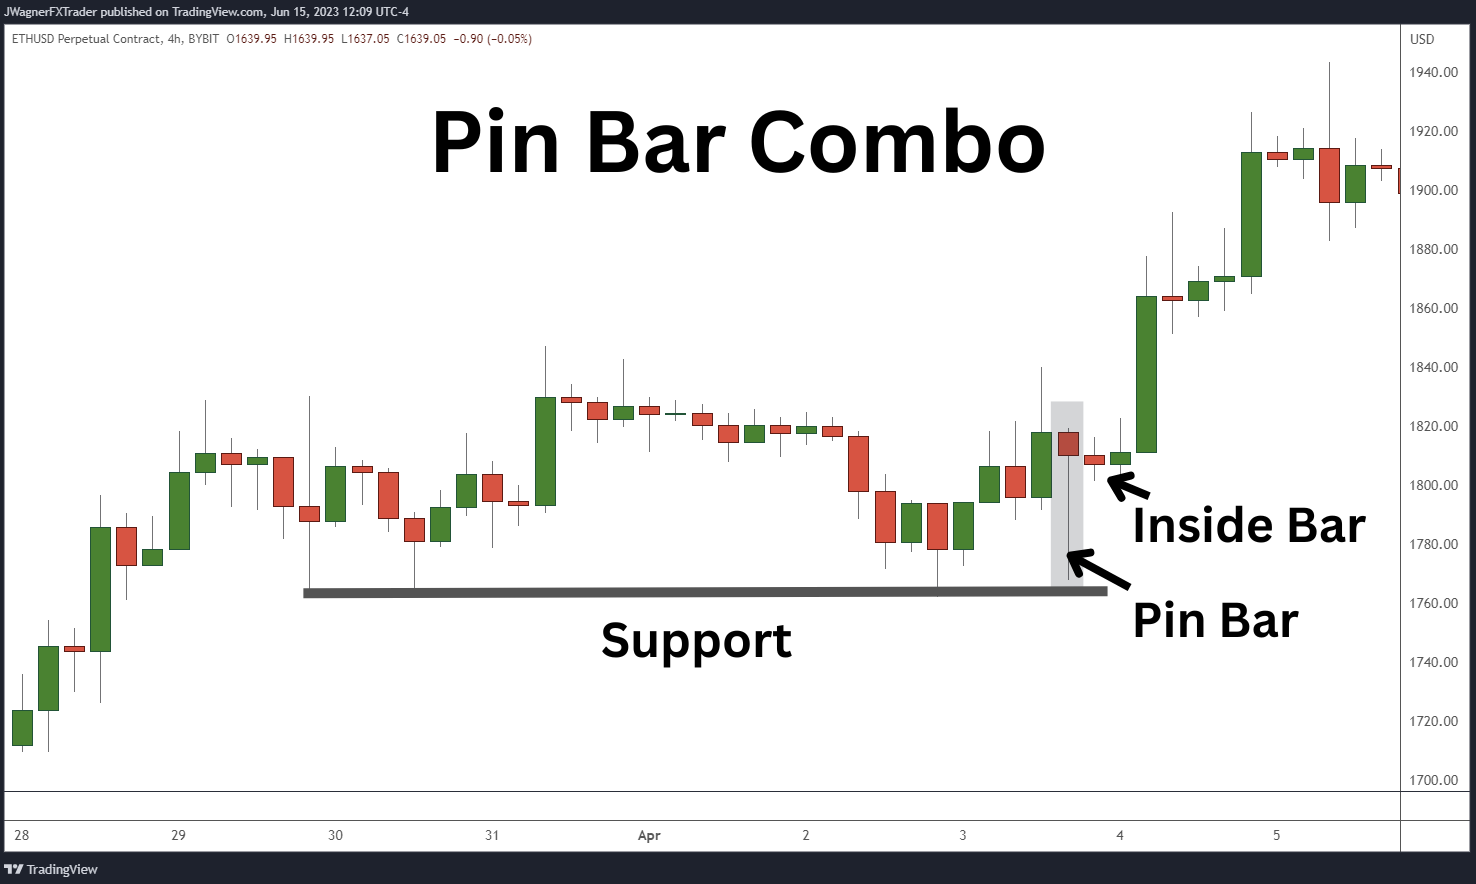
Above, we can see how the price of Ethereum is pressing lower while the low point of the pin bar coincides with a key price level. After the pin bar, an inside bar forms. This combination of pin bar and inside bar suggests a potential reversal, with the price attempting to bottom and an upward price movement expected to follow. Subsequently, a few candles later, the price breaks higher to the upside.
Double Top/Bottom Strategy
This trading strategy is indicated by a pin bar inside a double top or bottom pattern.
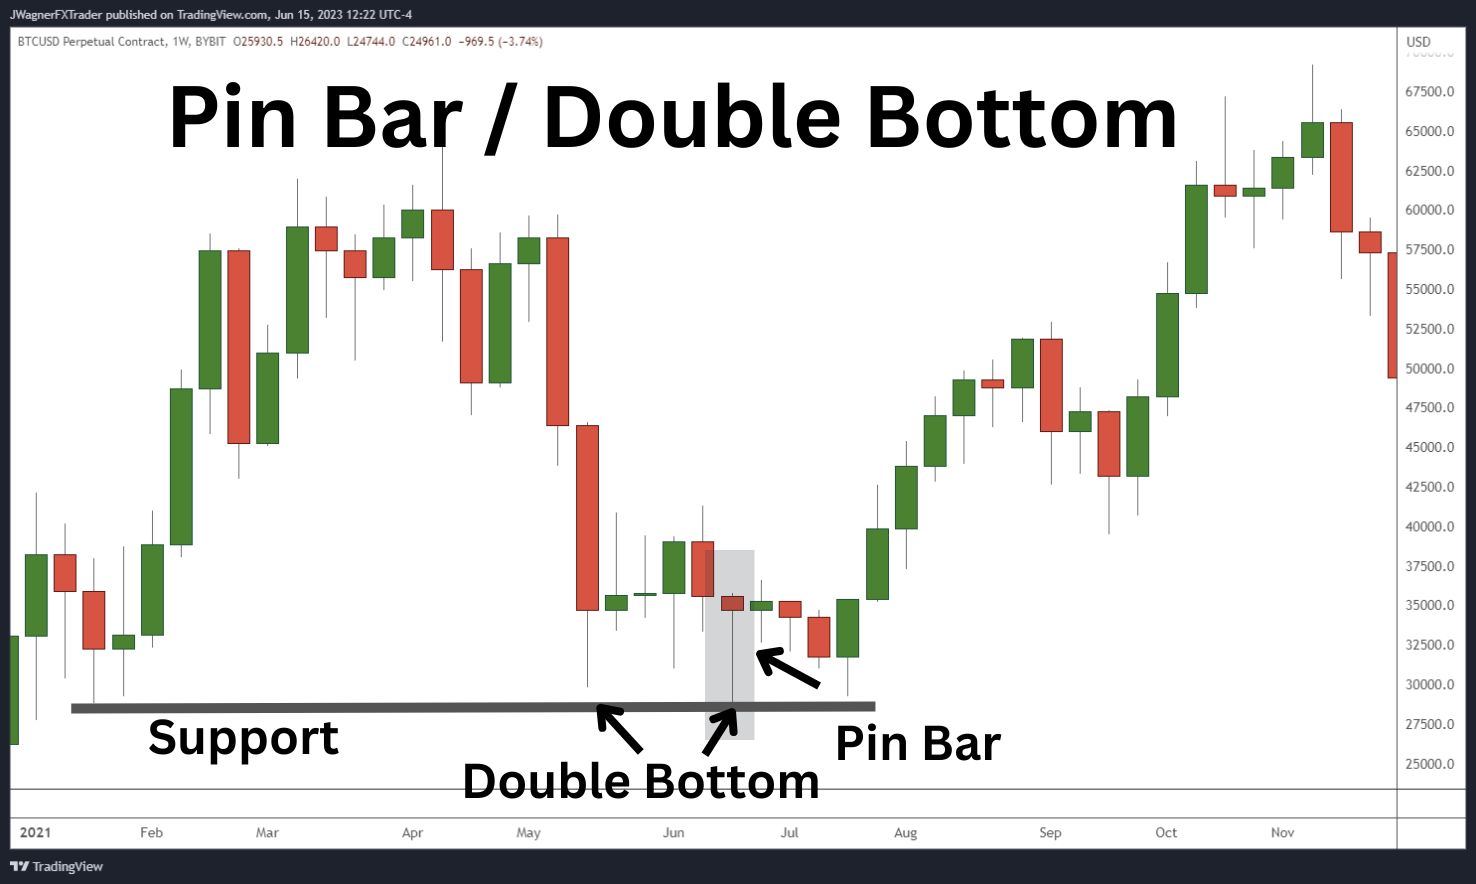
In the Bitcoin example above, you can see strong support near $30,000. After a strong bearish candle, Bitcoin tests this support in May 2021. Then, a couple of weeks later, it retests $30,000 again and drafts a weekly pin bar candlestick pattern. This is a signal that buyers are defending and supporting the price. That double bottom with a pin bar kicks off a new trend, pushing Bitcoin up to $69,000.
Moving Average Bounce/Rejection Strategy
Another pin bar trading strategy is to couple it with a moving average, which can act as both support and resistance key levels for the price.
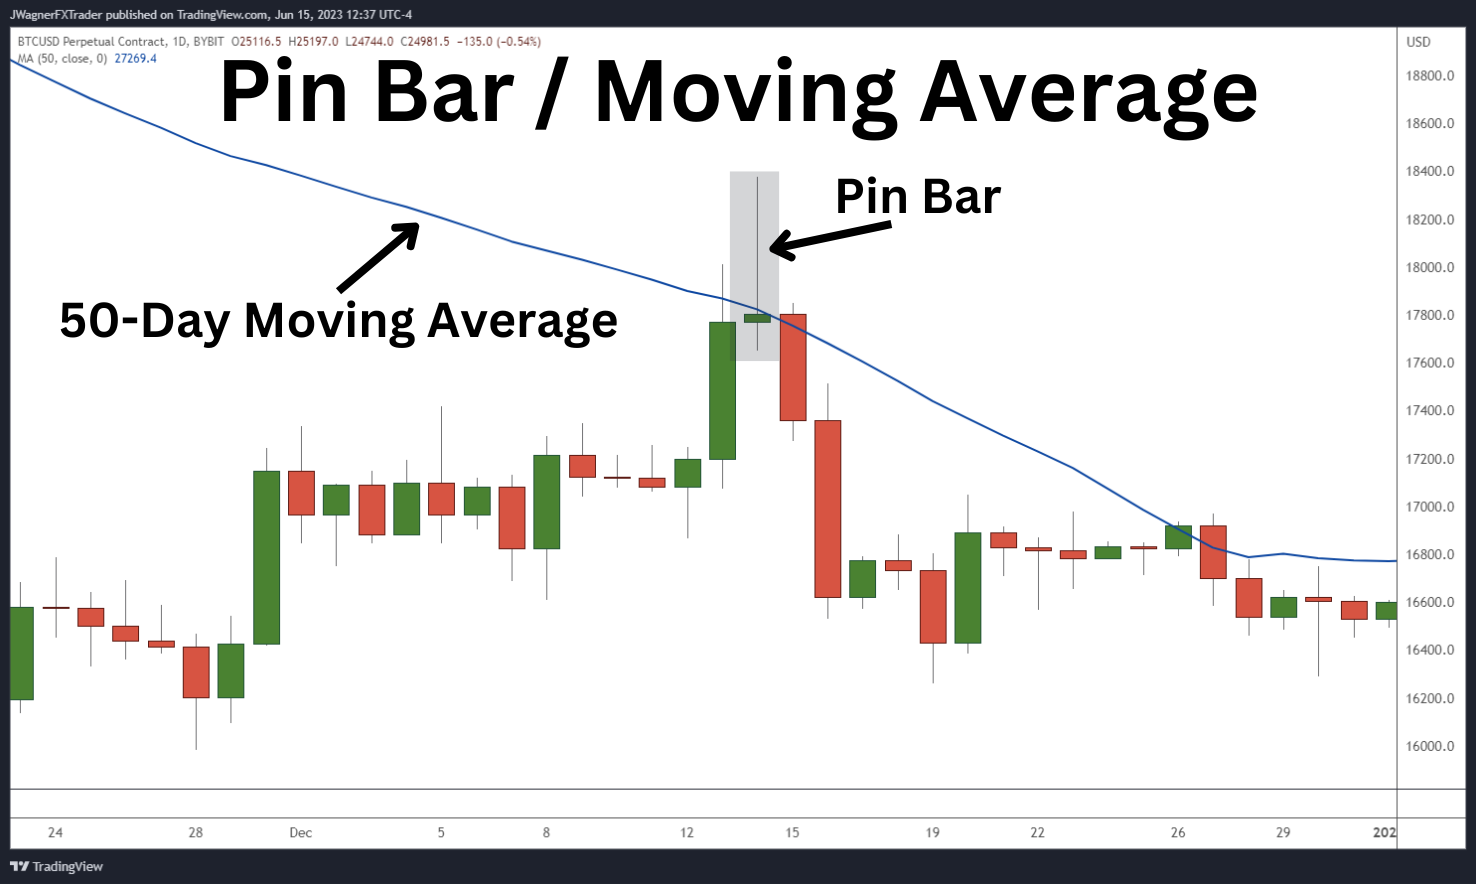
On the Bitcoin chart above, we’ve placed a 50-day simple moving average. Bitcoin rallies to the moving average, forming a false break higher and drafting a bearish pin bar. This is a strong signal that sellers are still overwhelming buyers, causing the price to fall by about 8%.
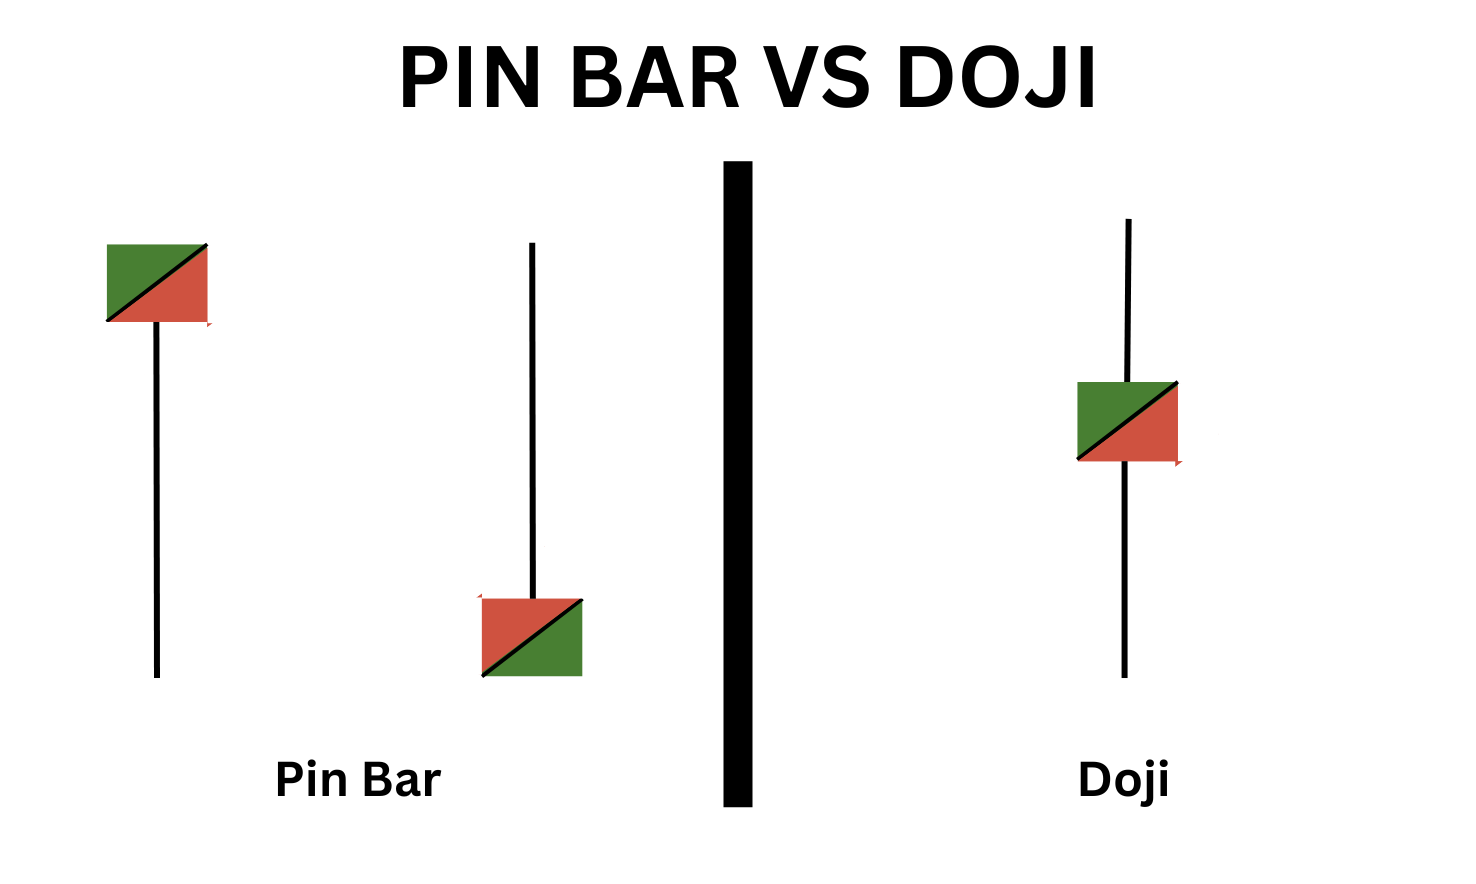
Pin Bar vs. Doji
Two commonly encountered candlestick patterns that are easy to confuse are the pin bar and the doji. From a distance, there are similarities. For example, both patterns are single candle patterns in which the closing price of the candle is near the opening price.
Although they share some similarities, they have distinct characteristics that traders must understand to better anticipate the market’s next move. Let's explore the differences between the two.
The first main difference is that the closing price will be shifted toward the top or the bottom of the pin bar candlestick, whereas in the most commonly used doji, the long-legged doji, the body will be located in the middle. Note, however, that there are several types of doji. Two of them — the dragonfly doji and the gravestone doji — have the same highs and lows as the bullish and bearish pin bars, respectively. Hence, these dojis can be considered as pin bars.
The next difference is in the length of the wick. A pin bar’s wick will be noticeably longer than the wicks of the other candles on the chart. On the other hand, the typical doji will have a wick protruding from the top and bottom, and doesn’t need to be exceptionally long.
Lastly, the resulting trend after the pattern is completed is different. Dojis reflect indecision in the market, and suggest a potential reversal or a period of consolidation. It simply depends upon their location and context within a chart.
Pin bars emphasize the rejection of price levels, indicating the existing direction of the trend is reversing. They can be more easily interpreted than a doji, which requires further context of a chart’s analysis in order to anticipate the next trend.
Advantages and Limitations of the Pin Bar Pattern
The pin bar pattern is easily recognized by traders in financial markets. Though it offers several advantages, there are a few limitations for traders to be aware of when incorporating it into their strategies. Below, let's explore both the advantages and limitations of the pin bar pattern.
Advantages
Clear Reversal Signals: Pin bars provide clear and visually recognizable reversal signals. The long tail indicates a firm rejection of price levels and potential exhaustion of the prevailing trend.
Confluence With Support/Resistance: Pin bars are particularly effective near significant support or resistance levels, trend lines or Fibonacci retracement levels. These confluence areas increase the probability of trend reversals.
Flexibility on Markets and Time Frames: Pin bars are visible on any liquid financial market, and in any chart time frame. This makes them a favorite among day traders, swing traders and position traders.
Limitations
False Signals: Like any technical indicator or pattern, pin bars aren’t foolproof. False signals can occur, especially in volatile or choppy market conditions. Traders are advised to use additional confirmation tools and techniques to validate pin bar signals.
Inability to Predict Market Conditions: Pin bars alone cannot predict future market conditions. They provide information about potential reversals, but they don’t offer certainty about the direction or strength of future trends.
Limited Application in Sideways Markets: Pin bars are most effective in trending markets, particularly when they occur near significant support or resistance levels. In sideways or range-bound markets, pin bars may produce mixed or less reliable signals, making them less effective.
The Bottom Line
Incorporating the pin bar pattern into your trading strategy can provide valuable insights into potential trend reversals and market sentiment. While the pattern offers clear advantages, such as being easy to spot, be mindful that it’s best utilized in a trending market. By combining the pin bar pattern with other technical indicators and thorough analysis, traders can enhance their decision-making process in order to maximize their outcomes.
Candlestick Patterns Professional Traders Use
Best candlestick patterns — A curated list of candlestick patterns frequently used by traders
How to Read Candlestick Charts in Crypto — Learn the basics of candlestick patterns
Crypto Chart Patterns — (Chart basics: Trend, neckline, wedges)
Doji Candlestick — Basic candlestick unit
Bullish candlestick patterns
Bearish candlestick patterns
Other candlestick patterns
Harami — Both bullish and bearish
Hammer — Both bullish and bearish
Double Top and Bottom — Both bullish and bearish
Spinning Top — Both bullish and bearish
Marubozu Candlestick — Both bullish and bearish
Tweezer Top and Bottom — Both bullish and bearish
Continuation Patterns — Determining a continuing trend
Symmetrical Triangle — Both bullish and bearish
Inside Bar — Both bullish and bearish
#Bybit #TheCryptoArk
