
Long-Legged Doji Candlestick: What Does It Mean?

The long-legged doji, a Japanese candlestick pattern, is a potent tool in the arsenal of technical traders that symbolizes market indecision. Over the next few minutes, we’ll review how to identify and trade the pattern, and see how it compares to other doji structures.
Key Takeaways:
The long-legged doji candlestick's most remarkable trait is its power to depict market uncertainty, illustrated by its large upper and lower shadows.
It offers an effective means for precise stop-loss placement, leading to favorable trading opportunities with a strong risk-to-reward ratio.
The long-legged doji is quite versatile. It has the potential to manifest across various crypto assets and on candlestick charts of any time frame, making it applicable to diverse trading styles: day trading, swing trading and long-term investing.
What Is the Long-Legged Doji?
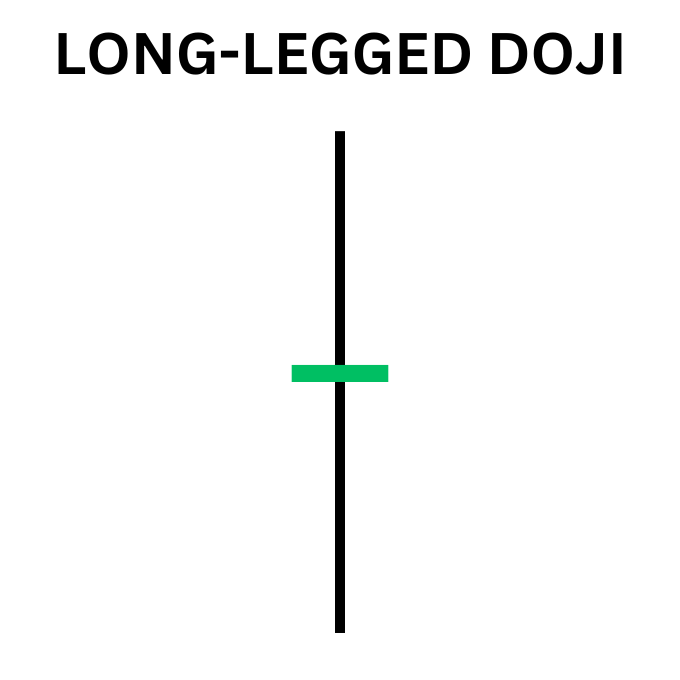
The long-legged doji is a single-bar Japanese candlestick pattern (used in technical analysis) that signals market indecision. The candlestick pattern belongs to the family of doji candles, and derives its name from its distinctive appearance. It consists of a small body situated between long upper and lower shadows (or wicks). Visually, it resembles a cross or a plus sign, representing a state of balance between buyers and sellers.
The long-legged doji indicates a moment of intense market indecision and potential price reversal. Its extended shadows suggest that prices have fluctuated notably during a trading session, yet the closing price is nearly the same as the opening price. This equilibrium signifies a struggle between bullish and bearish forces, a tug-of-war for control over the asset's direction.
As a crypto trader, comprehending the implications of a long-legged doji candle is crucial. The pattern serves as a prominent signal that the prevailing trend might be losing momentum and a price reversal could be in the offering. However, it’s important to observe this pattern within the broader market context and consider other technical indicators before making trading decisions. The long-legged doji pattern is most powerful when it emerges after an established trend, potentially heralding a trend reversal or significant retracement.
How to Identify the Long-Legged Doji
Recognizing the long-legged doji candlestick amidst a myriad of price fluctuations is an essential skill for crypto traders seeking to harness its potential insights. Long-legged doji candles are found on any crypto candlestick chart, and can be spotted on all chart time frames.
To identify this distinctive candlestick pattern, traders should focus on the following key features.

1. Extended Shadows (or Wicks): The hallmark of the long-legged doji candlestick is its extended upper and lower shadows, making the entire pattern one of the larger ranges visible on the chart. These long wicks demonstrate that prices have experienced significant volatility during the trading period.
2. Small Body: The central body of the long-legged doji candlestick is typically tiny and located in the middle of the overall chart pattern. This signifies that the opening and closing prices are close to each other, implying market indecision.
3. Absence of Color: The candle's color (whether it's filled or hollow) isn’t as crucial in identifying long-legged dojis. It’s more critical to witness a diminutive candle body.
4. Surrounding Trends: To enhance the accuracy of identification, traders should look for the long-legged doji candle in specific contexts. It often appears after a sustained uptrend or downtrend, suggesting potential trend reversal or significant retracement.
Confirmation: While the appearance of a long-legged doji candlestick is a notable signal, traders shouldn’t rely solely on it for decision-making. It's essential to consider other technical indicators, such as trend lines, moving averages and volume to validate a potential reversal.
By mastering the art of identifying the long-legged doji, crypto traders can better anticipate shifts in market sentiment and make more informed trading choices.
How to Trade the Long-Legged Doji
Trading the long-legged doji candlestick requires a strategic approach that considers its unique characteristics and potential implications. The following is a guide on how to effectively trade this candlestick pattern.
First, analyze the context of the larger trend. The emergence of a long-legged doji candle should prompt caution rather than immediate action. You’ll need to wait for the pattern to complete before taking any kind of action. You can use this time to scrutinize the price trends preceding the occurrence of the doji.
Next, look for support and resistance near the high or low of the doji. If the market is in a downtrend and the long-legged doji forms near support, it suggests a potential bullish reversal. On the other hand, if the market is in an uptrend and the doji appears near resistance, it could indicate a potentially bearish reversal.
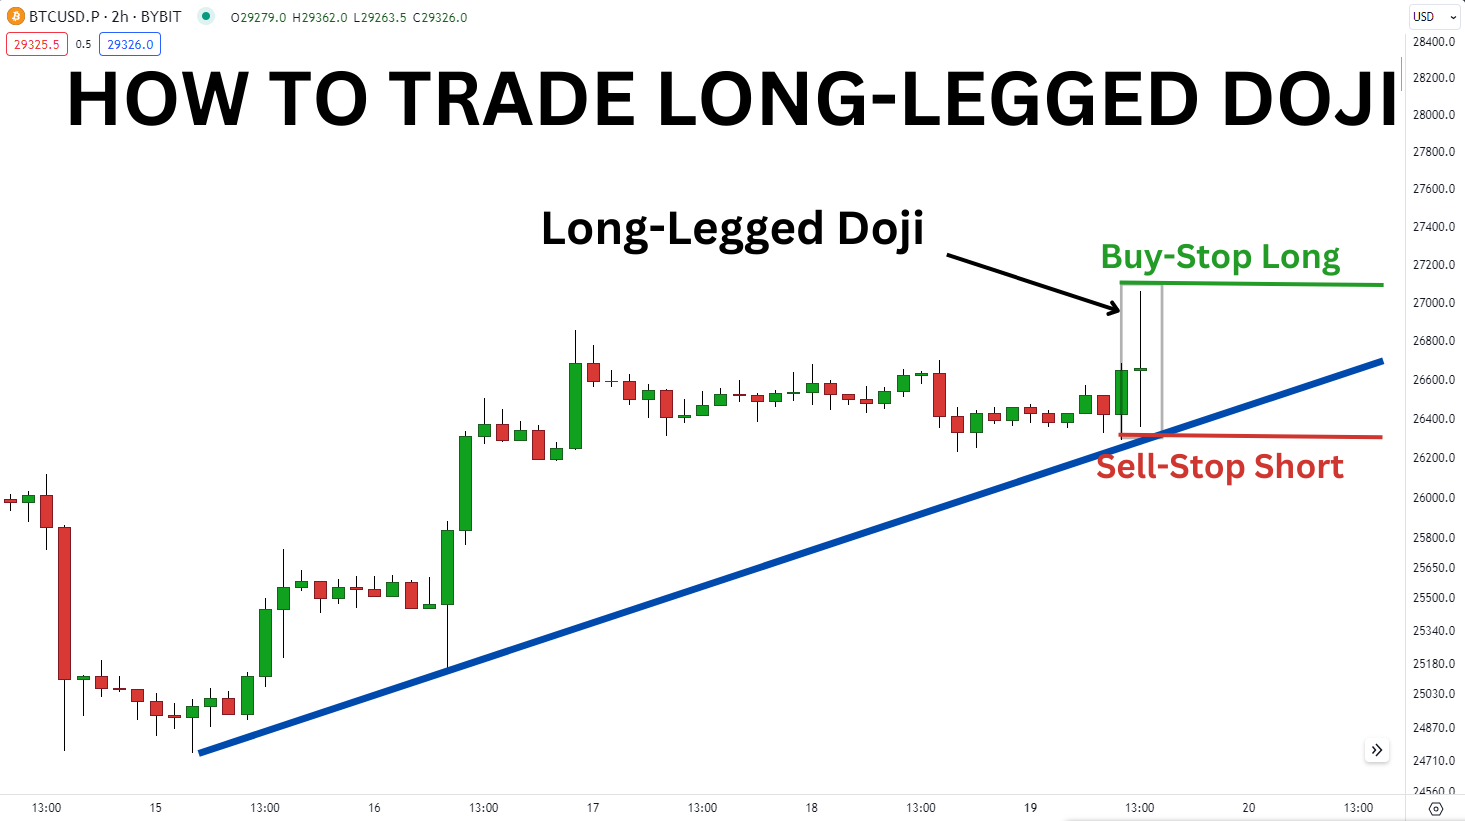
In the chart above, a long-legged doji occurs near a support trend line in the larger trend as prices correct and drift lower. As prices approach this support trend line, the doji appears. This indicates the market acknowledges the support line and is trying to break higher, but doesn’t have enough momentum to breach the support.
Both the high and low of the pattern emerge as significant key levels. If the high is broken, the price will likely continue to rally. If the low is broken, then a larger correction will probably occur.
A trader could place an OCO order (one-cancels-the-other) with a buy stop slightly above the high and a sell stop just below the low. This approach has two potential outcomes: if the price rallies above the high, a trader will enter a long position with a stop loss at the low. Conversely, if the price falls below the low, the trader will initiate a short position with a stop loss at the high. In such situations, it's advisable to aim for a target distance equivalent to your stop loss.
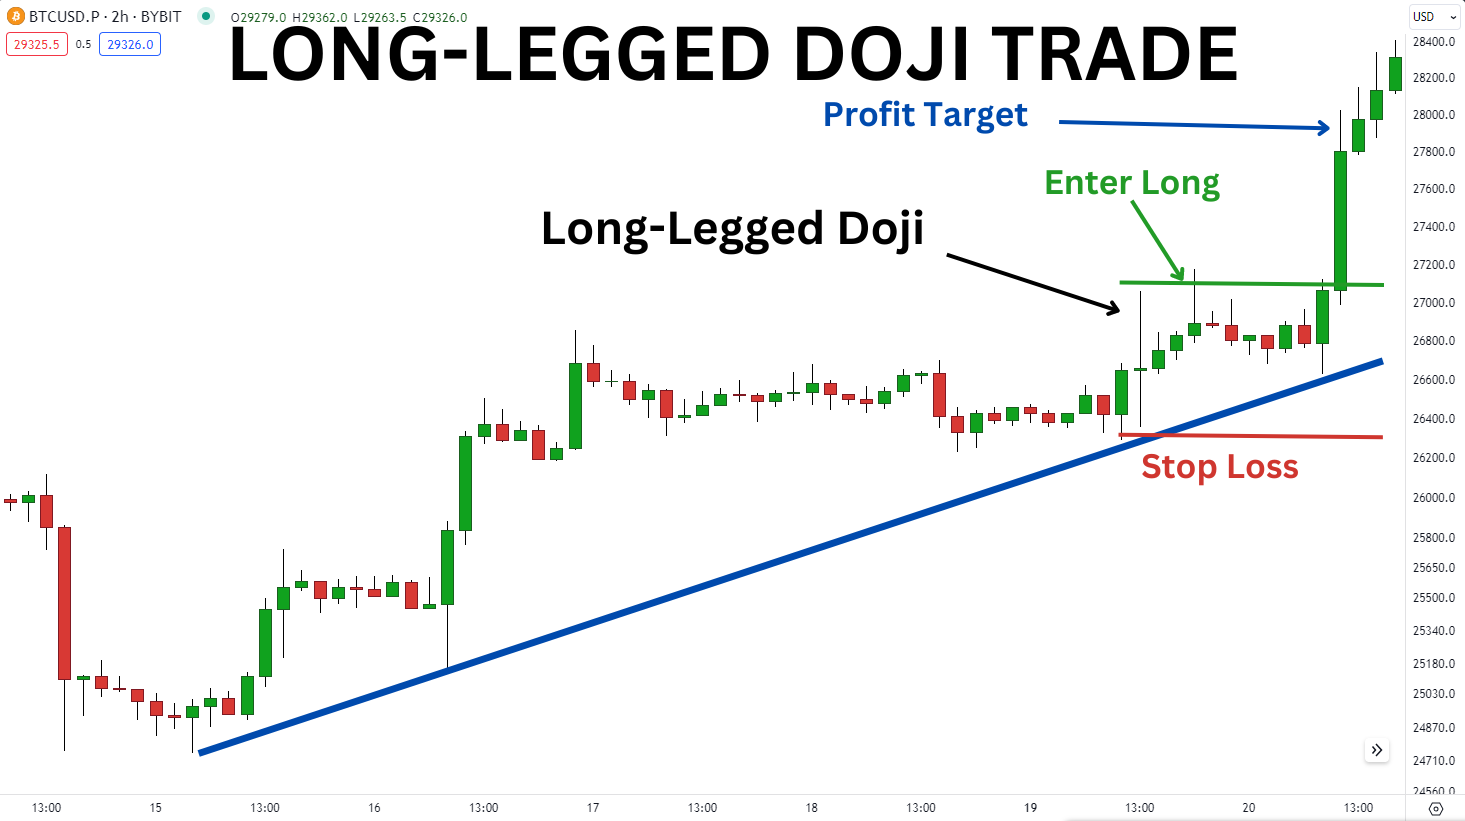
Above, we can see that price eventually rallies and triggers a long position, and Bitcoin exceeds the equidistant target during its rally.
Pros and Cons of Long-Legged Doji
Understanding the advantages and limitations of this candlestick pattern will help you make more informed trading decisions.
Pros
Indication of Market Indecision: The long-legged doji's primary strength lies in its ability to indicate significant market indecision. The long upper and lower wicks imply that both buyers and sellers have had notable influence during the trading period, resulting in a standoff. This can serve as a valuable warning sign for potential trend reversals or trend weakening.
Early Reversal Signal: When the long-legged doji candlestick appears after a sustained uptrend and near resistance, or after a sustained downtrend near support, it can be an early signal of a potential trend reversal. Traders who spot this pattern in the right context may be able to position themselves ahead of a significant market shift.
Versatility in Multiple Time Frames:The long-legged doji's effectiveness isn’t limited to a specific time frame. This pattern can be identified across various time frames, from short-term intraday charts to longer-term daily or weekly charts. Its adaptability allows traders to apply its principles to different trading styles, making it a valuable tool for day traders, swing traders and long-term investors alike.
Cons
Potential False Signals:Like many technical candlestick patterns, the long-legged doji isn’t immune to generating false signals. Market conditions, news events or sudden price spikes can disrupt the pattern's expected outcomes, leading to undesirable trading results.
Need for Confirmation: Relying solely on the appearance of the candlestick pattern can be risky. Traders should seek confirmation from other technical indicators, trend analysis or price action before making trading decisions. This can sometimes delay entry and reduce the immediacy of acting on the pattern.
Subjectivity:Identifying the long-legged doji isn’t always straightforward, as its visual appearance can vary. Traders might interpret its length and proportions differently, potentially leading to differences in analysis and trading decisions.
While this candlestick pattern can offer valuable insights and early signals of potential reversals, traders must remain vigilant, use proper risk management and complement their analysis with other indicators to maximize its effectiveness.
Long-Legged Doji vs. Other Doji Patterns
In the realm of candlestick patterns, the long-legged doji stands out due to its unique characteristics. Understanding the distinctions between the long-legged doji and its counterparts can help a trader make more informed decisions.

Compared to the classic doji pattern, which has relatively even upper and lower wicks, the long-legged doji boasts more elongated wicks, signifying heightened volatility and uncertainty. This distinction underlines the long-legged doji's potential to indicate more substantial market shifts.
Unlike the dragonfly doji and gravestone doji, which have long lower and upper shadows respectively, the long-legged doji takes a balanced stance, showcasing equilibrium between bulls and bears. This intermediate position often implies a more intense struggle for control, capturing traders' attention and hinting at possible trend reversals.
In contrast to the four-price doji, where the open, close, high and low prices align at the same level, the long-legged doji features extended wicks at both top and bottom.The four-price doji simply means the market is dead with little price movement, whereas the long-legged version suggests a struggle between buyers and sellers.
By distinguishing the long-legged doji from these other doji patterns, crypto traders can better understand market sentiment and devise well-informed trading strategies. While the long-legged doji signifies uncertainty and potential trend shifts, juxtaposing it with other doji formations helps traders validate its significance within the broader context of price action and technical analysis.
The Bottom Line
Incorporating the long-legged doji into a trader's tool kit is akin to having a market oracle that deciphers uncertainty and foretells potential market shifts. Its visual language, marked by elongated shadows and a petite body, speaks volumes about buyer-seller equilibrium. Yet, as with any strategy, traders must wield this pattern judiciously, mindful of its potential and limitations, and bolster it with supplementary indicators to illuminate their path in the crypto market.
#Bybit #TheCryptoArk