
Descending Triangle Pattern: What It Is & How to Use It for Crypto Trading

Triangle patterns are widely recognized technical analysis chart formations that provide valuable insights into future price movements. There are three basic triangle consolidation patterns: the symmetrical triangle, ascending triangle and descending triangle. Traders pay close attention to descending triangles, as they often precede significant price breakdowns, presenting opportunities for profitable short trades.
Key Takeaways:
The descending triangle pattern is a bearish chart formation used in technical analysis to identify potential downward price movements.
Traders use the descending triangle pattern to identify potential short-selling opportunities and to set stop-loss orders to manage risk.
The descending triangle pattern should be used in conjunction with other technical indicators and fundamental analysis to make well-informed trading decisions.
What Is a Descending Triangle?
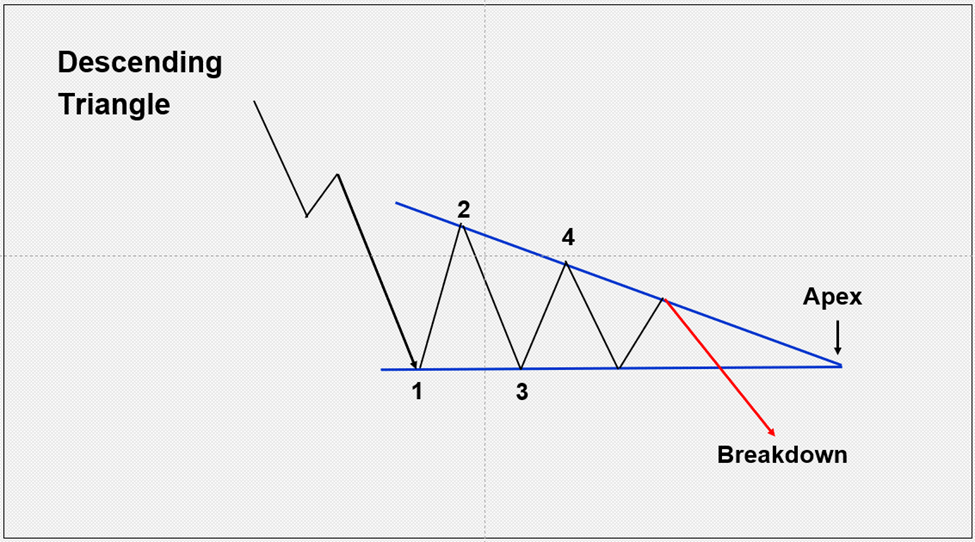
A descending triangle is a bearish trend continuation pattern primarily sought in downtrends. This pattern is formed during consolidation, when the price of a cryptocurrency creates a series of lower highs in an upper descending trend line, while a horizontal support level acts as a floor, creating a triangular shape.
Lower highs represent sellers becoming more aggressive over time, as price is being met with more aggressive selling each time it rises, while support remains relatively constant during the pattern’s formation. At least four points are needed to draw a descending triangle: two for the top trend line and two for the bottom sideways trend line.
Traders look for a break below the support level as a signal to enter a short position, since this indicates that bears have taken control of the market and are likely to push prices lower.
Is a Descending Triangle Pattern Bullish or Bearish?
A descending triangle pattern is inherently bearish, as it signifies sellers becoming more aggressive than buyers during its formation, evidenced by the descending trend line. The lower boundary line of the triangle acts as a crucial support level, and a breakdown occurs when the price drops below this level. When the price eventually breaks out of the pattern, it’s propelled further downward. A decisive close below the lower boundary is necessary in order to validate the breakdown.
It’s worth noting that while the descending triangle pattern predominantly signifies a continuation of a bearish trend, there are instances when it indicates a bearish reversal within an uptrend, albeit less commonly observed. Nonetheless, this pattern's primary purpose remains identifying potential continuation patterns.
How to Spot a Descending Triangle Chart Pattern
First, spot a downtrend. Then, look at the consolidation pattern within the trend to see if it matches the shape of the descending triangle chart pattern. Drawing trend lines can help in confirming the pattern's shape and structure. Make sure to establish a horizontal support level that accurately represents the lower boundary of the triangle.
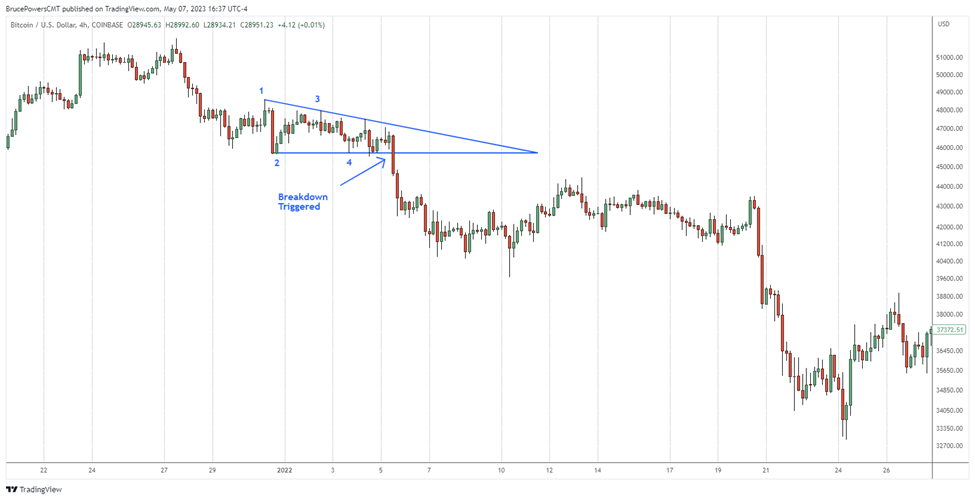
The BTCUSD chart below illustrates a descending triangle pattern emerging following a drop off the highs. It’s an excellent example of a clear, decisive breakdown. The price has dropped quickly upon breaching the support level. Then, it continues lower before pulling back to test resistance near the lows of the triangle. Traders looking to profit from falling prices often seek out descending triangle patterns, due to their characteristic sharp and distinct downward movement triggered by specific events, accompanied by an increase in downward momentum.
How to Trade With a Descending Triangle
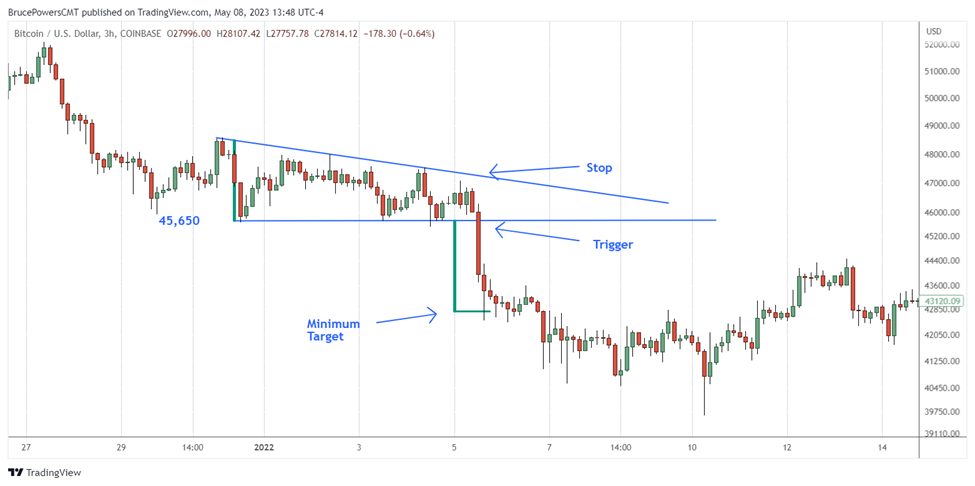
Let’s plan a trade based on a descending triangle chart pattern and break it down by its component parts. A 3-hour chart of Bitcoin is used in this example. Note that while traders often combine multiple tools and strategies when looking for confirmation of a setup, this example only considers the triangle formation.
Trade Setup: Descending Triangle: Look for continuation of the developing downtrend
Trade Trigger: Breakdown below support at $45,650
Initial Stop: Place above top trend line resistance at $47,300
Initial Target: Derived by measuring the height of the triangle and projecting that distance down from the breakdown level [$45,650 − $2,798 (height) = $42,852 target]
Note that false breakouts can and do happen. In fact, some of the most rapid price movements come from false breakouts. Therefore, traders should incorporate strategies that account for false breakouts into their trading plans to mitigate risk and capitalize on market opportunities.
Advantages and Limitations of a Descending Triangle
Some advantages and limitations of using the descending triangle pattern are listed in the following table. A few things can be done to mitigate the impact of limitations.
Advantages | Limitations |
Clear and well-defined trade parameters | Somewhat subjective identification |
Initial target can be estimated | False breakouts can occur |
Provides opportunity to join a strong bear trend | Not as reliable in range-bound markets; needs a trend |
Has some predictive ability for future prices | Study and practice are needed to improve pattern identification |
The more technical analysis evidence supporting the descending triangle setup, the better chance it will work out as anticipated. Therefore, one way to lower the impact of limitations is to have additional supporting evidence for a bearish trade following a breakdown from a descending triangle.
Some ways to mitigate limitations include the following.
Quality of the Preceding Trend
The characteristics of a developing downtrend that occurs before a descending triangle pattern often provide hints about its strength and speed. We can assess the trend before the consolidation phase's relative strength. The stronger the trend preceding consolidation, the more likely that trend will take off once the price breaks down below the triangle’s support level.
Moving Averages
Moving averages can be used to help confirm resistance near the top of the descending triangle or support near the low of the pattern.
Fibonacci Ratio Analysis
If a Fibonacci level coincides with or is close to the support level of the triangle, it becomes easier to identify support levels because two separate analyses are pointing toward the same price level.
Descending Triangle vs. Falling Wedge
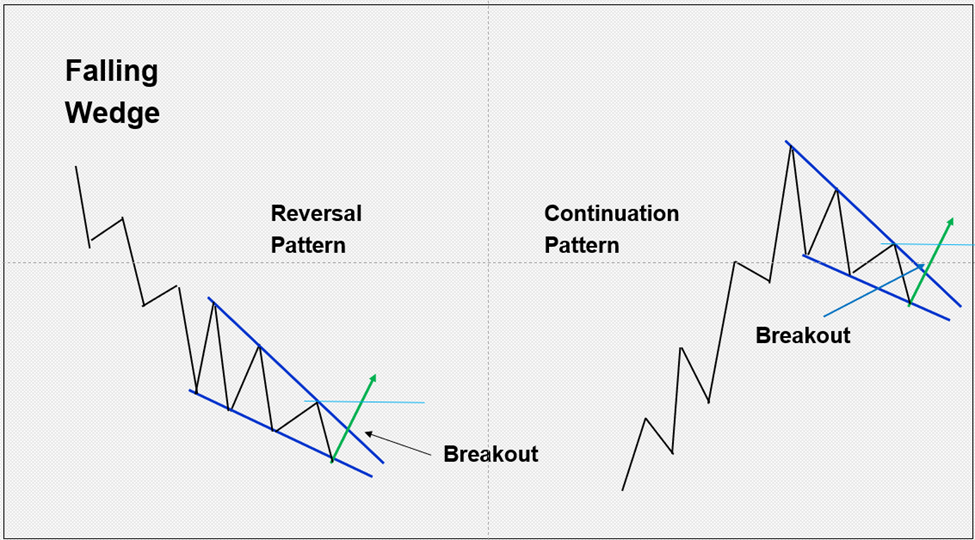
There are significant differences between a descending triangle and a falling wedge. The descending triangle is bearish, and designated as a trend continuation pattern, while the falling wedge is bullish, and can serve as either a continuation or reversal pattern.
The falling wedge pattern is characterized by two converging trend lines that slope downward. Therefore, it represents a period of consolidation wherein prices generally decline during its formation. An indication of a bullish breakout occurs when the price rises above the upper trend line, with confirmation on a daily close above that line.
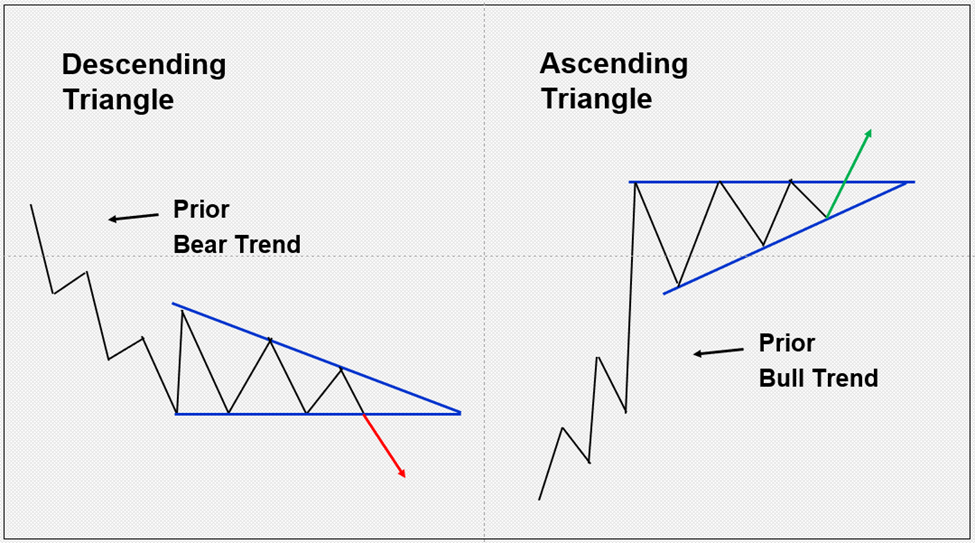
Descending Triangle vs. Ascending Triangle
The descending triangle and ascending triangle indicate two contrasting outlooks. The ascending triangle is bullish, and searched for in uptrends to catch the continuation of a nascent upward trend. On the other hand, the descending triangle is bearish, and is used to enter developing downtrends.
An ascending triangle consists of a horizontal resistance level at the top of the pattern with an uptrend line rising on the lower boundary. The descending triangle, however, comprises a horizontal support level across the bottom of the pattern with a downtrend line across the top of the formation.
The Bottom Line
The descending triangle pattern is a popular technical analysis chart formation that offers valuable insights for cryptocurrency traders. By identifying a consolidation pattern with a consistent support level and a downward-sloping top trend line, traders can anticipate bearish price movements in order to take advantage of declining trends.
When used together with other technical indicators and analysis, the descending triangle pattern can be a highly effective tool in a trader's toolkit.
#Bybit #TheCryptoArk
