
Bull Pennant Pattern: How to Trade With a Bullish Pennant

A bull pennant is a continuation chart pattern used in technical analysis to help you spot a buying opportunity.
In this article, we’ll review the bull pennant pattern and what it looks like. Additionally, we'll compare it to other common chart patterns so you can be confident in spotting and eventually trading this price formation in cryptocurrency markets.
Key Takeaways:
A bull pennant is a continuation pattern for buying opportunities in crypto. It appears after a consolidation that follows an upward trend.
The bullish pennant pattern is a favorite with traders, as it signals a strong uptrend.
Bull pennant patterns provide clear entry and exit points, along with favorable risk-to-reward ratios. However, they can morph into other patterns or even reversals.
What Is a Bull Pennant Pattern?
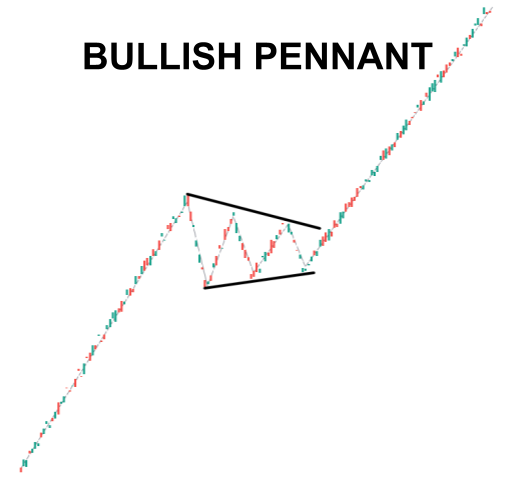
A bull pennant is a chart trading continuation pattern in which, after a strong trend higher, prices pause and consolidate briefly, then rally further, resuming the larger uptrend. The pattern gets its name from the shape of the consolidation, which often looks like a pennant as prices wedge together before breaking higher. It is the opposite of the bear pennant chart pattern.
A bull pennant emerges when a cryptocurrency’s price rises in a strong trend, yet some buyers believe it’s still relatively affordable and wait to buy the dip. Meanwhile, traders who bought late may get anxious and opt to sell their positions. As a result, the crypto’s price decreases slightly, accompanied by a weak volume.
During this consolidation phase, the trading volume tends to be low. The cryptocurrency appears to randomly bounce within a range, making no progress. After a brief duration, the selling stops and the trading volume falls as the last traders are shaken out. When the volume fades, buyers reenter the market, driving prices higher and restoring the uptrend.
What Does a Bull Pennant Look Like?
There are three phases to a bull pennant, which are split into the different points in the diagram below.
Point 1: Known as the flagpole, this is the point when the crypto market will experience a large and strong rally, drawing many traders into the trend.
Point 2: The established uptrend abruptly halts, giving way to a period of market consolidation. Unfortunately, the decline doesn’t have a lot of strength or volume to sustain it and quickly fades away. During this consolidation phase, the drop is shallow and has retraced less than 38% of the previous rally.
The short-term correction stops and leads to another rally. A key difference is that the next rally is feeble and struggles to materially break to new highs. This results in sideways price action, giving the impression that the prior uptrend has lost its momentum. As observed on a daily chart, the consolidation phase may last one to three weeks. On smaller chart time frames, the consolidation will be relatively shorter.
Point 2.5: When you draw two trend lines along the outer edges of the consolidation, they converge to form the shape of a contracting triangle. This distinctive pattern characterizes the sideways movement, in which the upper and lower boundaries of the range gradually converge as time passes.
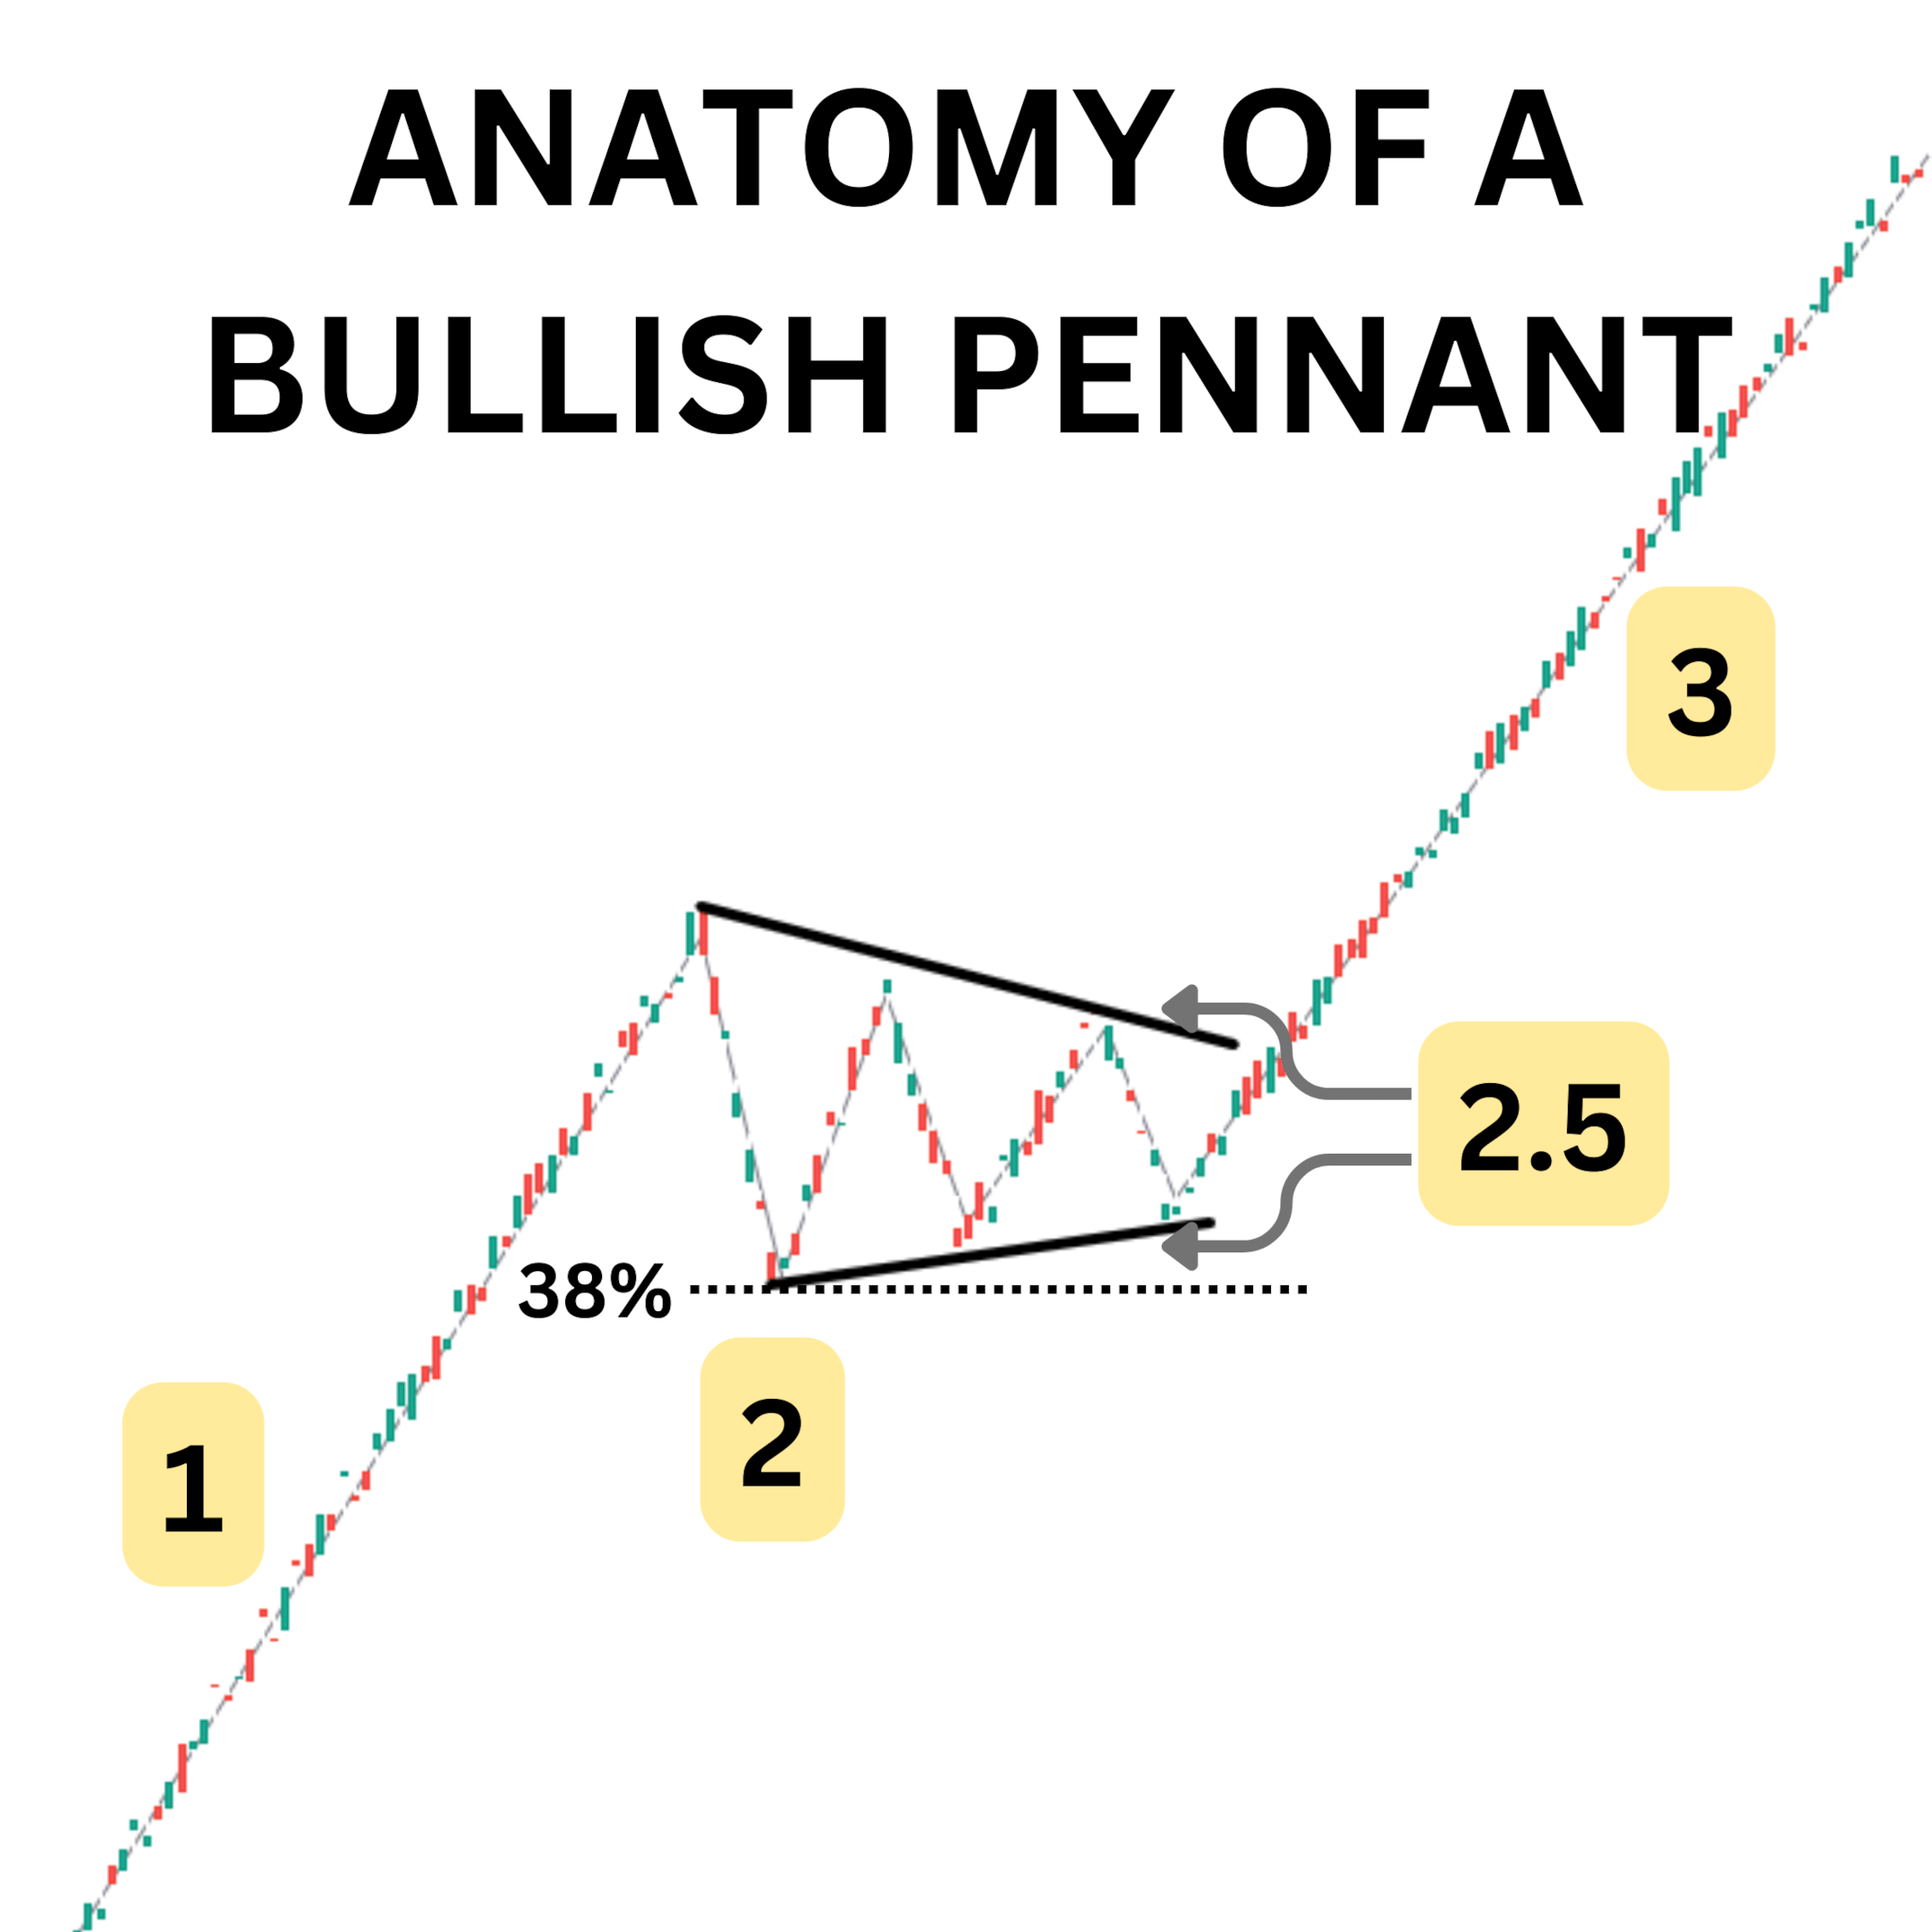
This contracting triangle is critical to defining the pattern, as it ultimately leads to a strong continuation in a higher uptrend. During this consolidation, trading volume diminishes. The fight between the bears and the bulls looks more like a truce: neither one shows up anymore, sticking with their positions as the consolidation drags on. At this point, the pattern looks like a triangle on top of a stick — creating the pennant image — and the bullish trade is set up.
Point 3: Eventually, the consolidation leads to a breakout higher with buyers returning, just as strong as they were in the initial rally. This is partly due to FOMO and to buyers not wanting to miss out on the next big trend. The imbalance of buyers versus sellers is so pronounced that the price readjusts rapidly higher. Sometimes, the length of the secondary rally can be as long as the initial flagpole’s height. In essence, the consolidation marks the midpoint of the entire rally.
Bull Pennant vs. Bull Flag
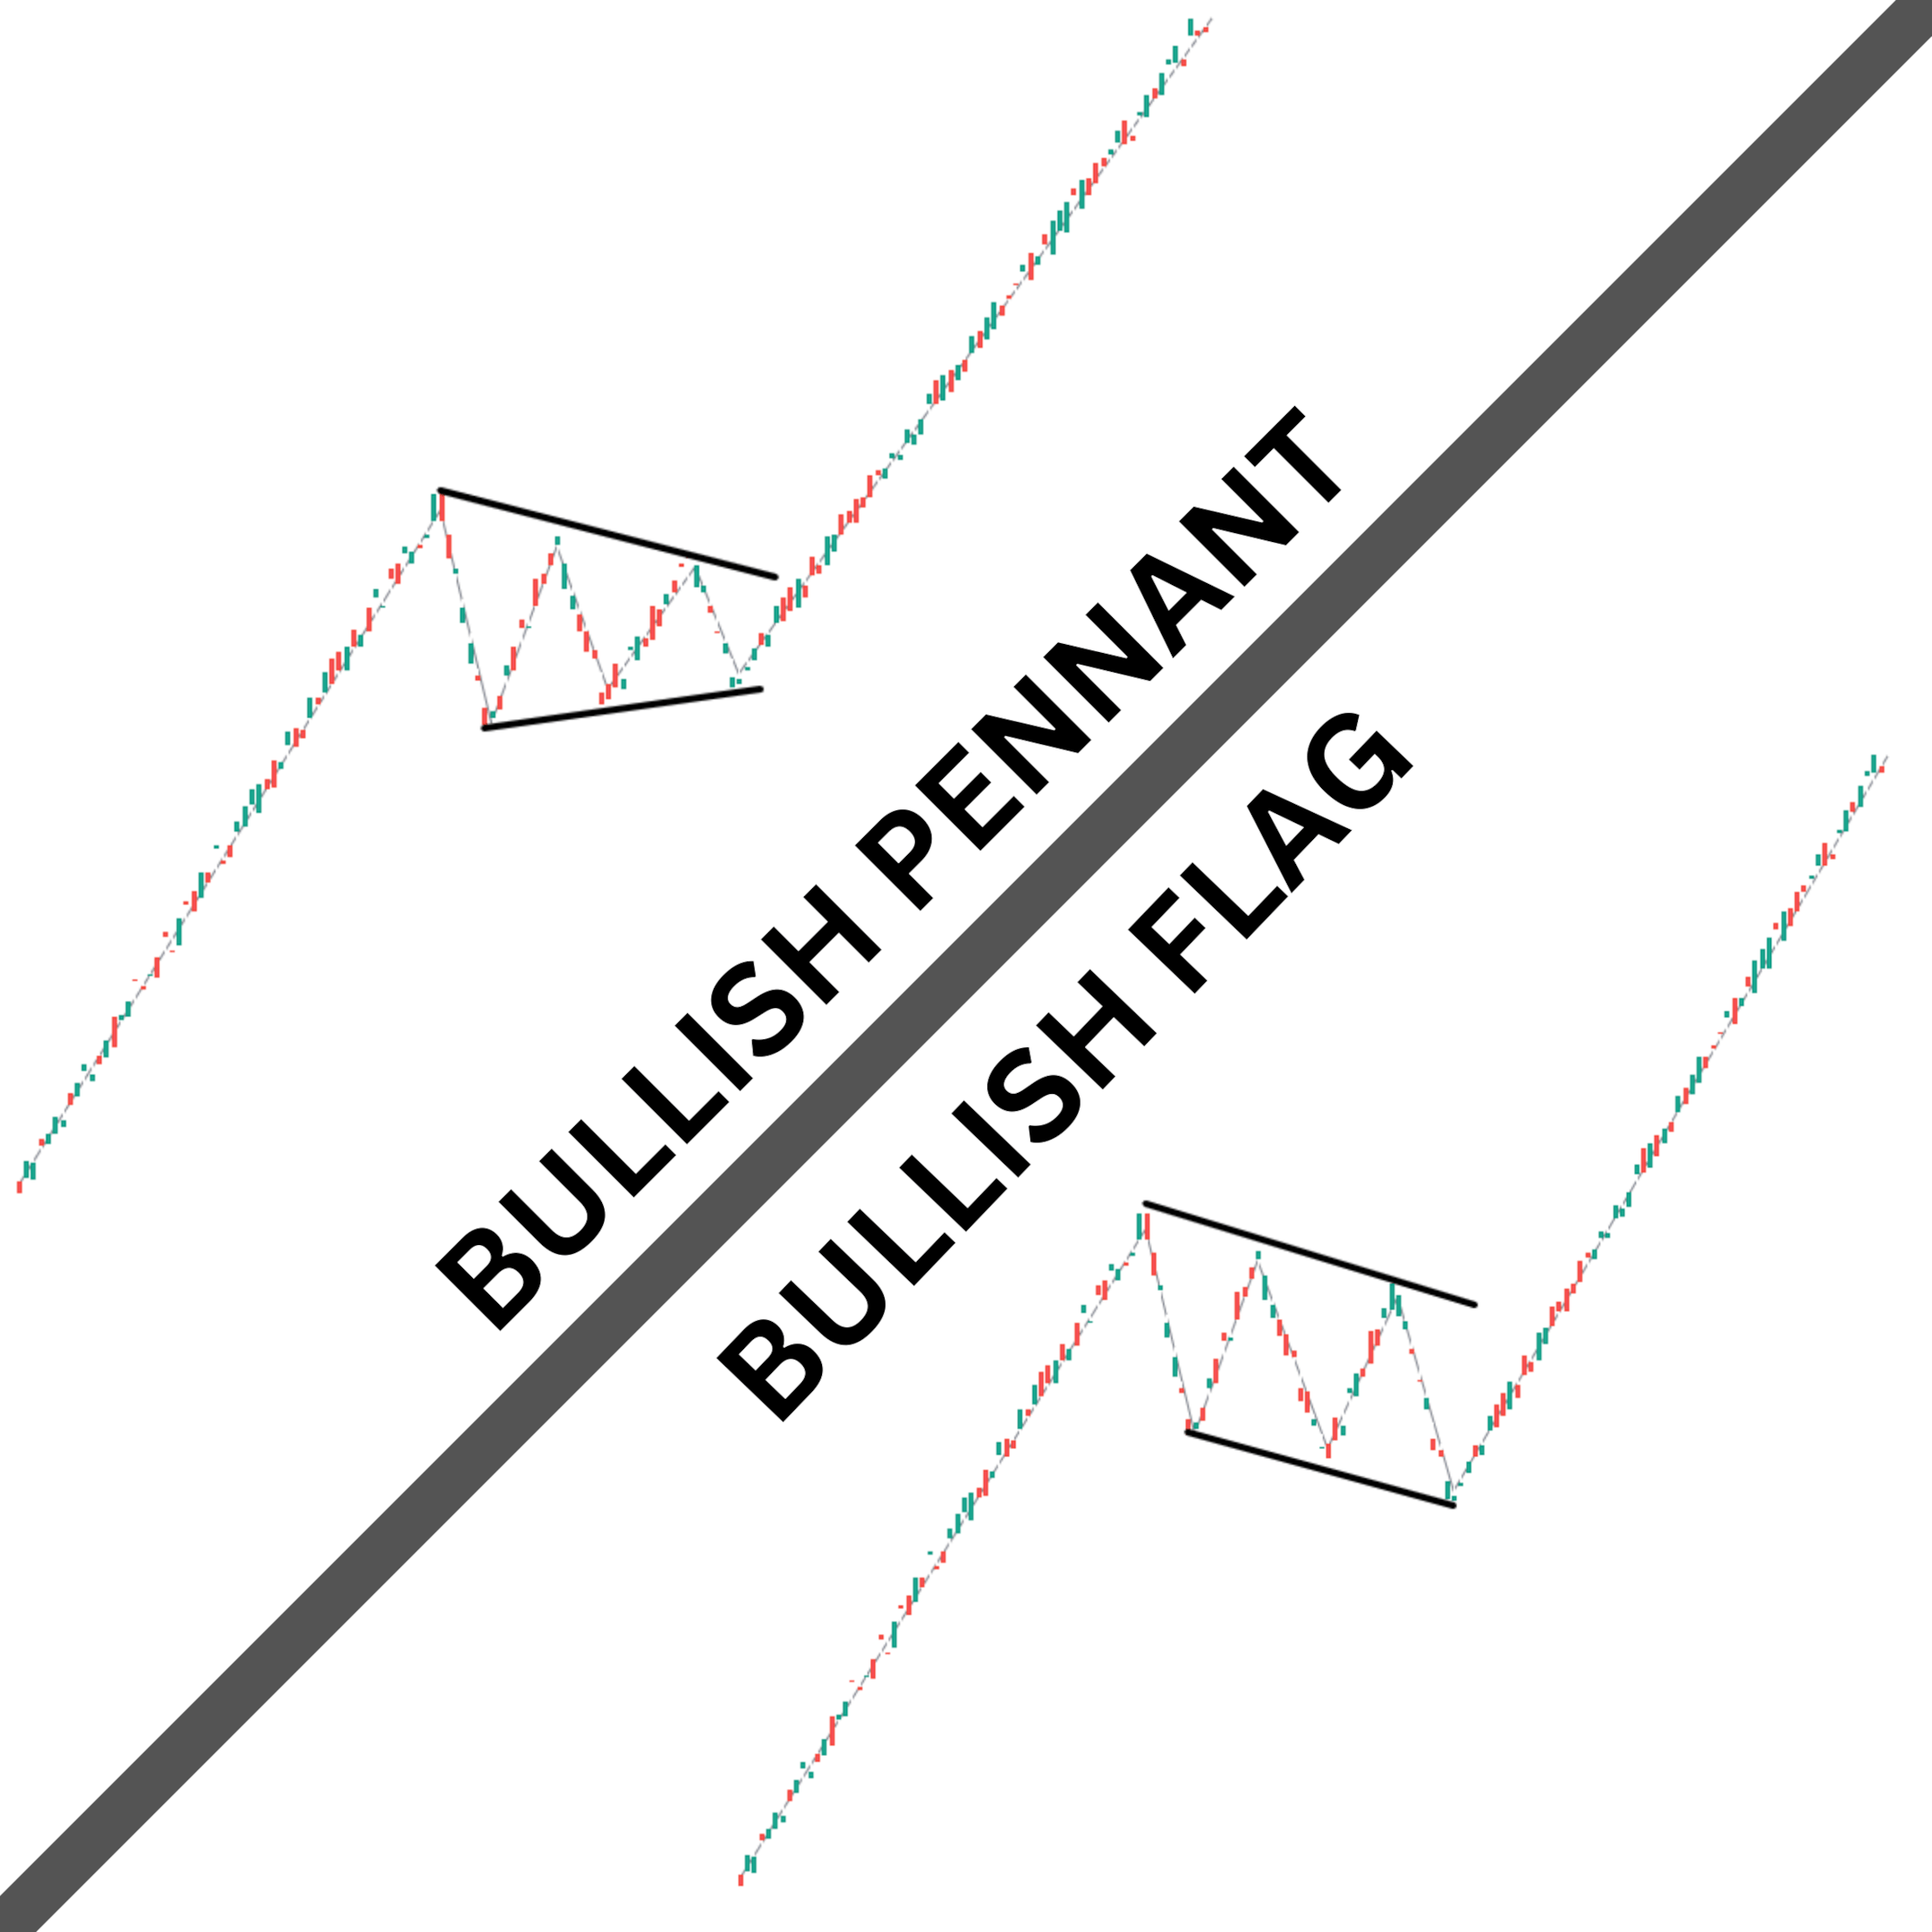
In terms of technical analysis, a bull pennant bears many similarities to a bullish flag. Both are continuation patterns consolidating an uptrend. This price consolidation eventually leads to a more significant rally in price. However, there’s a slight difference in their shape. The bull flag has a rectangular look, with parallel trend lines in the consolidation phase, while the bull pennant resembles a triangle.
Analysts debate whether the bull pennant or bull flag is the more powerful pattern. On the one hand, the triangular shape of the bull pennant suggests that hardly any sellers are left in the market, leading to shorter consolidation periods. Meanwhile, the rectangular shape of the bull flag is effective at “shaking out” potential buyers, trapping them into selling right before the pattern ends and the rally begins.
Regardless, both patterns point to incipient strong bullish uptrends and are highly regarded by traders.
Bull Pennant vs. Triangle
What’s the difference between bullish/bearish pennants and triangle patterns? They’re similar at first glance, and overlap in many areas. The bull pennant chart pattern also has a symmetrical triangle-like shape during the consolidation phase that includes converging trend lines. However, the main difference is in what happens before and after the triangle — and how long the triangle itself lasts.
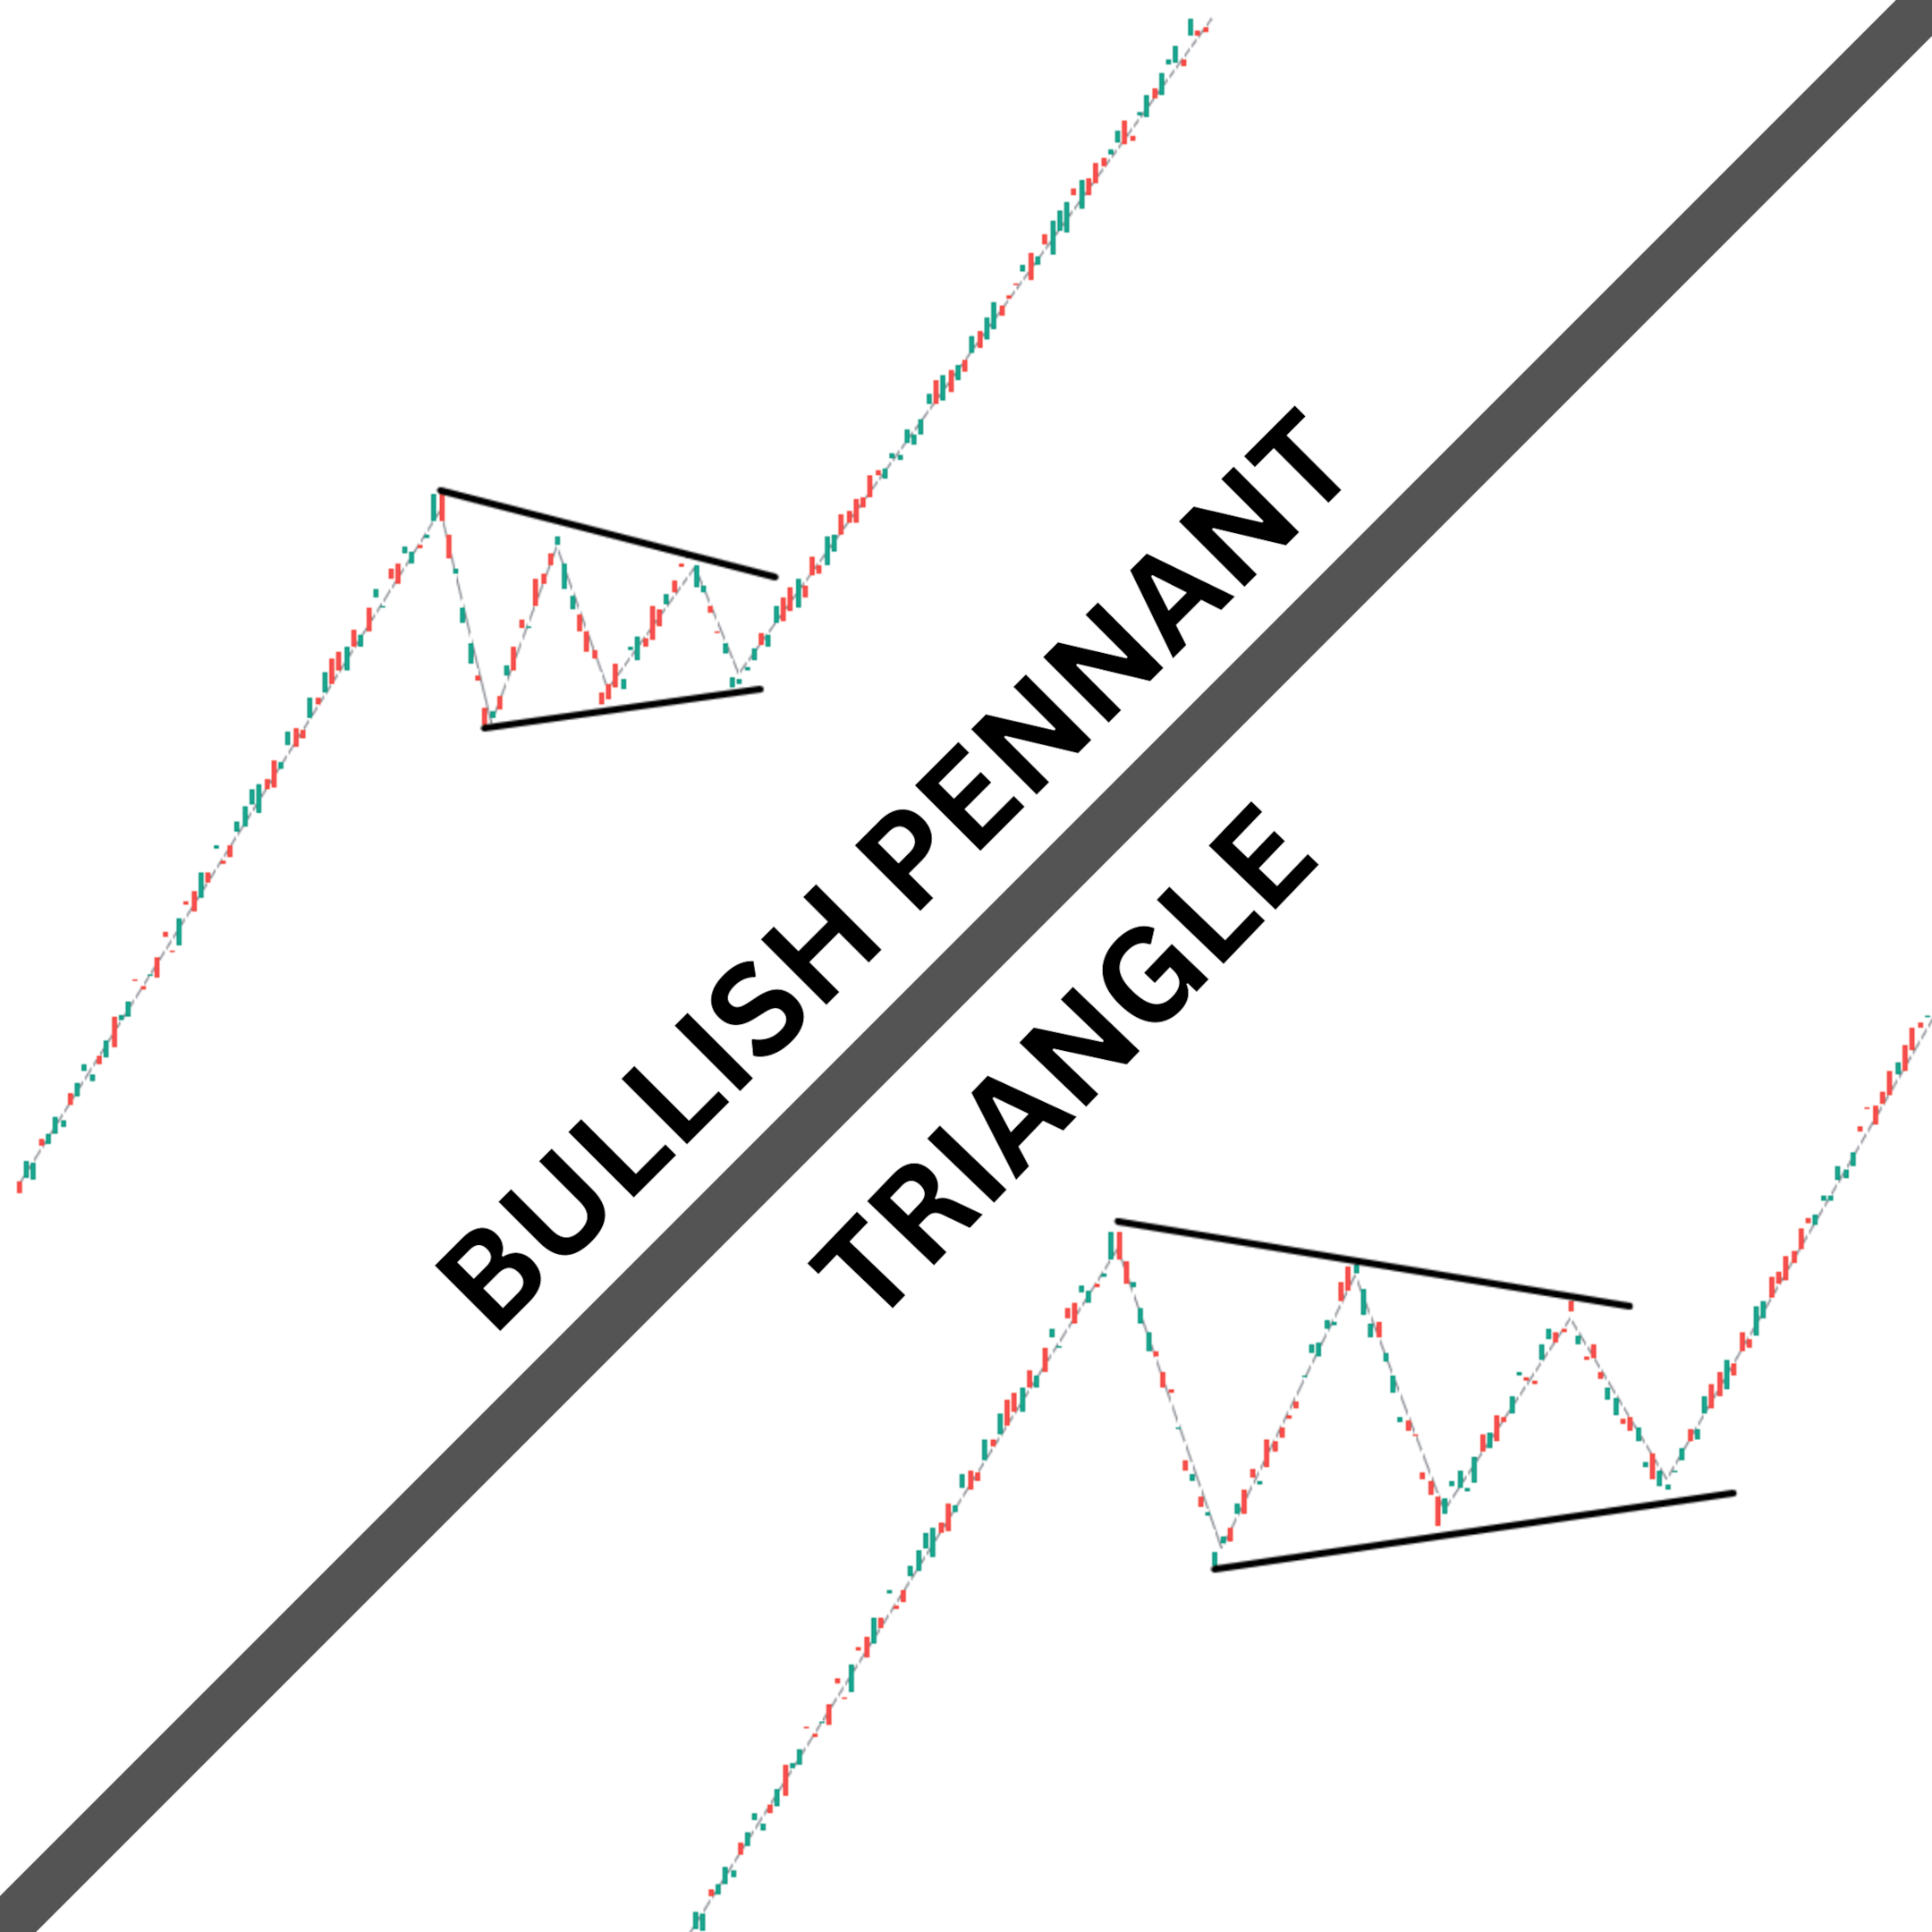
Leading into the bullish pennant pattern, there’s a sharp and extended rally that looks like a flag pole. Then, the pattern consolidates into a triangular formation. However, with a symmetrical triangle pattern, there doesn’t have to be a strong trending move preceding the triangle.
Secondly, after the triangle in a pennant pattern forms, it’s apparent in which direction to expect the pennant to break: it will break in the direction of the preceding trend, which — in the case of a bullish pennant — is to the upside. With a regular triangle, the breakout might happen to the upside or downside.
The third main difference between pennant and triangle patterns is in how long they last. The triangle portion of a pennant tends to be shorter in duration than a typical triangle pattern. The swiftness of the pennant's triangle happens because the emotions of the correction are high, and most traders aren't dumping loads of sell orders into the market. In contrast, a regular triangle pattern can last years, and be preceded by small trends.
Bull Pennant vs. Wedges
What’s the difference between a bullish pennant and a rising wedge? To the uninformed, the patterns may seem one and the same. For example, both patterns have two converging lines that shape them.
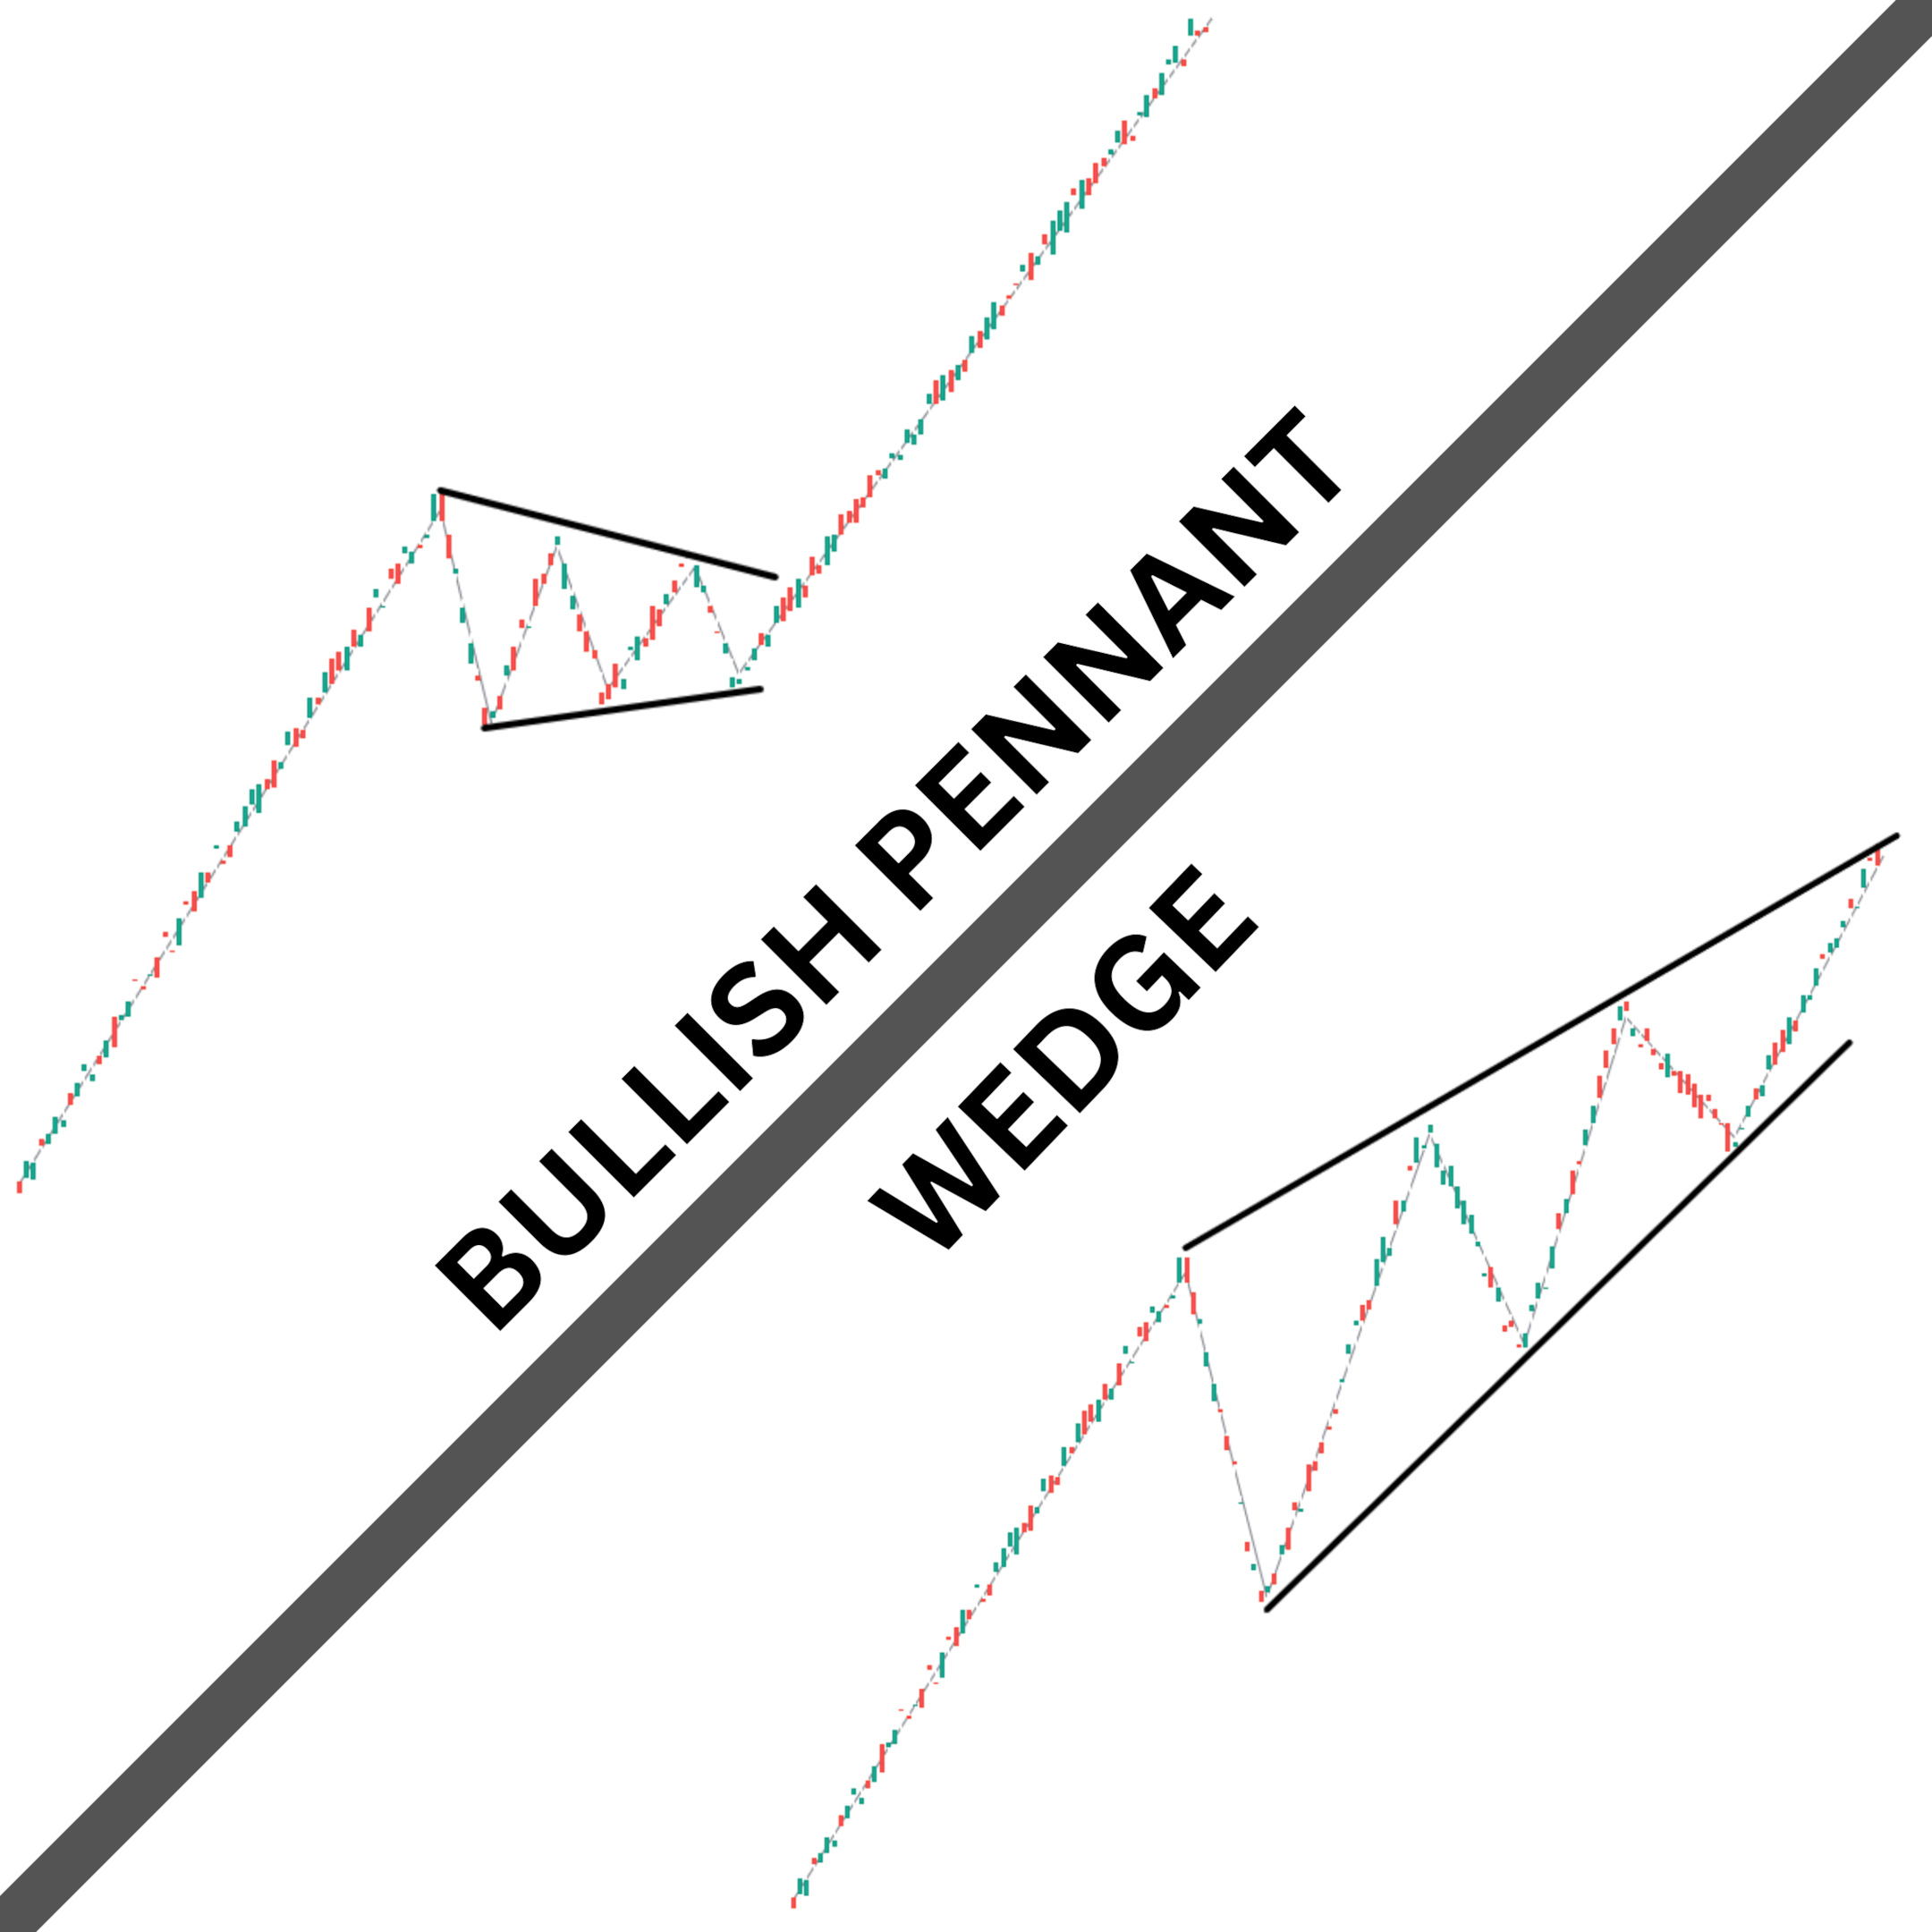
However, the differences are pretty straightforward once you learn the distinguishing factors between the two patterns.
First, the shapes of the patterns are slightly different. While the support trend line is pointed higher in both patterns, the biggest difference is the direction of the resistance trend line. For the rising wedge pattern, even though the trend lines converge, the upper trend line points higher in the same direction as the lower trend line. In the bullish pennant pattern, the upper trend line points down.
Secondly, the location of the pattern within the larger trend is a major difference. The pennant chart pattern is located in the middle of the larger trend. The bullish pennant chart pattern generally leads to a strong rally. On the other hand, the rising wedge pattern can be located anywhere within the larger trend. Oftentimes, the wedge pattern is found at the beginning of a new trend or the end of an old one. This is due to the trend trying to organize itself (beginning) or losing momentum (end).
How to Trade the Bull Pennant
Once you’ve identified a bull pennant — congratulations! — because you’ve completed one of the toughest parts of trading the pattern. The subsequent trade can be rewarding, as the setup is simple and fairly straightforward.
Identifying a Bull Pennant Pattern on a Crypto Chart
When reviewing an hourly chart, a bullish pennant pattern appears after a strong uptrend. The initial move forms the flagpole of the pattern, and then prices consolidate sideways.
Referring to the illustration below, after an extended correction in 2022, Bitcoin began to rally in January 2023.
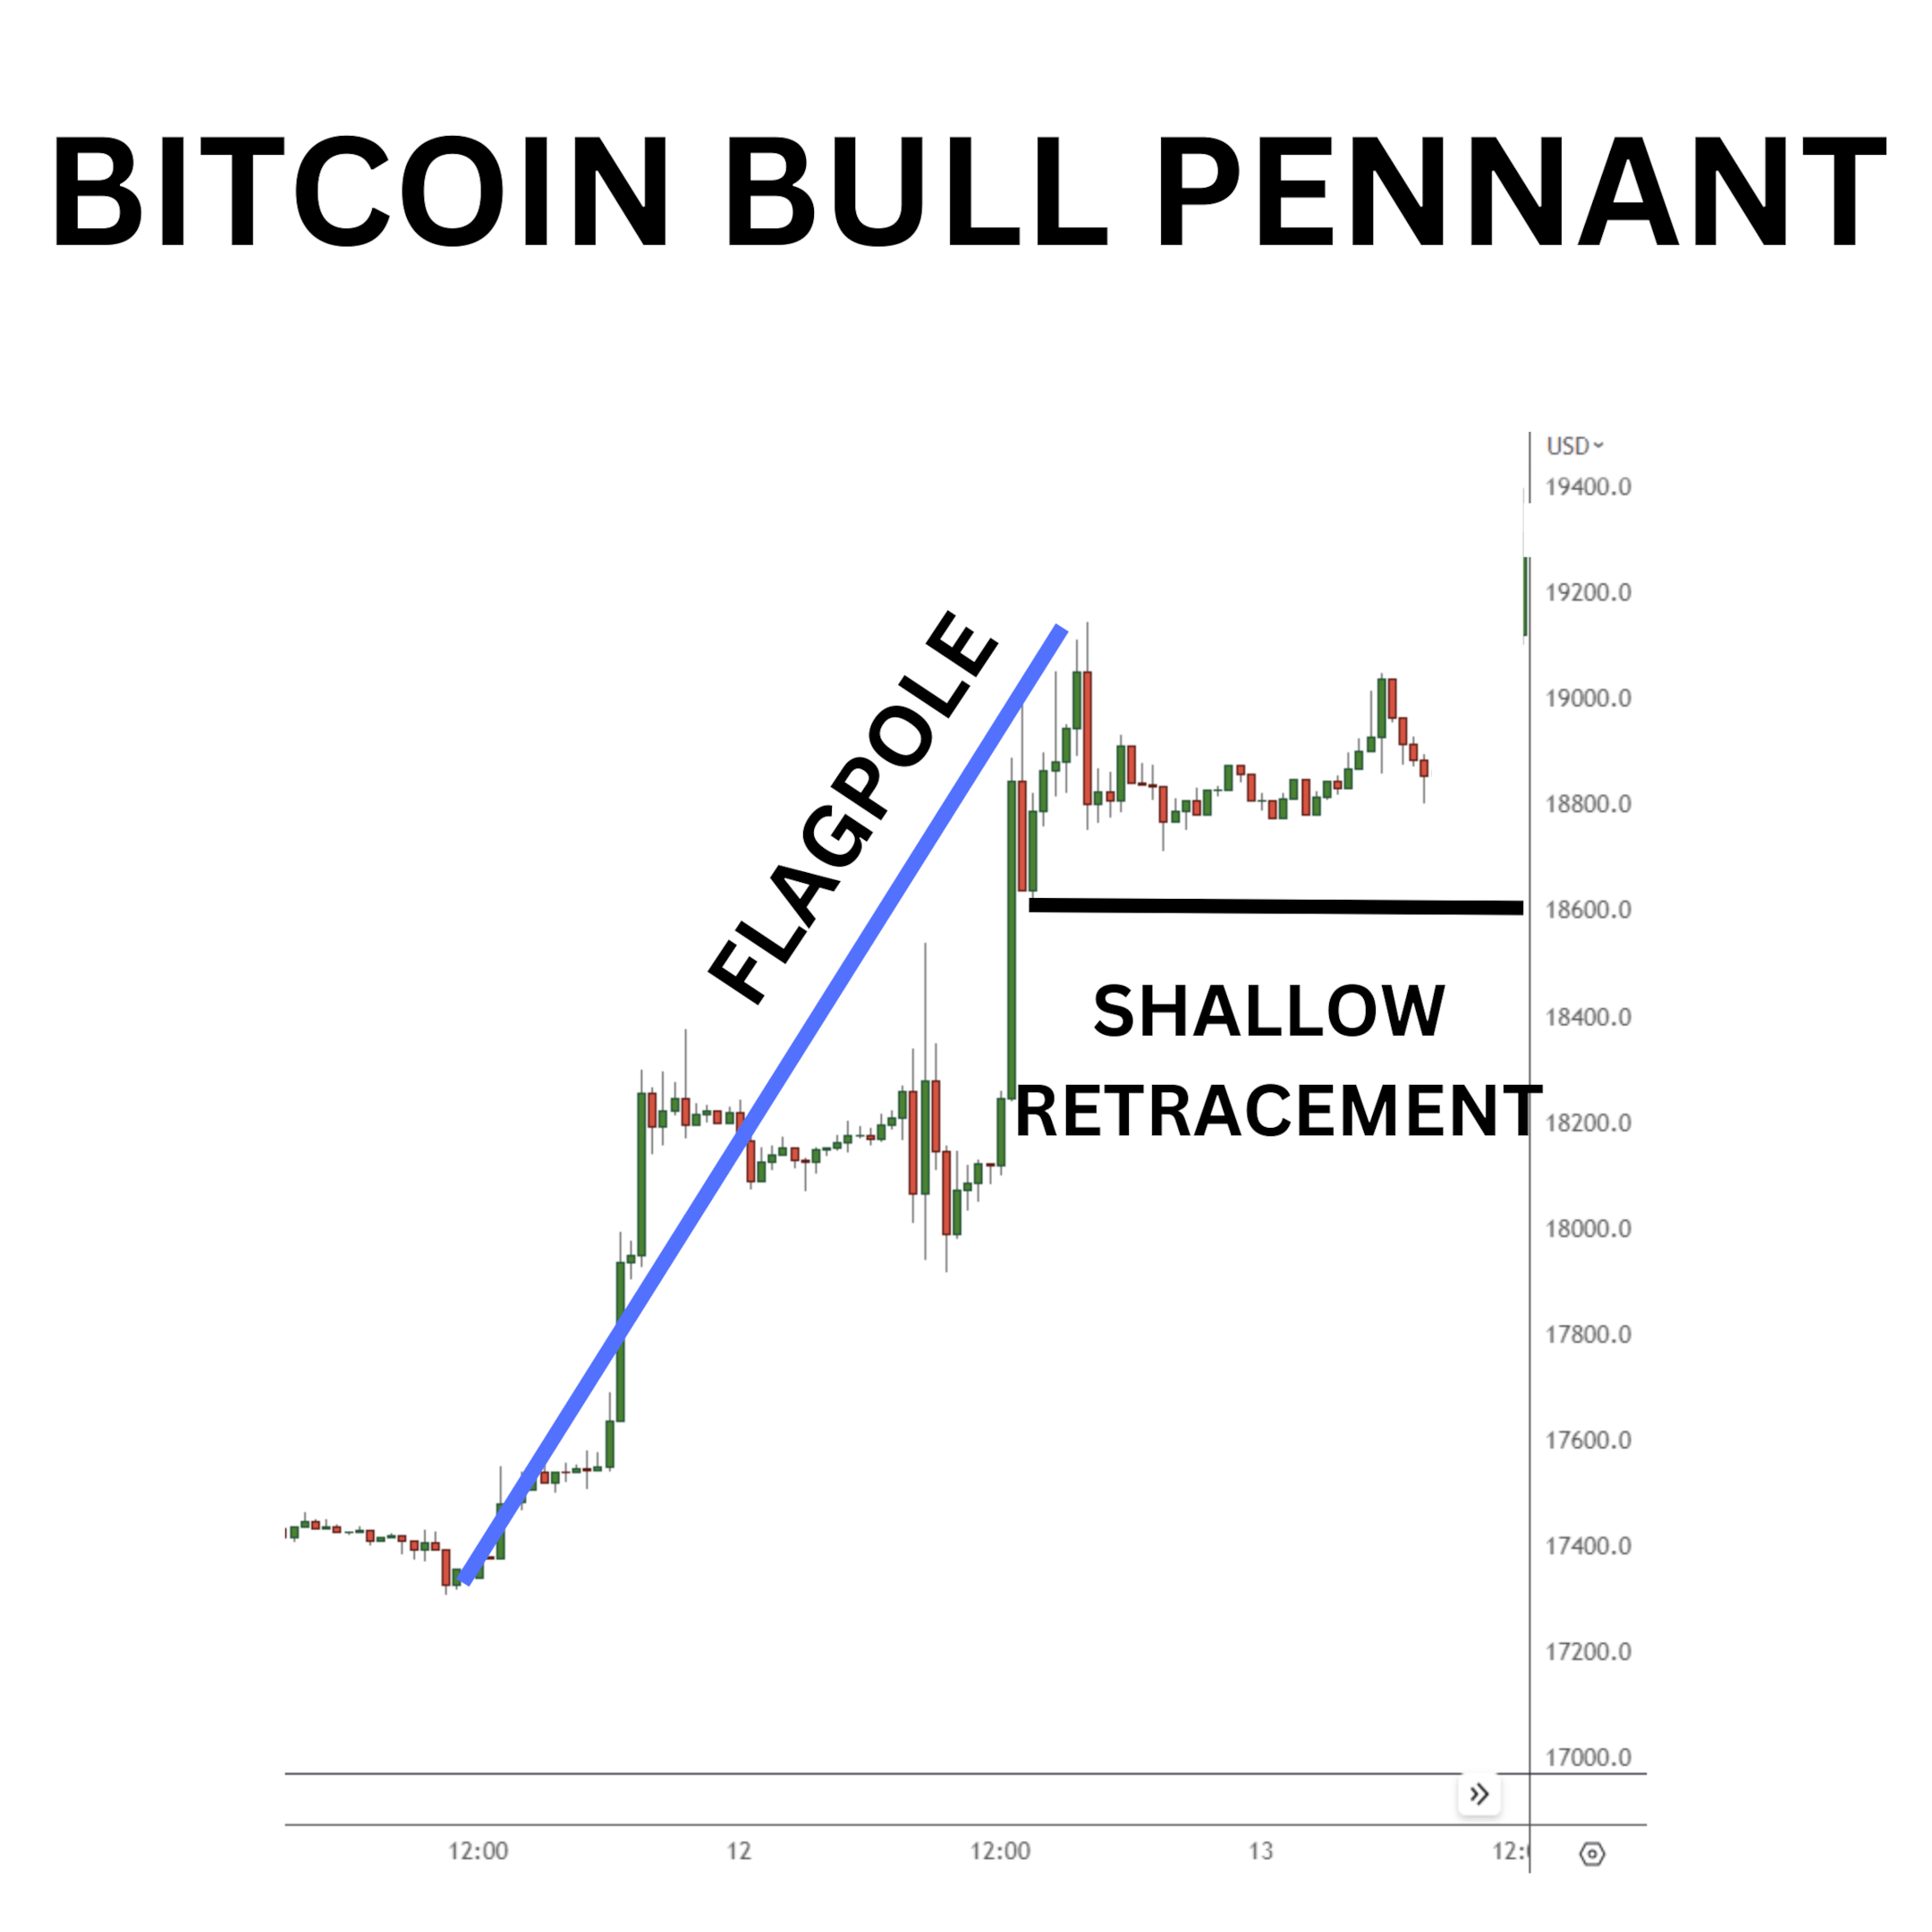
BTC began to correct lower as some traders were taking profits. The depth of the sideways consolidation was shallow, retracing less than 38% of the preceding flagpole trend.
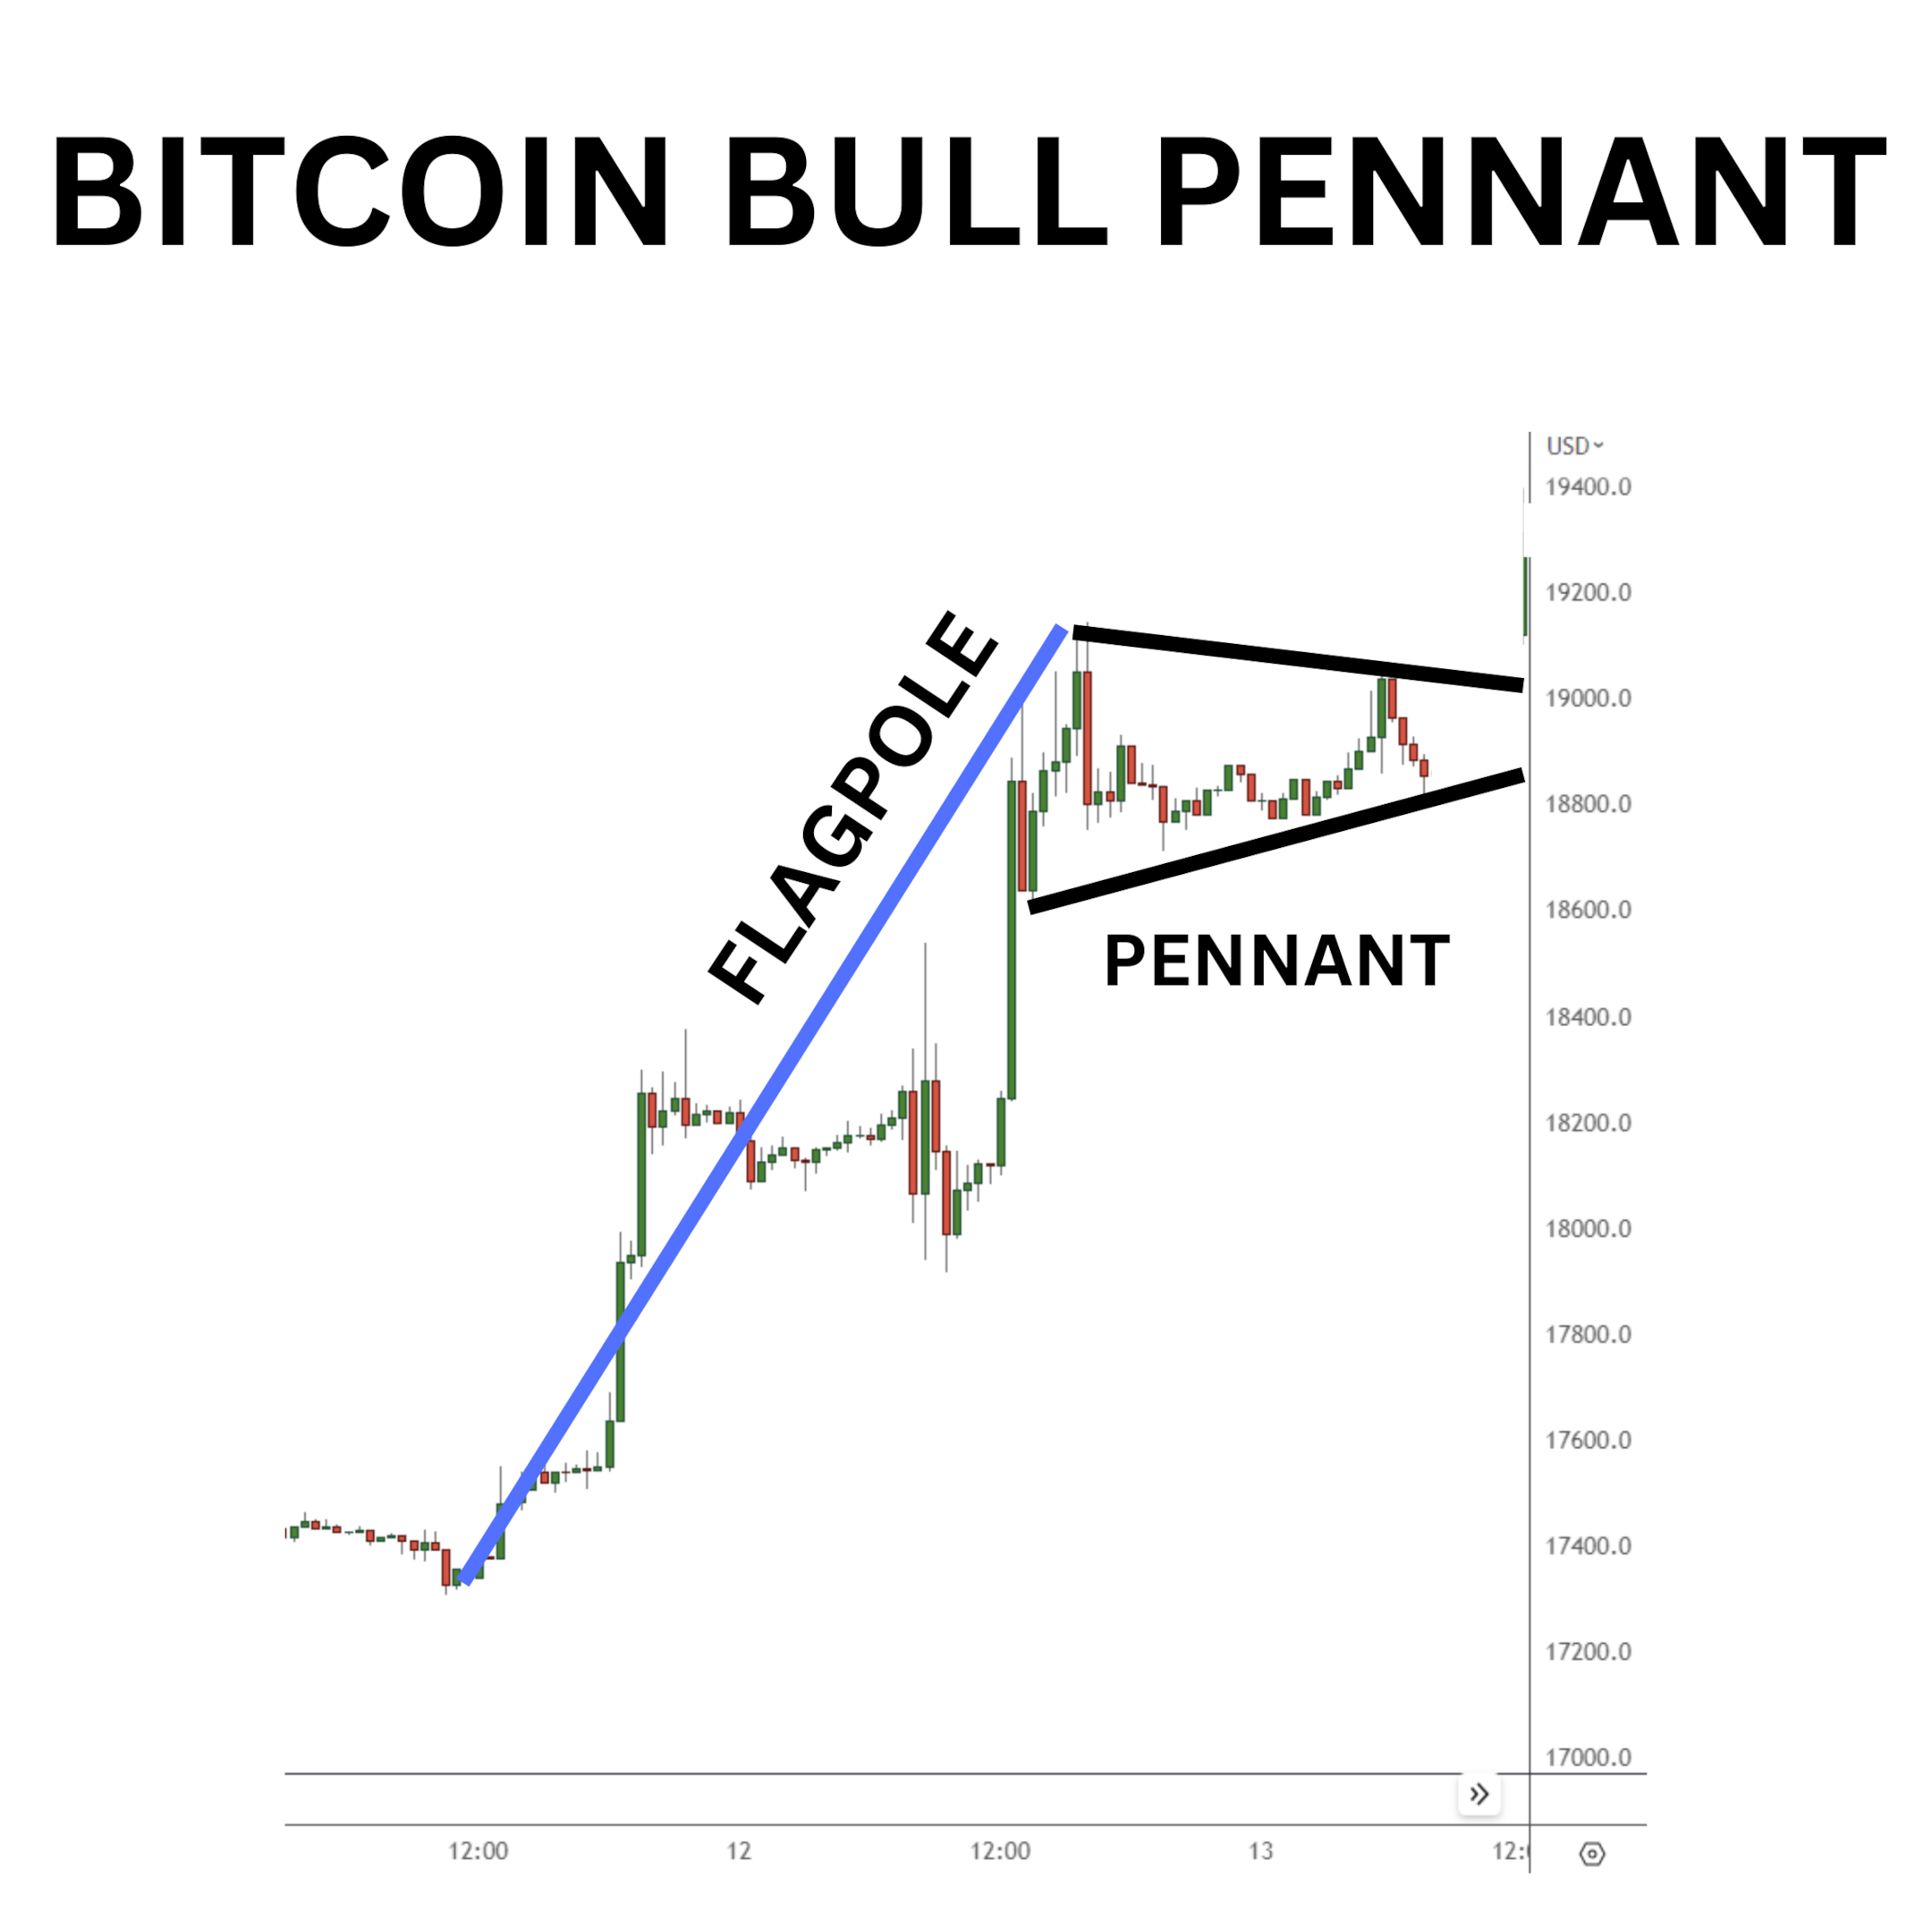
Bitcoin began to chop around sideways, making no real progress in one direction or the other. We can spot two converging trend lines along the outer edges, and the pattern begins to take shape. This formation creates an ideal setup for a bull pennant trade.
Opening a Buy (Long) Position
After spotting the pattern, it’s time to plan the trade’s entry.
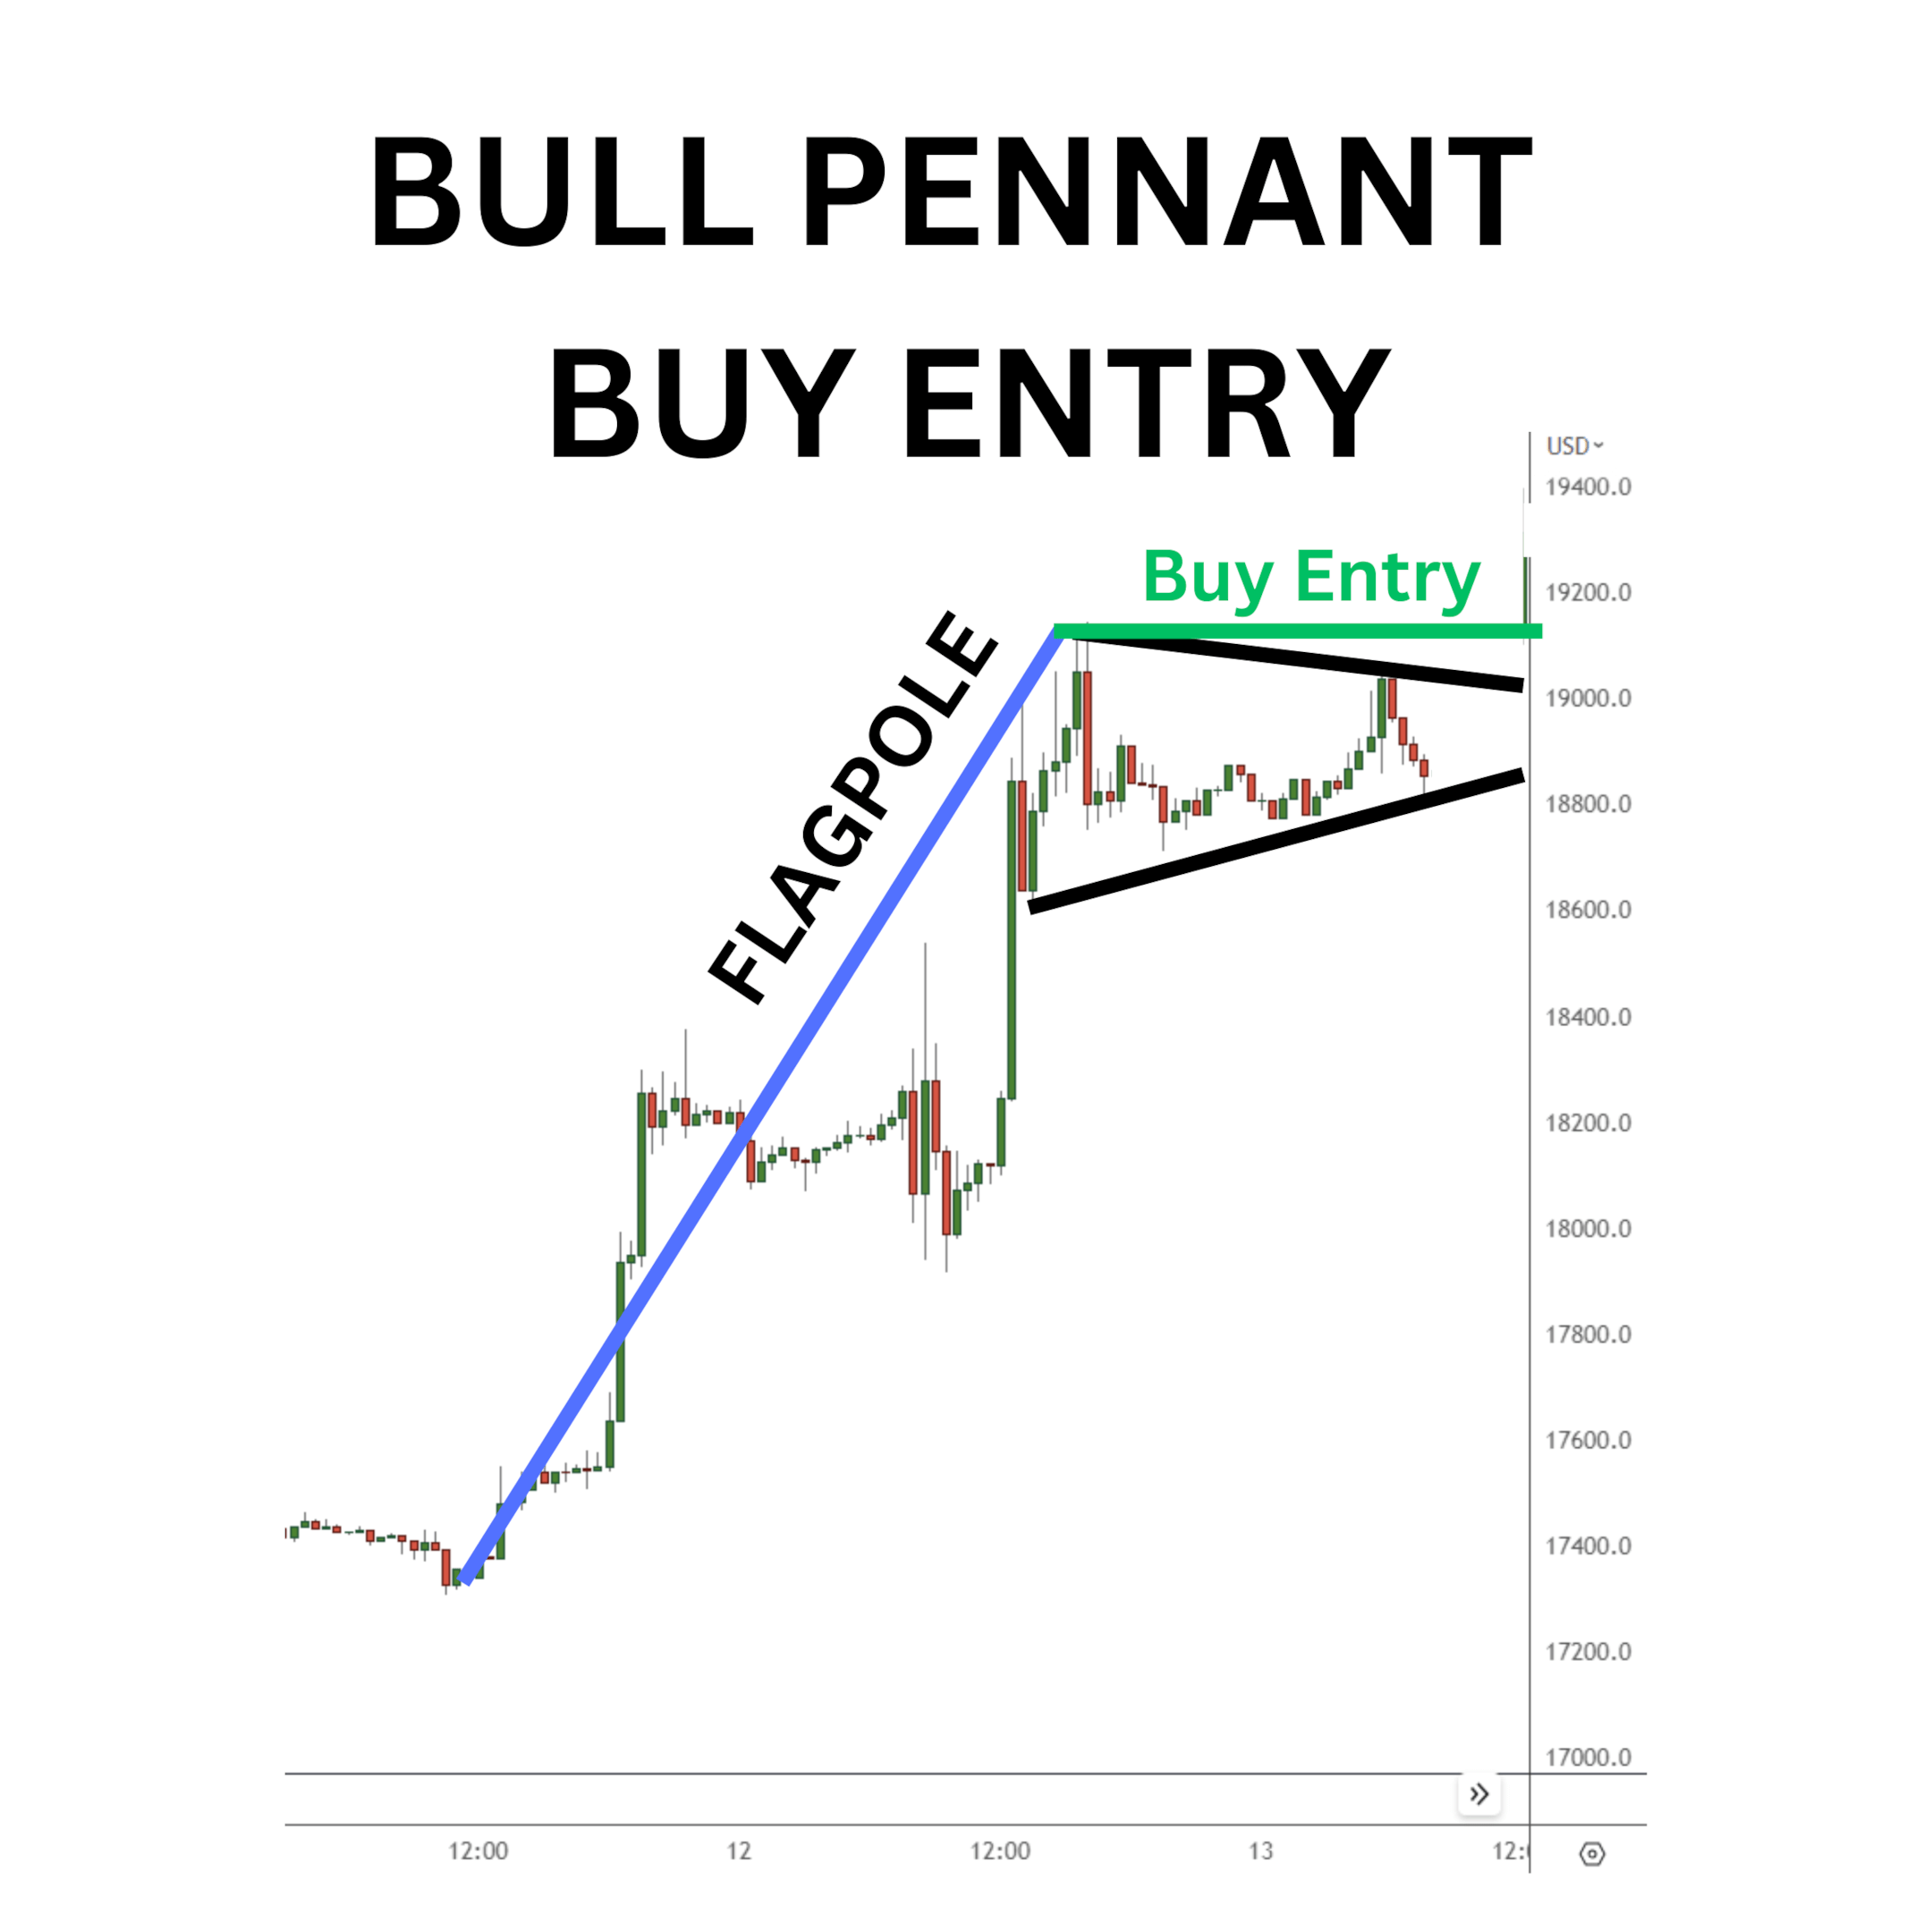
The easiest entry is at the highest point of the pattern. Set an entry order to buy if the market rallies to new highs. Placing an entry at the pattern’s high point helps shield you against false breakouts, and ensures that Bitcoin is truly prepared to rise to new higher prices. If it does, it will result in a significant upward surge, sparking another substantial rally.
Placing a Stop Loss
The stop loss will be placed below the pattern near the recent lows.
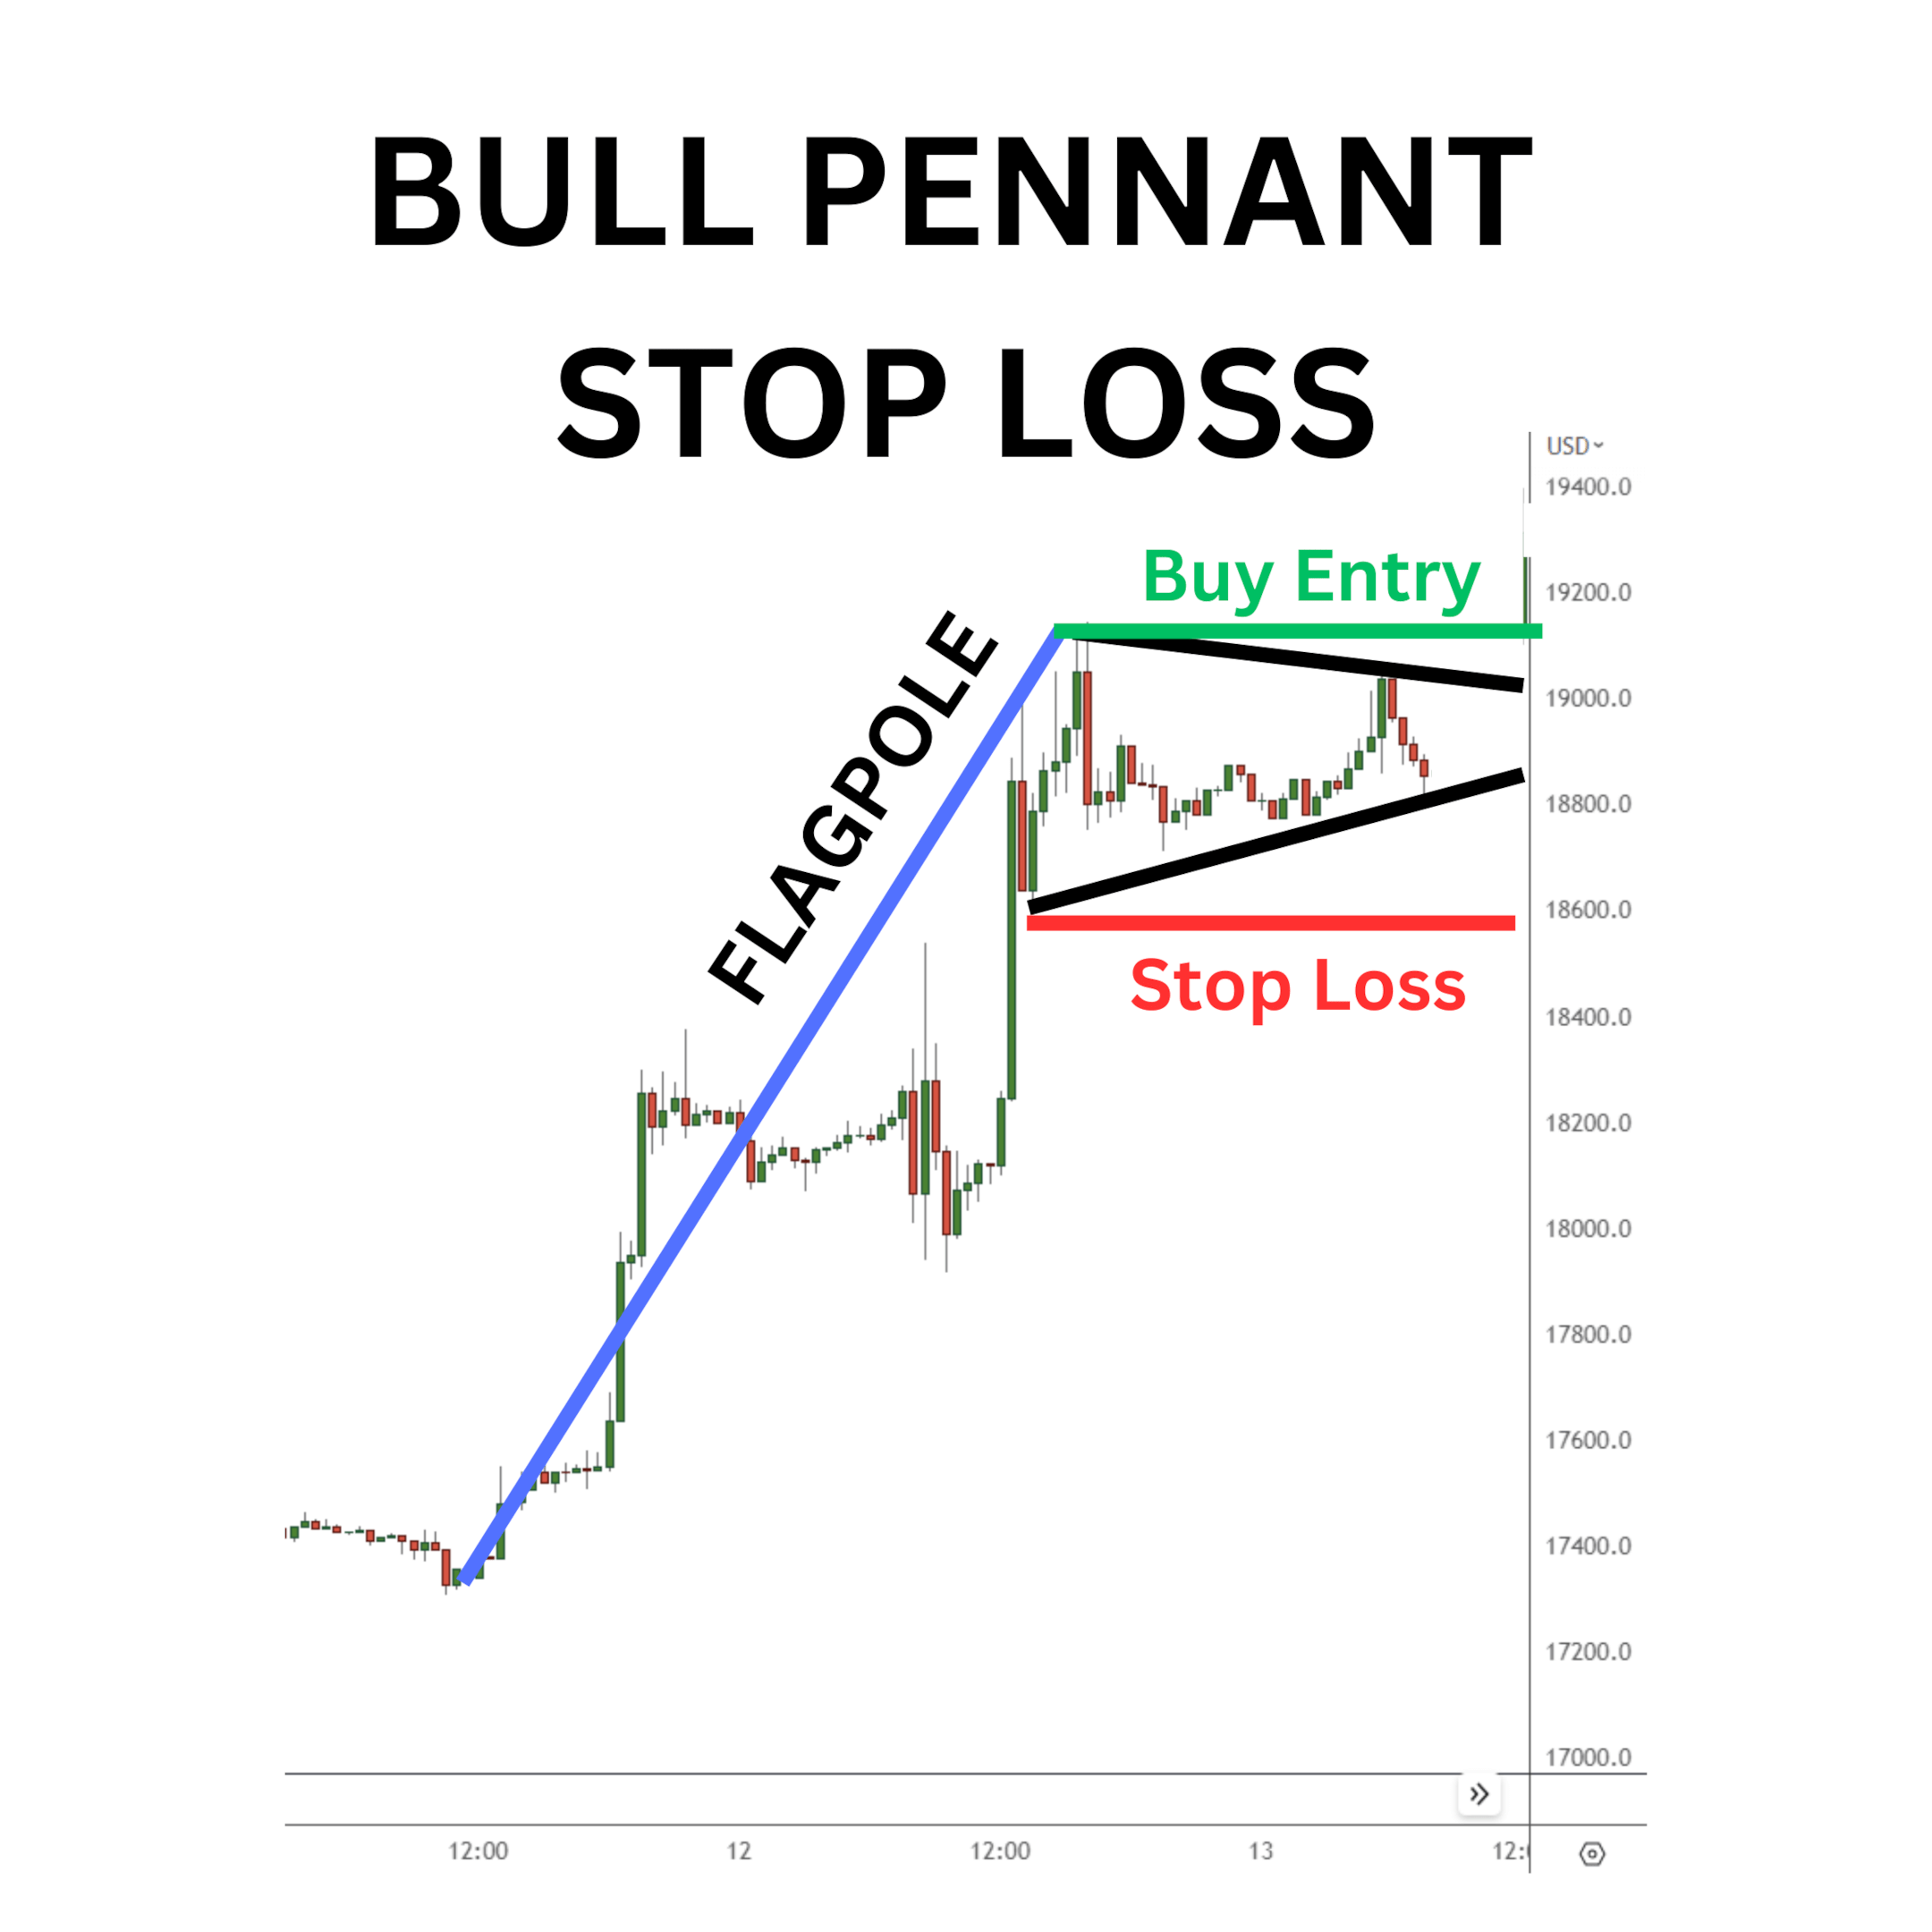
The best place for a stop loss is just below the support trend line of the pattern. That way, if Bitcoin falls below the support line, the bull pennant pattern is voided, suggesting another pattern has been unfolding.
Knowing Where to Take Profit
Typically, the bull pennant is found around the rally's halfway point. You can simply measure out the first rally, then project it at the end of the bull pennant near the last touch of the support trend line. The Fibonacci extension tool can be handy for helping you measure out these situations.
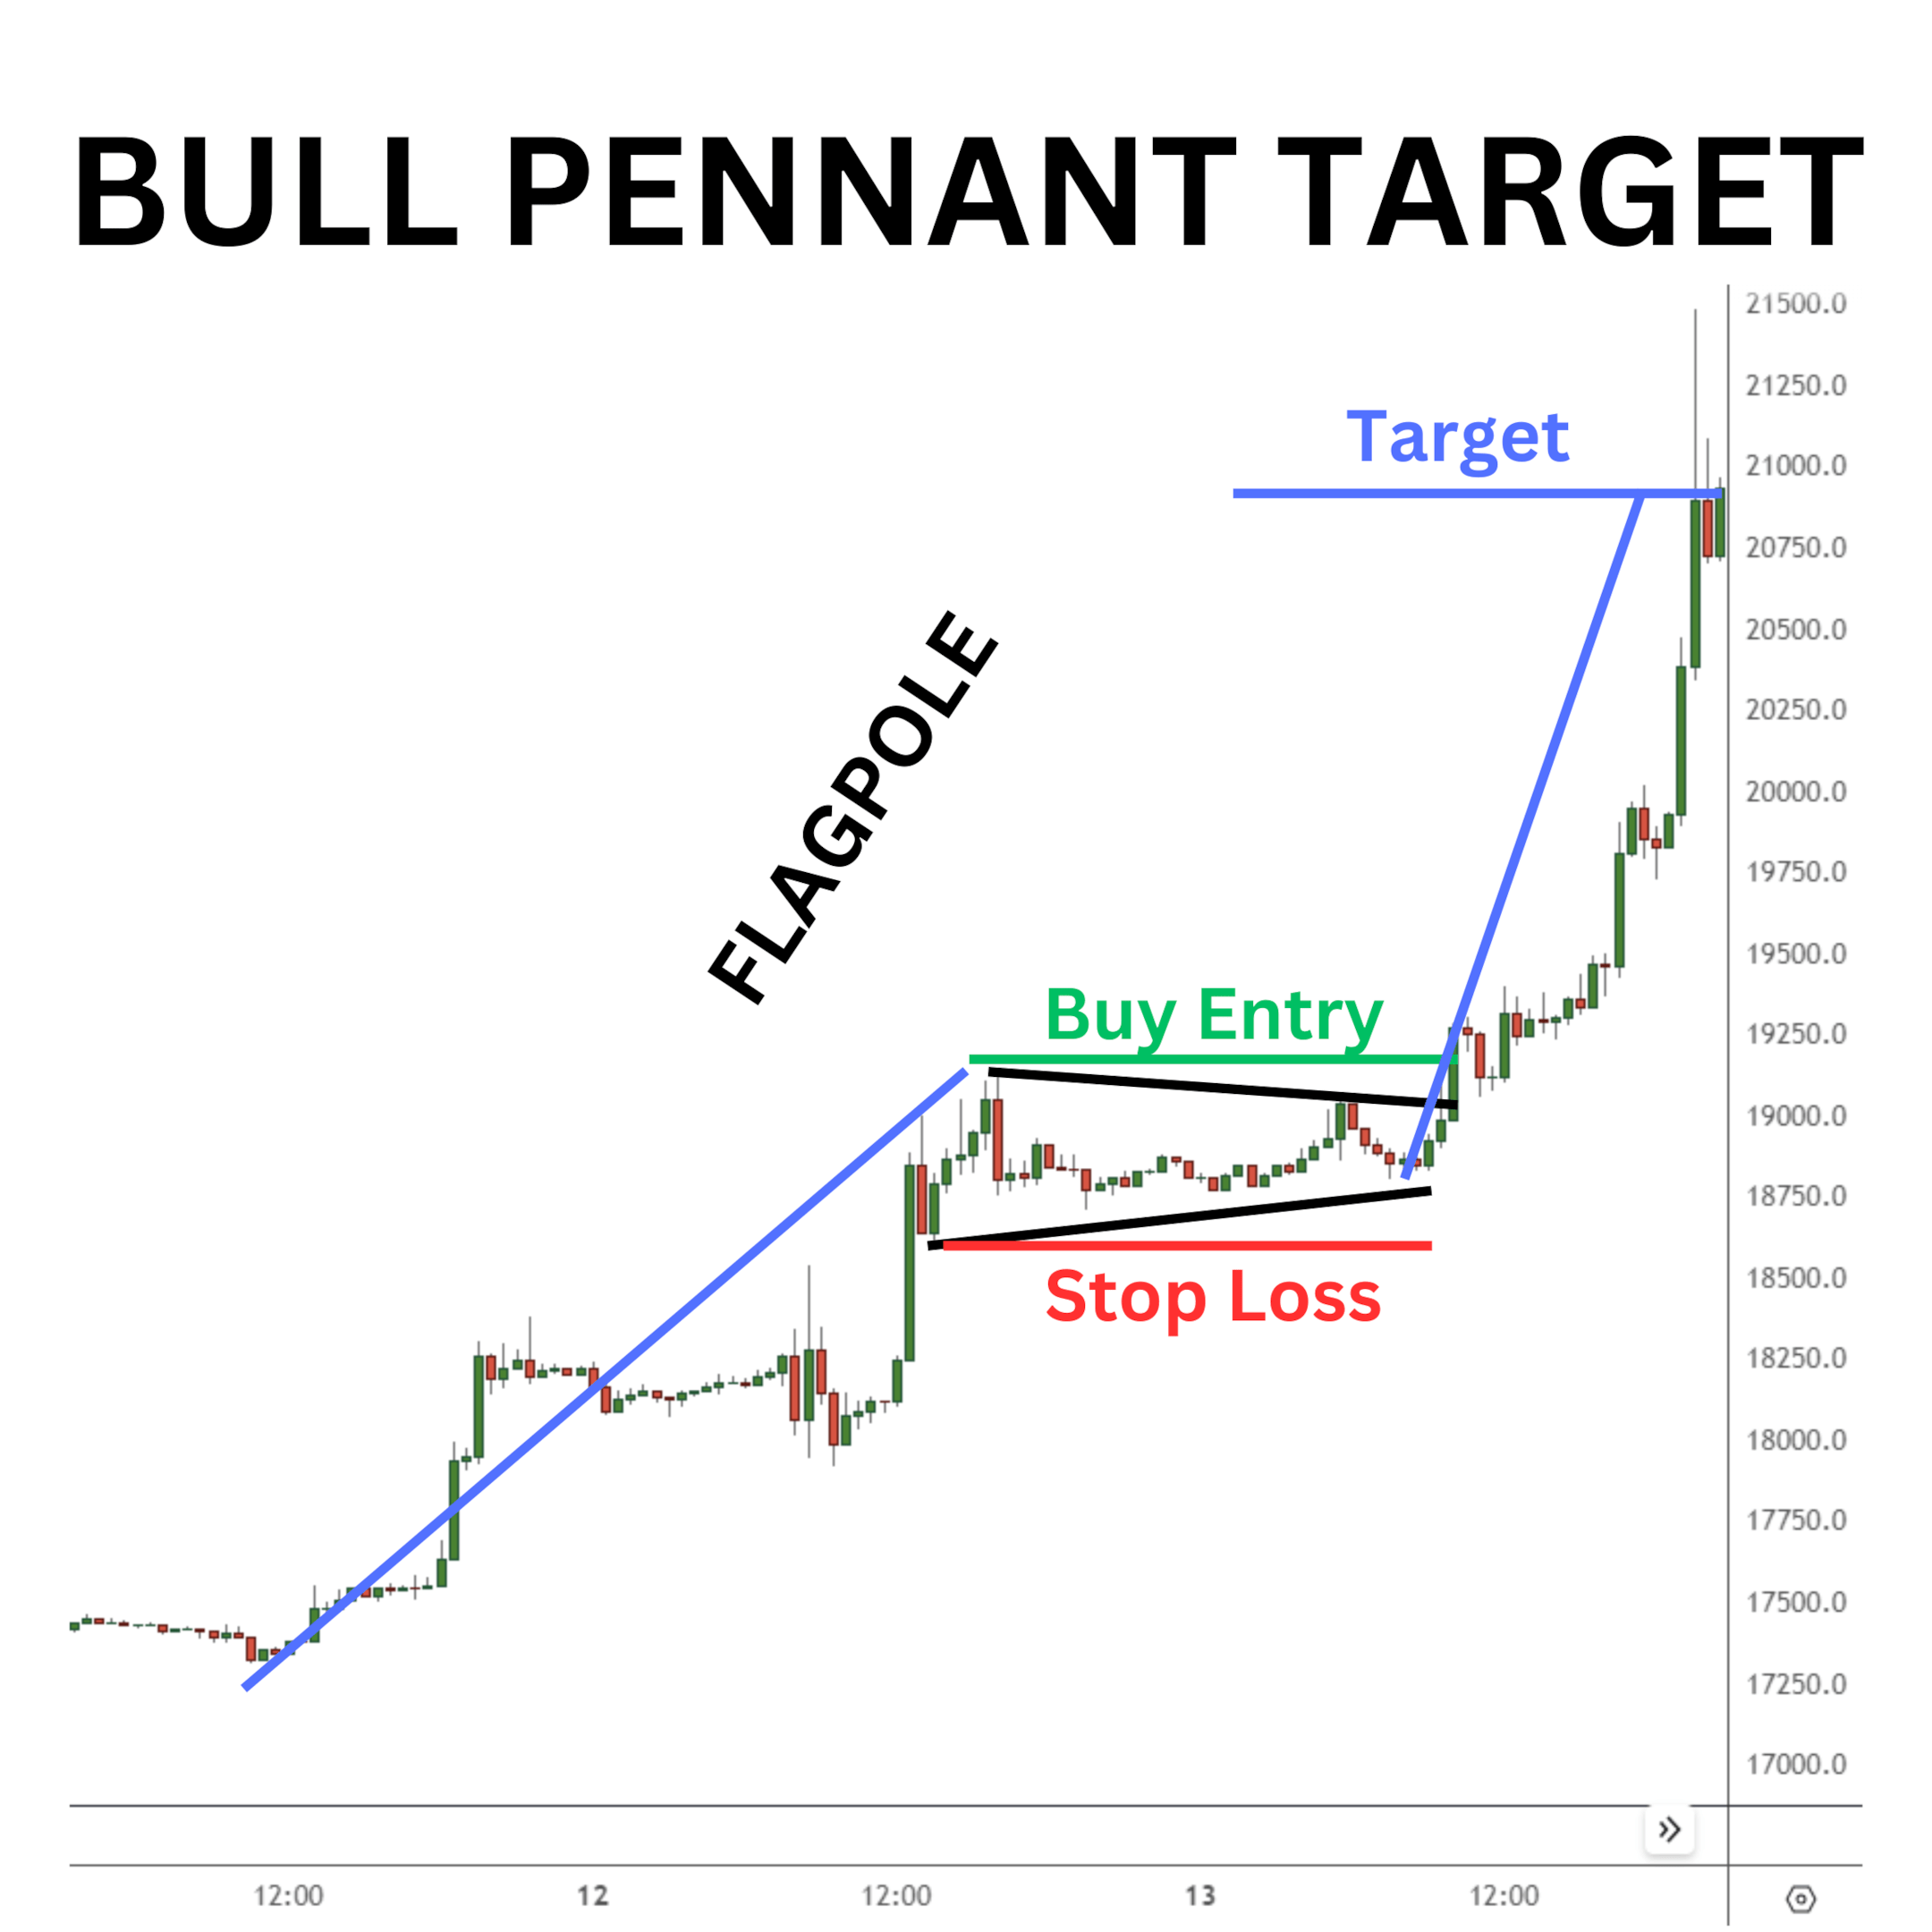
For BTC in the chart above, this places a take-profit target near $21,000.
In fact, a few days later BTC did rally quickly, topping near $21,500 a few hours later.
Advantages and Limitations of the Bull Pennant Pattern
Bull pennant patterns aren’t without limitations. For example, as the pattern develops, it might first look like a pennant, and morph into a flag, triangle or wedge. This is because the pennant is a short pattern, and could evolve differently than expected due to changing market conditions.
Additionally, if the triangle consolidation period becomes prolonged, the possibility of an upward continuation reduces. This also means the likelihood of an outright reversal increases, which can be frustrating for bullish traders.
To overcome this limitation, wait to trade as the price breaks to new highs rather than trying to time a buy entry at the triangle’s low. That way, you’re saved from a losing trade if the price action moves lower without breaking higher.
Another limitation of the bull pennant pattern is that if you follow it on minute charts, the data coming in is sparse, and the spotted pattern may be flawed. There simply isn’t enough data feeding into the market to create reliable signals. As a result, a smaller chart time frame carries significant risk even if a bullish breakout occurs.
The Bottom Line
Pennants are continuation patterns that can potentially lead traders to significant price movements. The structure of the pattern makes trading the bull pennant simple to achieve. Once spotted, the subsequent trades can establish excellent risk-to-reward ratio opportunities.
As a result of this simplicity, the bull pennant pattern is a favorite among crypto traders.
Candlestick Patterns Professional Traders Use
Best candlestick patterns — A curated list of candlestick patterns most frequently used by traders
How to Read Candlesticks in Crypto — Learn the basics of candlestick patterns
Crypto Chart Patterns — (Chart basics: Trend, neckline, wedges)
Doji — Basic candlestick unit
Bullish candlestick patterns
Bearish candlestick patterns
Other candlestick patterns
- Harami — Both bullish and bearish
- Hammer — Both bullish and bearish
- Double Top and Bottom — Both bullish and bearish
- Spinning Top — Both bullish and bearish
- Marubozu Candlestick — Both bullish and bearish
- Tweezer Top and Bottom — Both bullish and bearish
- Continuation Patterns — Determining a continuing trend
- Symmetrical Triangle — Both bullish and bearish
#Bybit #TheCryptoArk
