
Trading Tweezer Top and Bottom Candlestick Patterns in Crypto

Technical analysis is important not just for timing the market, but for helping investors identify market conditions and adapt to the volatility that’s driving today’s market. One of the core technical analysis components is chart patterns — such as the tweezer top and bottom, which help traders understand market sentiment.
The tweezer top and bottom are combinations of multiple candlesticks which usually appear at the end of an uptrend and downtrend, respectively, signaling a trend reversal. Therefore, investors can buy and sell a crypto asset more precisely by observing how these patterns appear on a chart. The following section includes a complete trading guide on using the tweezer top and bottom candlestick patterns in the cryptocurrency market, including a recommended buying and selling method.
What Are Tweezer Tops and Tweezer Bottoms?
A tweezer top is a combination of bullish and bearish candlesticks at a swing high that indicates a possible bearish pressure. In contrast, a tweezer bottom is a bullish reversal pattern at a swing low, showing possible bullish direction in price.
As the tweezer candlestick has both bullish and bearish formations, crypto investors can use it to identify both entry and exit levels, respectively. The tweezer top pattern appears at the top of a bullish trend, and indicates that bears have become interested in the price. As a result, it provides a sign that bulls should close their positions because there’s a high chance of a trend reversal.
The tweezer top pattern consists of a bullish daily candle followed by a bearish daily candle.
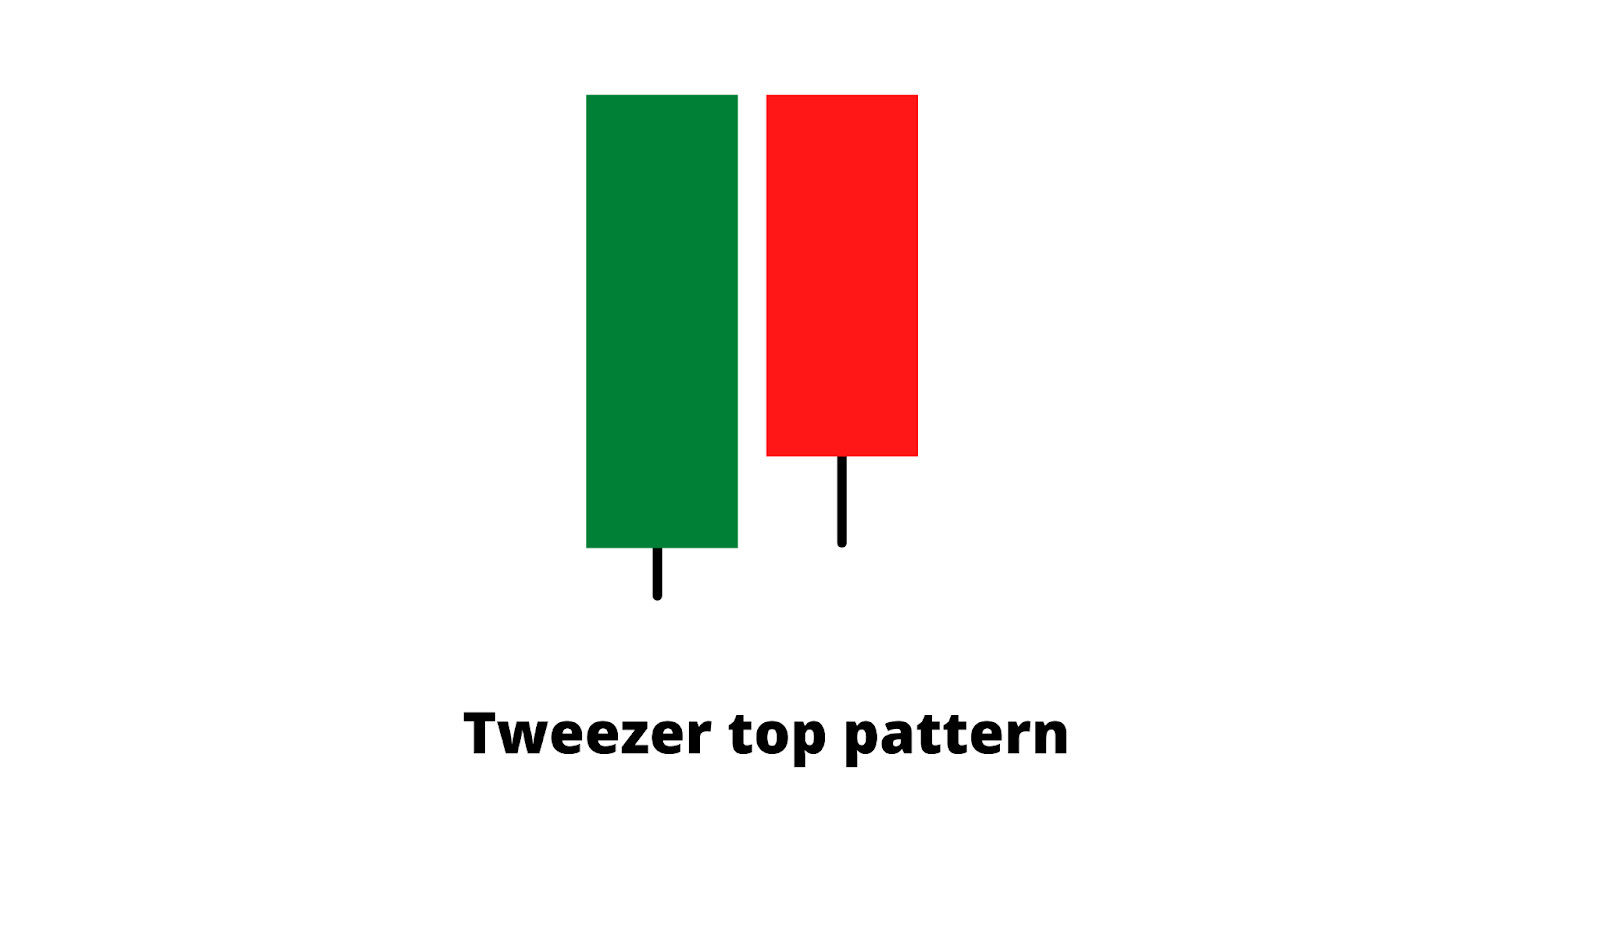
The tweezer top pattern tells a strong market story, as the existing bullish trend forms a solid green candle at a swing high. However, on the next day, the price drops lower instead of moving up, and closes the day with a bearish candle — indicating that bears have found the price to be discounted, and are interested in opening a sell position.
Now, let’s move to the tweezer bottom pattern, which is the opposite of the tweezer top. It appears at the bottom of a swing low, and indicates a bullish reversal.
The tweezer bottom pattern consists of a bearish daily candle followed by a bullish daily candle.
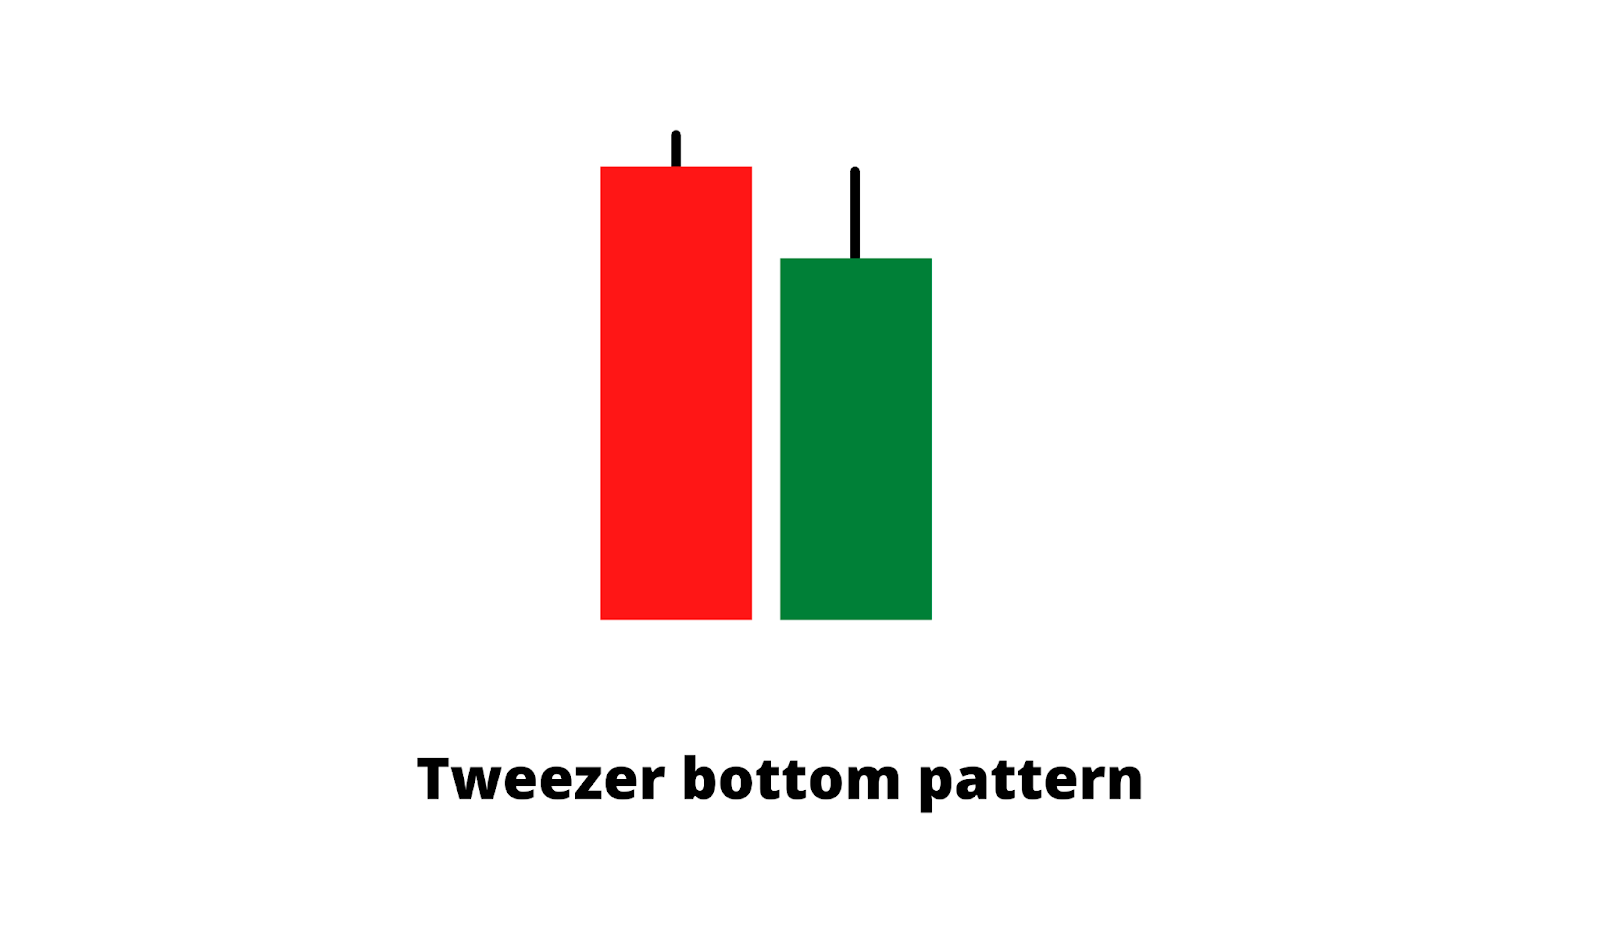
In cryptocurrency trading, the tweezer bottom pattern is significant because it’s directly related to a trading entry. It appears at a swing low with a strong bearish daily candle, indicating that bears are aggressive in the price. However, the price rebounds higher on the next day, due to buyers’ interest. Therefore, as soon as the second candle closes, investors may consider it a buying opportunity.
Pros and Cons: Using Tweezer Top and Bottom Patterns
Let’s look at the pros of the tweezer top and bottom patterns:
- Tweezer patterns are reliable price reversal patterns that place traders at the top of a new trend.
- The tweezer pattern can reliably explain buyer and seller sentiment.
- Tweezer patterns from a necessary support and resistance level increase the trading accuracy of other indicators and methods.
- This trading strategy integrates well with other indicators.
There are also some downsides to using the tweezer top and bottom patterns:
- It can be tricky to rely on trend reversal just by looking at two candles. The addition of increased volatility indicates a highly probable price reversal.
- If the tweezer pattern forms against a major trend, it may not work as well.
- Tweezer patterns occur regardless of market volatility and uncertainty.
- Investors should use other indicators besides the tweezer pattern to increase its accuracy.
How to Identify Tweezer Tops and Bottoms
Spotting tweezer top and bottom patterns on a naked chart are easy. Each version of the pattern consists of two long-bodied candlesticks, appearing in parallel but opposite directions.
Finding a solid trend is the primary requirement for the tweezer trading method. When the market is moving up, prices continue to increase. However, a sudden bearish candlestick similar to the latest bullish candlestick appears and negates the bullish momentum. This is how a tweezer top pattern appears, indicating a bearish pressure.
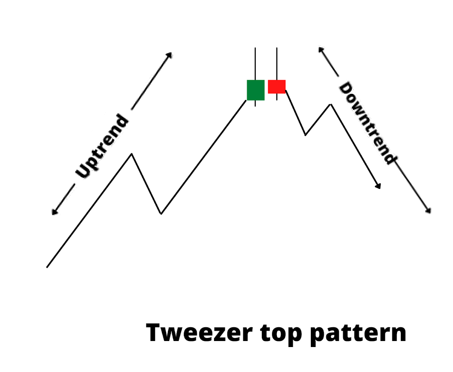
The above image illustrates the primary way to identify the tweezer top pattern in an uptrend market.
The tweezer bottom pattern is the opposite version of the tweezer top and appears in a downtrending market. Price keeps moving down when suddenly, a bullish candlestick appears which seems similar in size to the previous bearish candle. As a result, a tweezer bottom forms, indicating a possible bullish trend.
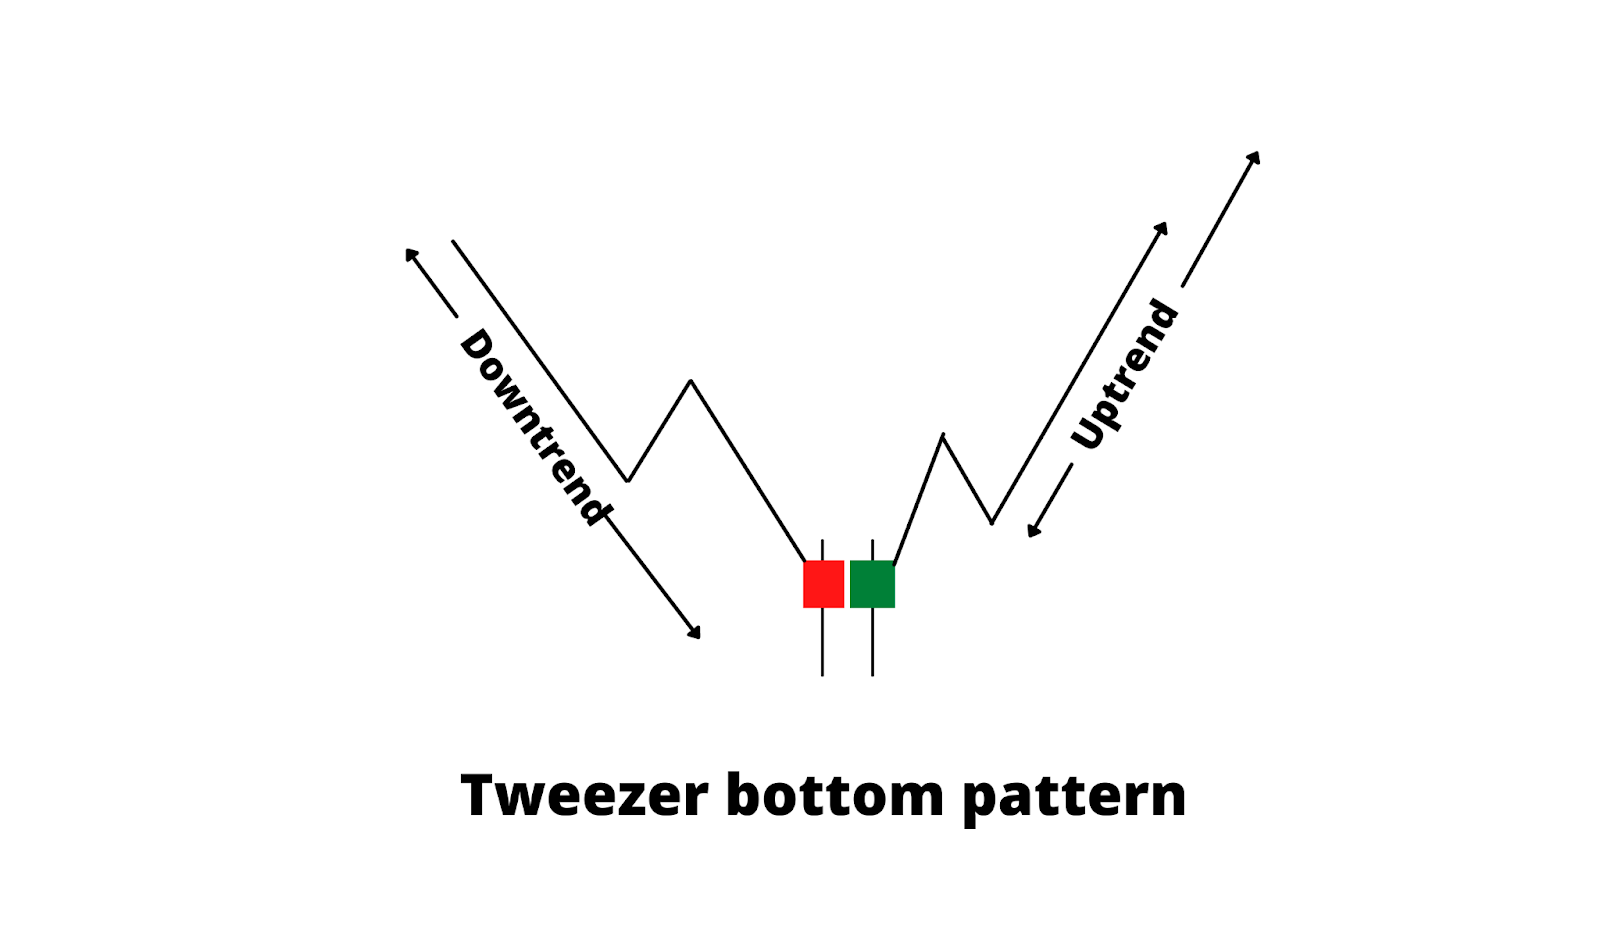
The above image illustrates the primary way to identify the tweezer bottom pattern in a downtrending market.
Let’s review the key characteristics of the tweezer top and bottom patterns:
- For the tweezer top, the first candle is bullish, and the second candle is bearish.
- The second candle’s high shouldn’t exceed the first candle’s high.
- For the tweezer bottom, the first candle is bearish, and the second candle is bullish.
- The second candle’s low shouldn’t exceed the first candle’s low.
How to Trade Tweezer Patterns
The tweezer candlestick is a reversal pattern, so investors should identify where the trend is heading before making a trade. Uptrending and downtrending markets are easy enough to identify by looking at swing levels. Therefore, investors should know how higher highs and lower lows form in the price chart.
Now, let’s move to the step-by-step approach to make a trade using the tweezer pattern:
Step 1: After finding the market trend, investors can spot the point of interest area, which is the supply or demand zone from which the price showed a strong reaction before. Therefore, investors should mark critical levels from where a significant market reversal may occur.
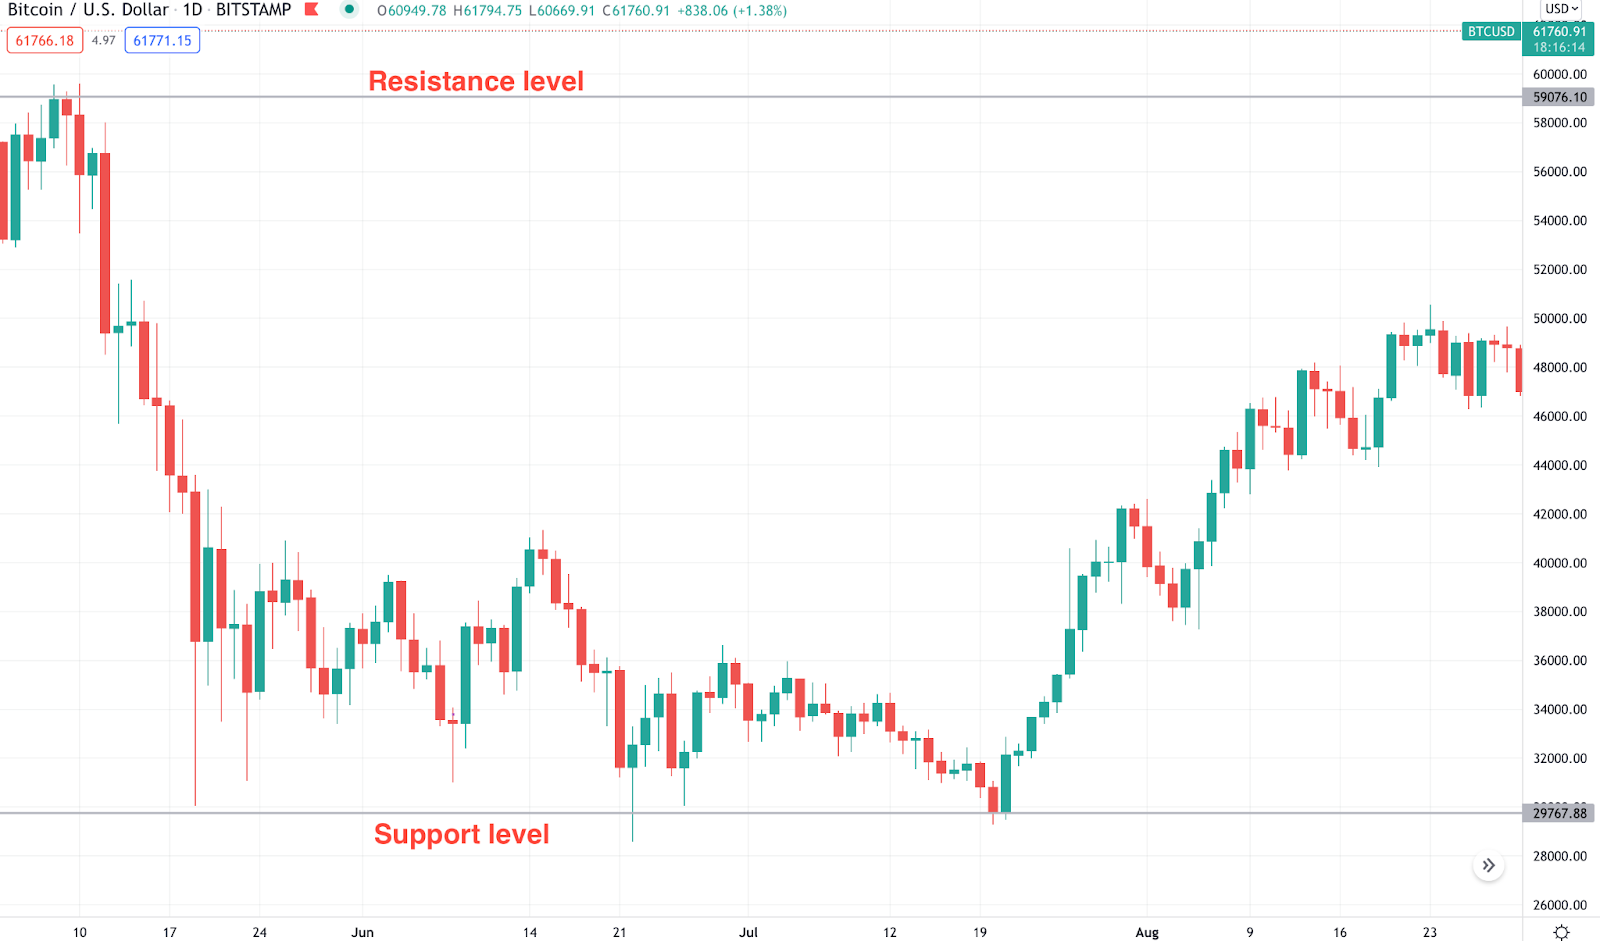
The above image shows how support and resistance levels look at the top and bottom of a trend.
Step 2: After finding swing levels, identify the tweezer top from the resistance level, and the tweezer bottom from the support level. Make sure that the trading entry is valid once the second candle has closed.
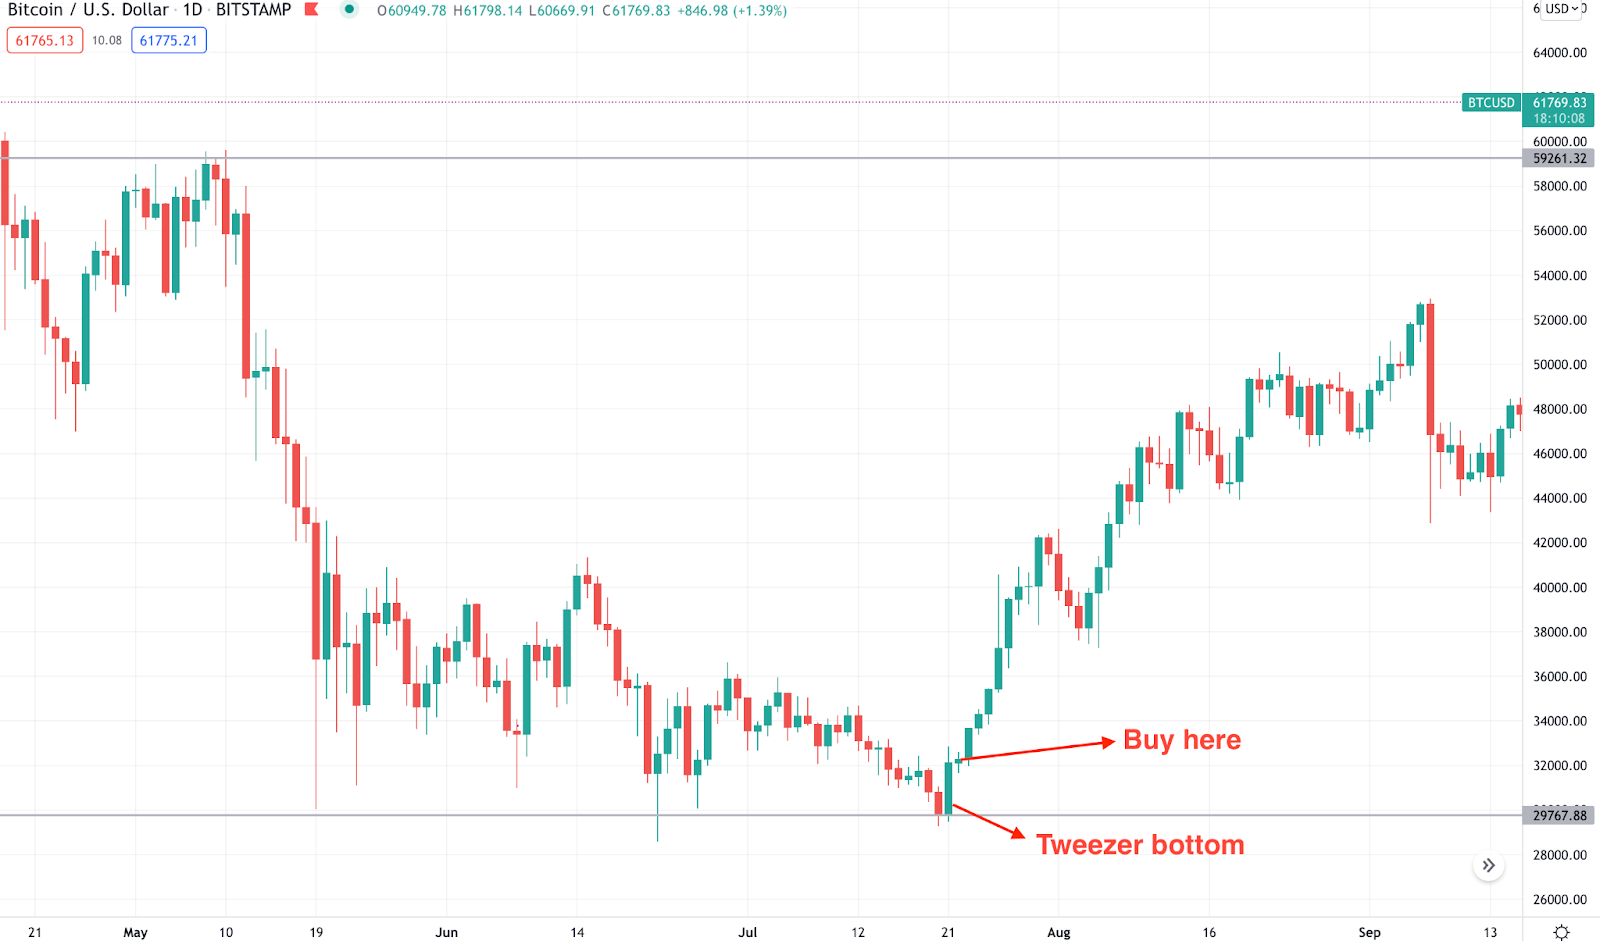
The above image shows how the tweezer bottom appears at the support level, offering a fantastic bullish reversal. As the tweezer is a trend reversal method, traders can enter right at the start of a new trend. In this way, the tweezer can offer a higher return against a small risk. The ideal stop-loss level is below the tweezer bottom low (with some buffer).
Now, let’s look at an example of a tweezer top pattern from an actual chart:
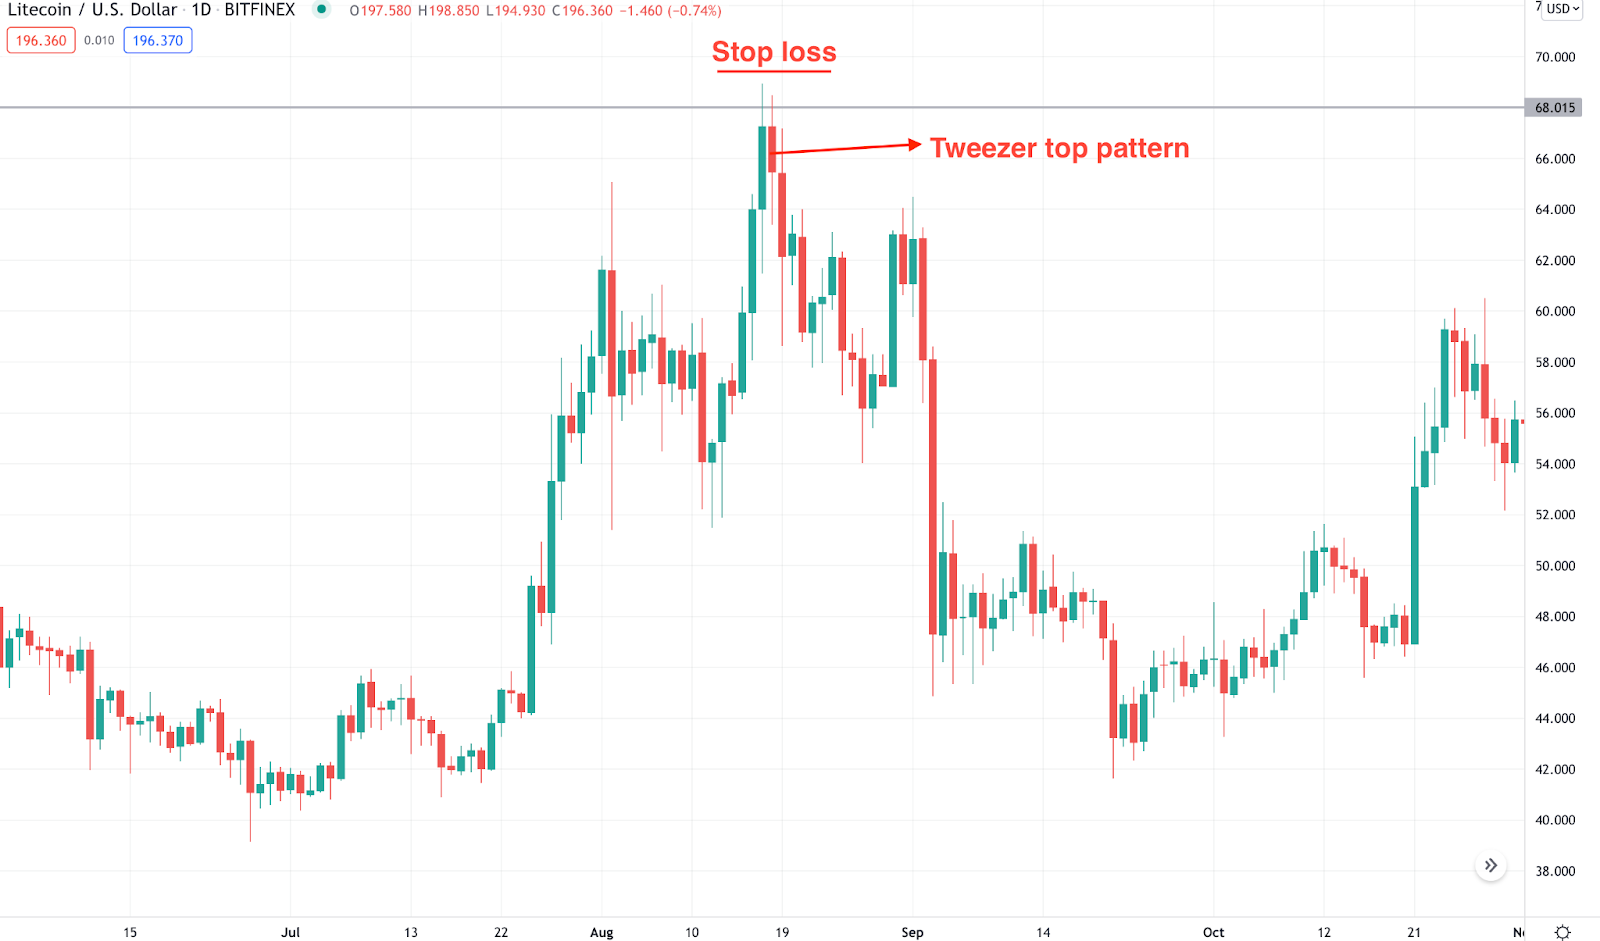
In the above daily LTC/USD chart, the price moves up and forms a tweezer top pattern at the resistance level. Accordingly, the price moves lower with a decent profit. Using this method, the sell entry is valid from the second candle’s closing, and the stop-loss should be set above the first candle’s high.
How Reliable are Tweezer Tops and Bottoms?
In financial trading, investors are advised to use multiple methods to increase the probability of a trading entry. Using tweezer patterns are a reliable way to catch a trend from its beginning. But can a trader rely only on the tweezer method in order to make a successful trade?
When a tweezer top appears at a swing high, it indicates that bulls are getting out of the market — and bears may be taking over. The reverse is true for a tweezer bottom at a swing low. Therefore, investors should manage their trades by closing a profit and moving the stop-loss to break-even. Overall, the tweezer trading method is profitable — provided that traders can match this pattern with other signals for additional confirmation like support, resistance, market context, volume or trend.
Tweezer Candlestick vs. Other Trend Reversal Patterns
Let’s compare the tweezer candlestick with other patterns, so that investors can make more strategic trading decisions.
Tweezer Top vs. Head and Shoulders
The head and shoulders pattern is a series of price actions that explains how and where bulls are failing to regain momentum as bears take control over the price. However, this method needs considerable time to complete, as the trading entry only becomes valid once the price breaks out from the “neckline.”
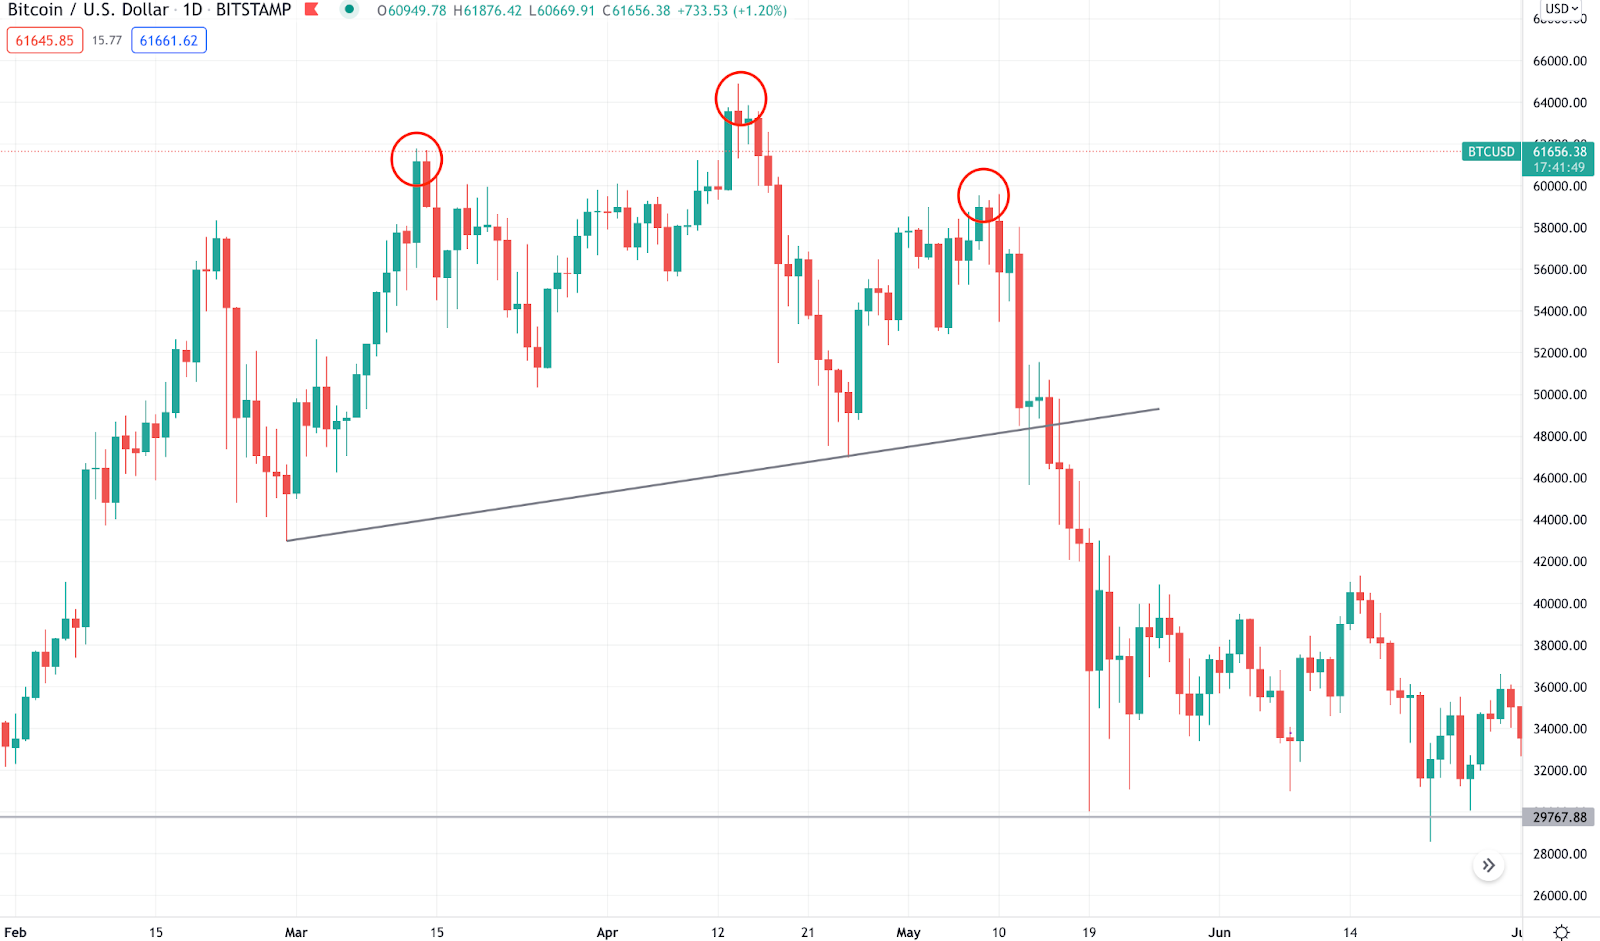
The above BTC/USD chart shows a head and shoulders pattern forming. It becomes valid after breaking below the neckline. However, this is a daily chart, and it takes almost two months to complete the pattern. Therefore, investors who focus on using the head and shoulders pattern in their trading have fewer trading opportunities than the tweezer top offers.
Tweezers vs. Morning and Evening Stars
The morning star and evening stars are reversal patterns which form at swing lows and swing highs, respectively. The main difference between these patterns and the tweezers is that morning and evening stars have three candlesticks, which can explain investors’ sentiment more accurately than tweezers patterns, which have only two.
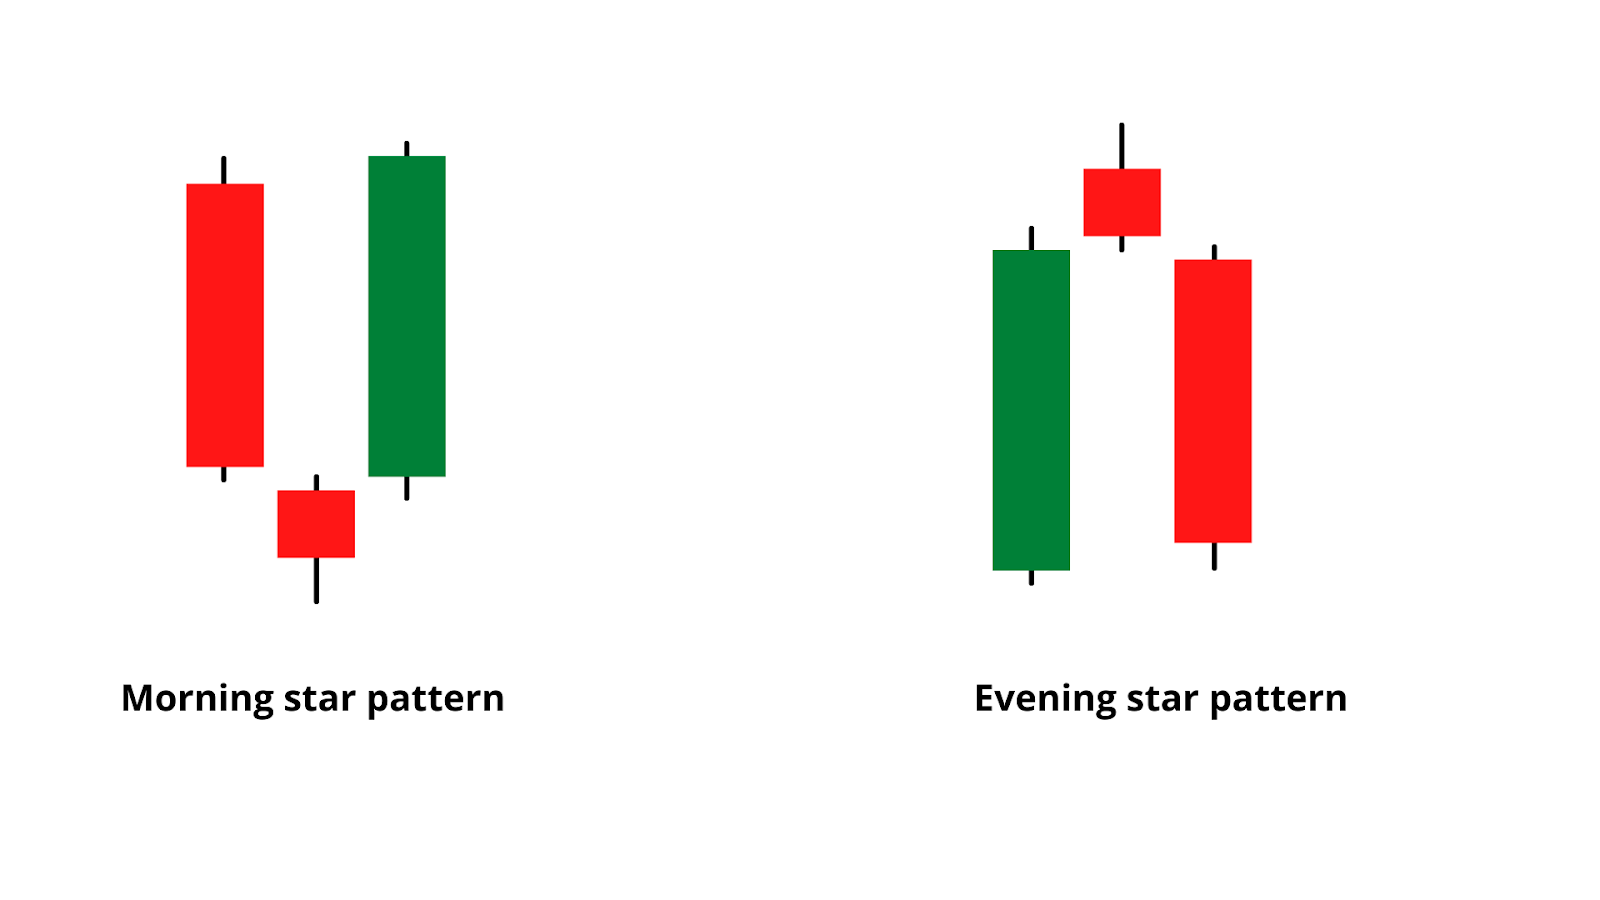
The above idealized images show the morning star and evening star patterns. The morning star pattern features a strong bearish daily candle, indicating a significant selling pressure in the price. The small bearish daily candle which follows it indicates that the price is still in bear territory, but with weak momentum.
Finally, a large bullish daily candle closes at the first day’s high on the third day. The weakness of sellers and the strength of buyers is the major indication of the price reversal.
In tweezer patterns, comparable price action occurs, but it takes two days to change the momentum instead of three. Therefore, we can consider morning stars and tweezer patterns to be similar indicators, since both of these patterns feature a strong price reversal. If a price reversal takes too long for a tweezer pattern to emerge, it may still form a morning or evening star pattern.
Tweezer Bottom vs. Three White Soldiers
The three white soldiers is a bullish reversal pattern which appears at a swing low. This pattern starts with a bearish daily candle, which attracts sellers. However, a small bullish candle appears the next day, which can be thought of as a correction to the previous bearish candle. Two consecutive bullish candles appear on the next two days, closing the action above the first day’s high. It’s clear that the selling momentum on the first day is eliminated with three bullish candles which close the third day above the first candle’s high.
Let’s see what the three white soldiers pattern looks like:
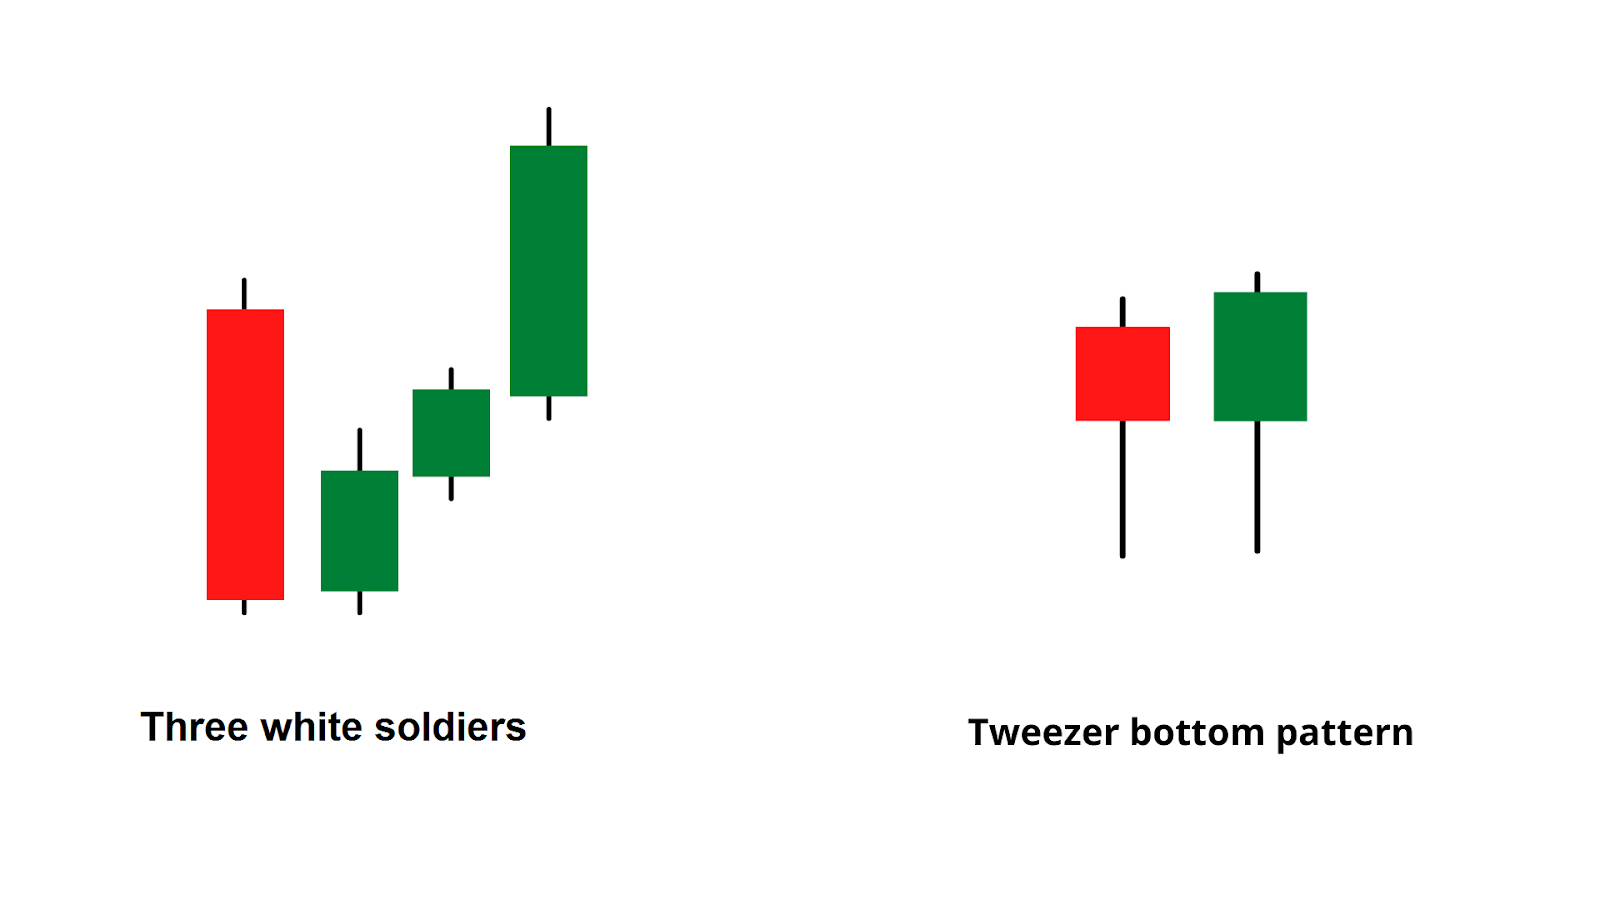
Both the three white soldiers and tweezer bottom candlestick patterns are bullish reversal patterns. Once they appear at a support level, the price becomes attractive to bulls. Again, these patterns have a high level of accuracy, but investors should consider other confirmation from trend, volume, price context, etc.
The Bottom Line
The tweezer top and bottom candlestick patterns yield reliable exit and entry points, respectively, in any trend-reversal trading strategy. Therefore, the best approach for using this indicator is to combine it with other technical analysis indicators to increase its efficiency. However, before following these candlestick patterns with real money, it’s recommended that investors practice using a demo account.
When using the tweezer candlestick patterns for trading, keep in mind the following rules:
- Avoid trading during uncertain market conditions or essential news releases.
- Do not trade this trend reversal pattern during a sideways trend.
- Make sure to use other trading tools besides the tweezer pattern — such as MACD, Moving Average — to increase your trading accuracy.
Candlestick Patterns Professional Traders Use
Best candlestick patterns – A curated list of candlestick patterns most frequently used by traders
How To Read Candlesticks Crypto – Learn the basics of candlestick patterns
Crypto Chart Patterns (Chart basics: trend, neckline, wedges)
Doji Candlestick – Basic candlestick unit
Bullish candlestick patterns
- Inverted Hammer Candlestick
- Bullish Engulfing Candlestick
- Cup and Handle Patterns
- Morning Star Pattern
- Three White Soldiers Pattern
- Triple Top Pattern and Triple Bottom Pattern
- Falling Wedge Pattern
- Dragonfly Doji Candlestick
Bearish candlestick patterns
- Bear Flag Patterns
- Gravestone Doji Candlestick
- Head and Shoulders Pattern
- Dark Cloud Cover Pattern
- Shooting Star Candlestick
- Rising Wedge Pattern
- Hanging Man Candlestick
- Bear Pennant Pattern
- Evening Star Pattern
- Triple Top Pattern and Triple Bottom Pattern
Other candlestick patterns
- Harami Candlestick – Has both bullish and bearish candlestick
- Hammer Candlestick – Has both bullish and bearish candlestick
- Double Top and Double Bottom – Has both bullish and bearish candlestick
- Spinning Top Candle – Has both bullish and bearish candlestick
- Marubozu Candlestick Pattern – Has both bullish and bearish candlestick
- Continuation Patterns – Determining a continuing trend