
Pennant Chart Pattern: What Is It & How to Use It For Crypto Trading?

The pennant chart pattern is a consolidation pattern that falls under the trend continuation category. It is formed over a shorter duration than some chart formations and is typically seen in more aggressive trading environments. Typically, the pennant forms around the halfway point of a developing trend. A breakout of the pennant provides an entry signal in the direction of the trend.
In this article, we will review the identification and use of the pennant, how to trade the price formation and discuss the pennant relative to other common chart patterns.
What Is A Pennant?
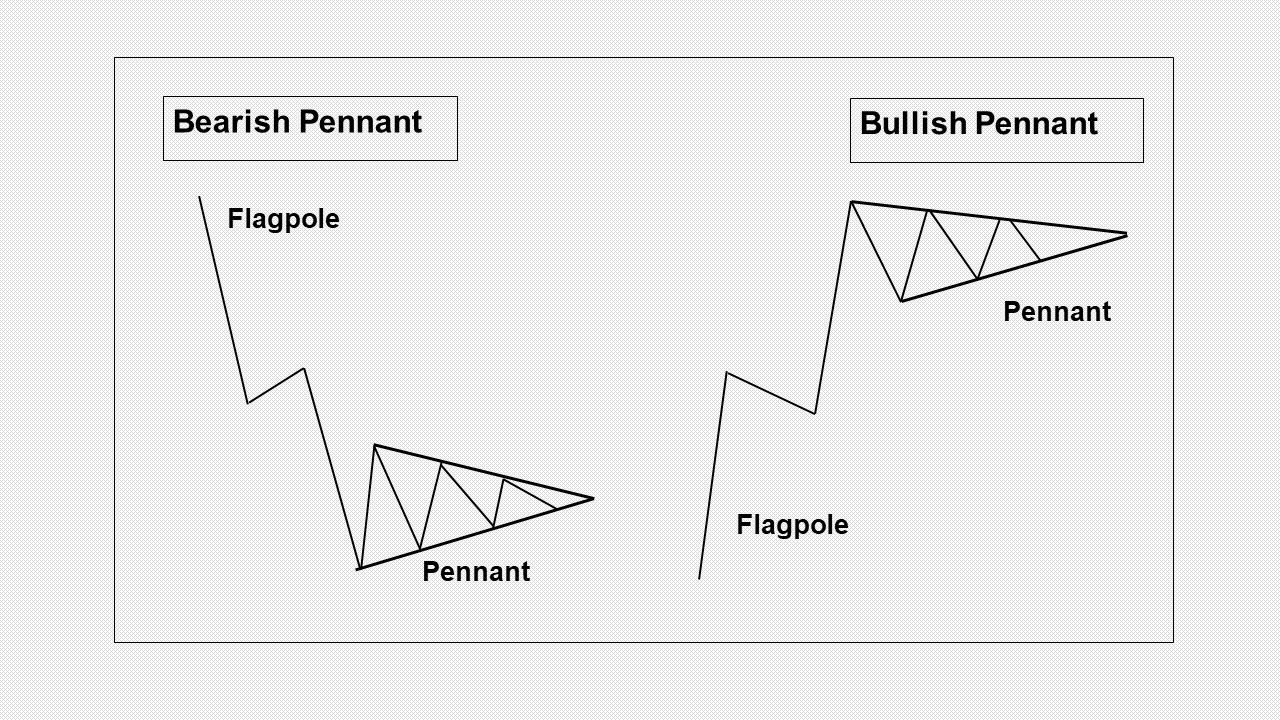
The pennant chart pattern is a trend continuation pattern that occurs in both bullish and bearish markets. It is formed following a sharp advance of trend, either up or down, as the price starts to trade in a tightening range that takes the form of a small symmetrical triangle. Frequently, it occurs in the middle of a price move which identifies the beginning of the second half of a trend.
It is a fairly common pattern and can occur relatively frequently in all time frames, but is seen more often in short-term timeframes. Pennants are similar to flag patterns as far as they each have a sharp rally creating a flagpole before the consolidation phase. Two trend lines identify the boundary of the pennant, with an upper trend line across the top angled downward and a lower trend line across the bottom angled upward so that they will cross at the apex of the triangle and point horizontally.
Formation of the Flagpole
For a proper pennant to occur, it needs to be preceded by a sharp and steep rally (bull market) or a steep and sharp decline in price (bear market).You should see signs of aggressive buying (bullish pennant) or selling (bearish pennant) with strong relative volume prior to the pennant being formed.
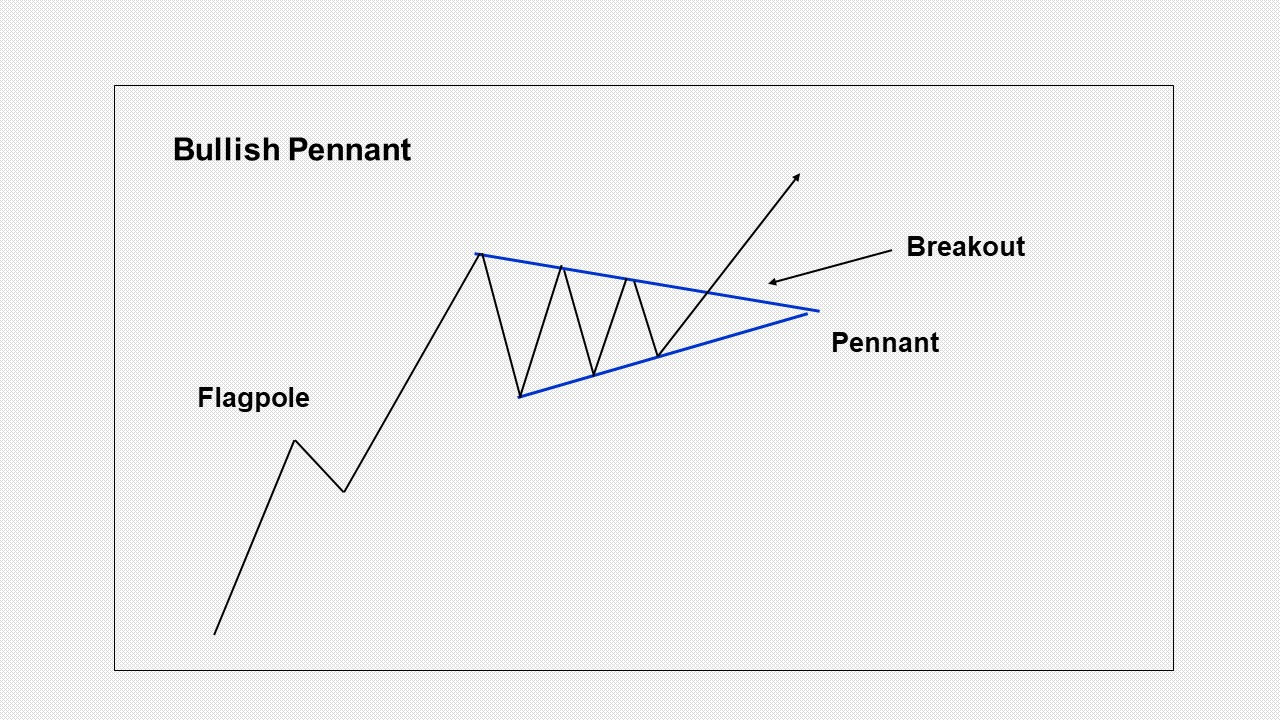
Pennant Breakout
A breakout will typically occur in the direction of the trend before the pennant formation. The aggressiveness of the prior trend is an important clue as to what to expect once the price moves out of the formation. More aggressive trends that occur before the pennant forms tend to have more powerful subsequent moves.
A proper pennant usually consolidates for a couple of weeks and up to three weeks maximum. If it goes longer than that it is likely evolving into a larger pattern, such as a symmetrical triangle, or it could lead to a failure. A failure is when the price moves in the opposite direction from what is anticipated.
During the formation of the pennant, the volume should decline. However, upon a breakout, the volume should spike reflecting enthusiastic buyers or sellers and the chance for a sustained move up or down. The extended breakout period is why traders are so fond of using this pattern.
Pennant Pattern vs. Wedge Pattern
The pennant pattern is used as a trend continuation pattern whereas the wedge pattern can be both a trend continuation and a reversal pattern. Also, there is no requirement for a flagpole with the wedge. A preceding trend is all that is needed.
Pennant Chart Pattern | Wedge Chart Pattern |
Trend continuation. | Trend continuation or reversal. |
Forms a small horizontal symmetrical triangle. | Forms a small symmetrical triangle slanted up or down. |
Forms within 3 weeks. | Forms within 1 to 3 months. |
Preceded by a sharp steep move in price. | Preceded by a clear trend in price. |
Pennant Pattern vs. Symmetrical Triangle Pattern
Both the pennant and symmetrical triangle patterns are trend continuation patterns and are similar in that they each take the shape of a symmetrical triangle. The primary difference is that the size of the pennant triangle is smaller than the symmetrical triangle. Also, the pennant requires a sharp steep trend preceding the consolidation whereas the symmetrical triangle just needs to be in a trend of some sort.
Pennant Pattern | Symmetrical Triangle |
Forms a small symmetrical triangle. | Forms a larger symmetrical triangle. |
Short-term. | Longer term. |
Prior trend (flagpole) should be sharp and steep. | Does not have a flagpole. Trend needs to exist but it doesn’t need to be sharp and steep as with a pennant. |
Pennant Pattern vs. Flag Pattern
Pennants and flags are each considered to be trend continuation patterns and they include a consolidation phase. The primary difference is the shape of the consolidation following a flagpole as noted below.
Pennant Pattern | Flag Pattern |
Forms a small symmetrical triangle. | Forms a small parallel channel. |
Sideways slant. | Slanted towards trend. |
Boundary lines head towards each other and will converge to form the apex. | Slanted rectangle shape with parallel boundary lines. |
How to Trade with the Pennant Pattern
The pennant is traded on a breakout in the direction of the trend. However, there are several entry strategies you can take to ride the trend.
Depending on whether it is a bullish or bearish pennant, enter on initial breakout/breakdown once the boundary line is busted in the direction of the trend.
Enter on breakout/breakdown of the high or low of the pennant.
Enter on the initial pullback and subsequent trend continuation following the initial breakout.
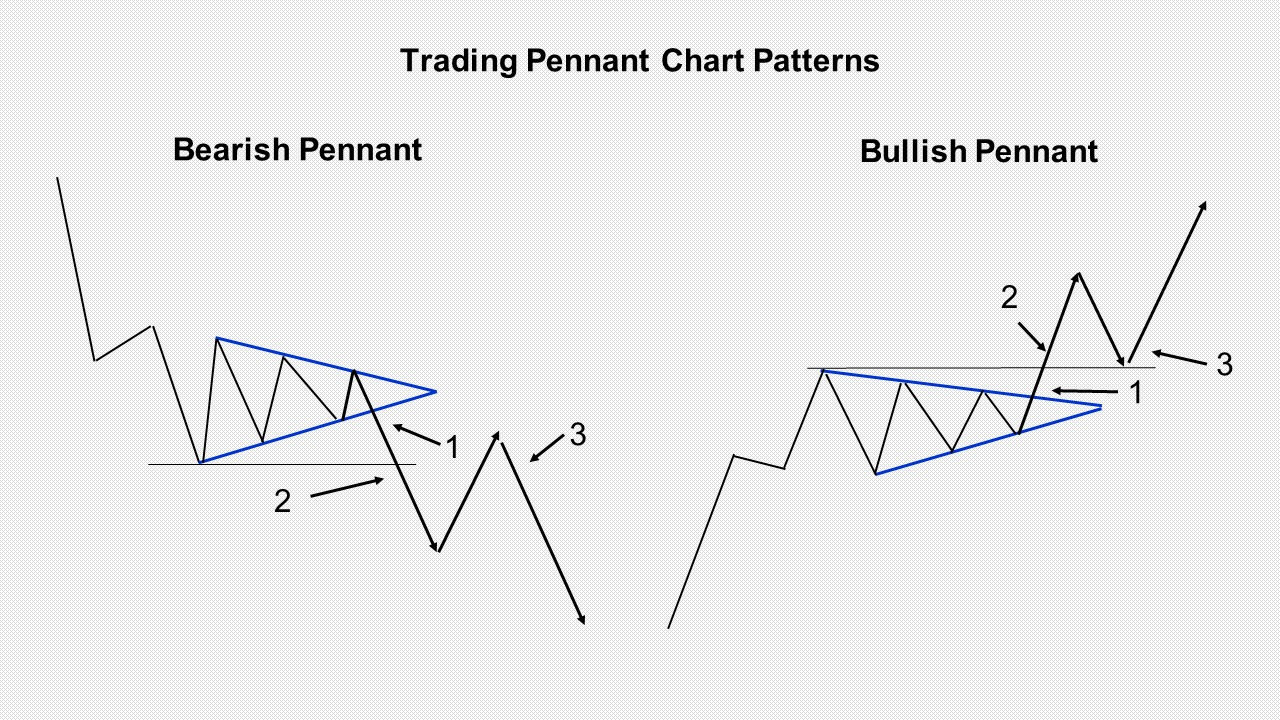
A measuring objective for the pattern is made by taking the distance from the start of the flagpole up to the top (bull market) or bottom (bear market) of the pole prior to the pennant being formed. It should start once the sharp move breaks a resistance or support level. The distance is measured either to the top or bottom of the pennant depending on the trend direction.
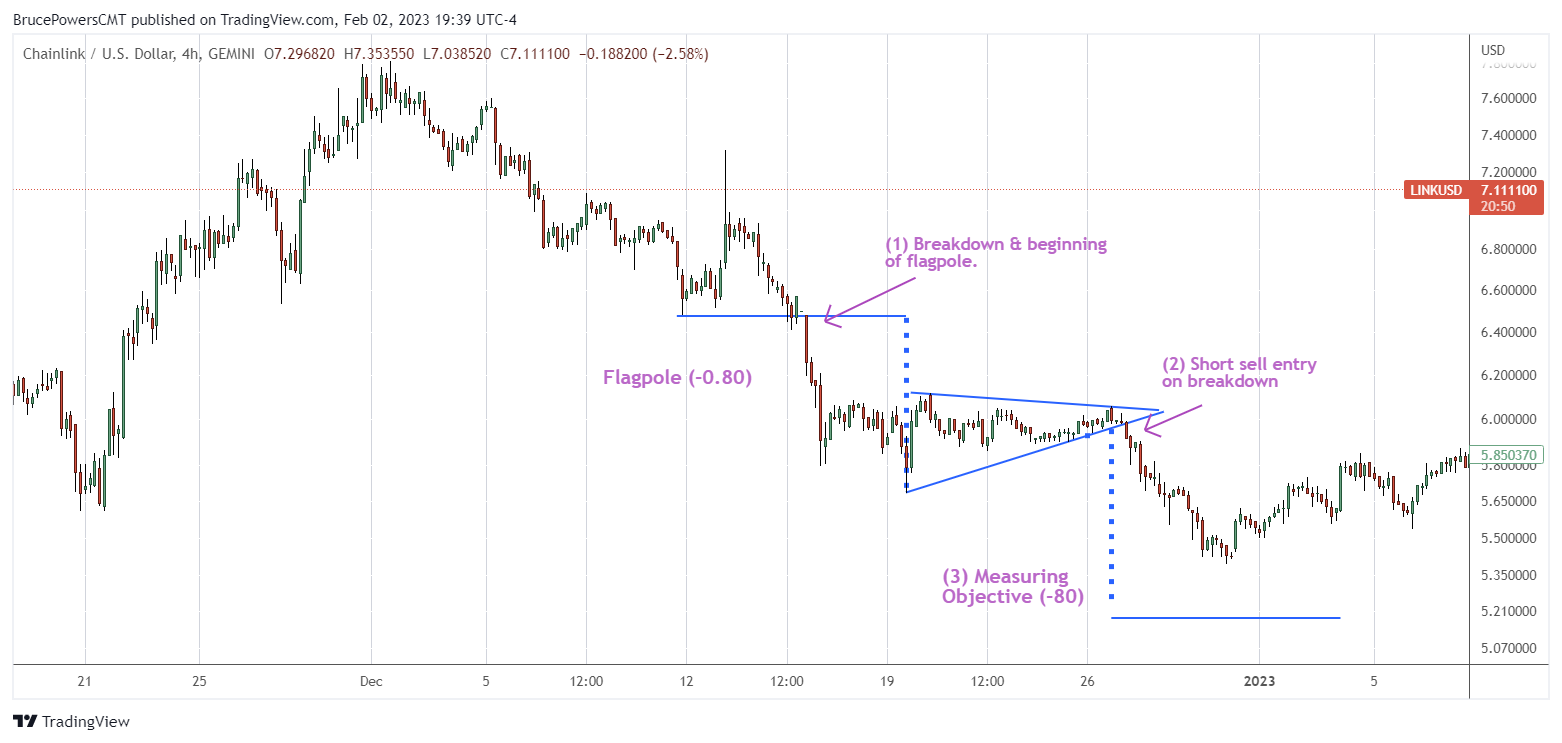
The following example looks at a classic entry on breakout for a bearish pennant. The flagpole is measured from where it broke down at $6.48 (1) to the bottom of the pennant at $5.68, for a drop of $0.80. We then subtract $0.80 from the breakdown trigger of $5.98 (2) to arrive at a measuring objective of $5.18 (3). You then place your initial stop just above the resistance trendline to cut losses. For bullish pennants, you should place your stop beneath the support trendline.
Is Pennant Pattern Reliable?
John Murphy, author of the classic technical analysis book Technical Analysis of the Financial Markets writes that the pennant pattern is one of the more reliable trend continuation patterns in technical analysis. Yet, a study by Thomas N. Bulkowski in his book Encyclopedia of Chart Patterns found it less reliable than some other patterns.
Bulkowski tested the performance of over 1,600 pennant patterns identified with particular parameters for consistency. He found that the breakout failure rate for both up and down moves was 54% for each direction with the average move following a trigger around 6.5% (initial move). Meanwhile, the success rate was 35% for upside moves and 32% for downside moves. Of course, the above analysis reiterates the reason why active risk management is critical for trading success as patterns often fail.
Keep in mind the pennant results may be a little low as Bulkowski notes that tests for the pennant only looked at short-term price swings, not the change from the breakout to the eventual high or low, as he did for other pattern tests. With this, it is assumed that the results could improve if larger moves were taken into account.
Frequently, traders will use pennants along with other forms of technical analysis to assist their decision-making process and improve their chances of success.
What Is a Bullish Pennant Pattern?
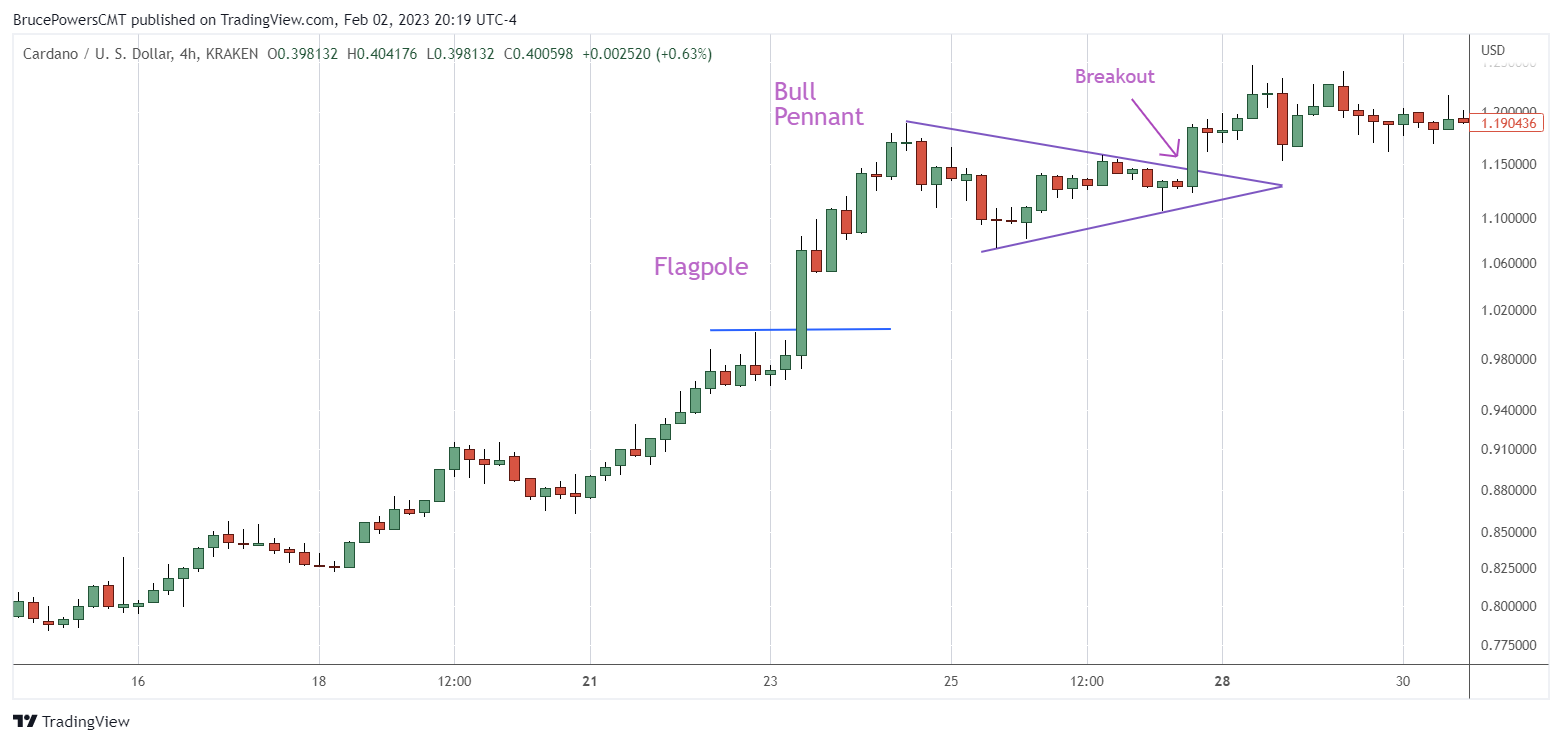
A bullish pennant occurs within an uptrend and starts with a sharp, steep rally called the flagpole. It is followed by a short period of consolidation that takes the form of a pennant or small symmetrical triangle. The bullish pennant is formed as price rests before it continues its rally to higher prices.
What Is a Bearish Pennant Pattern?
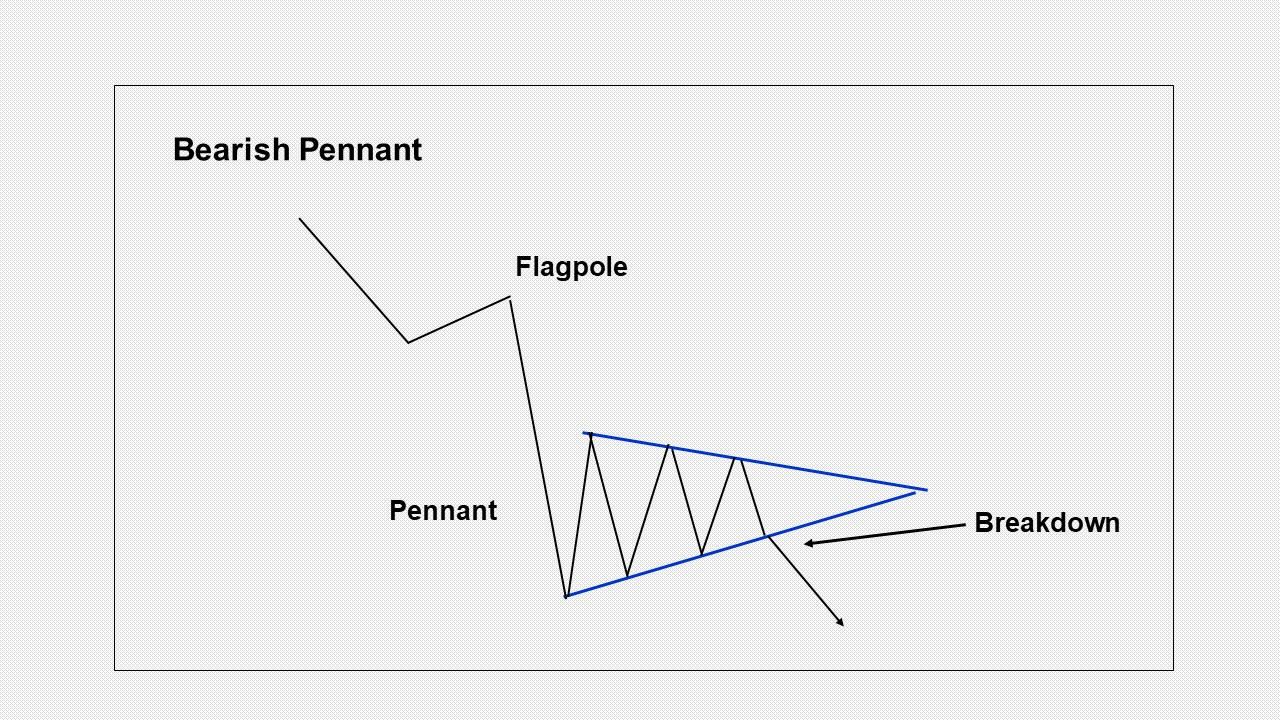
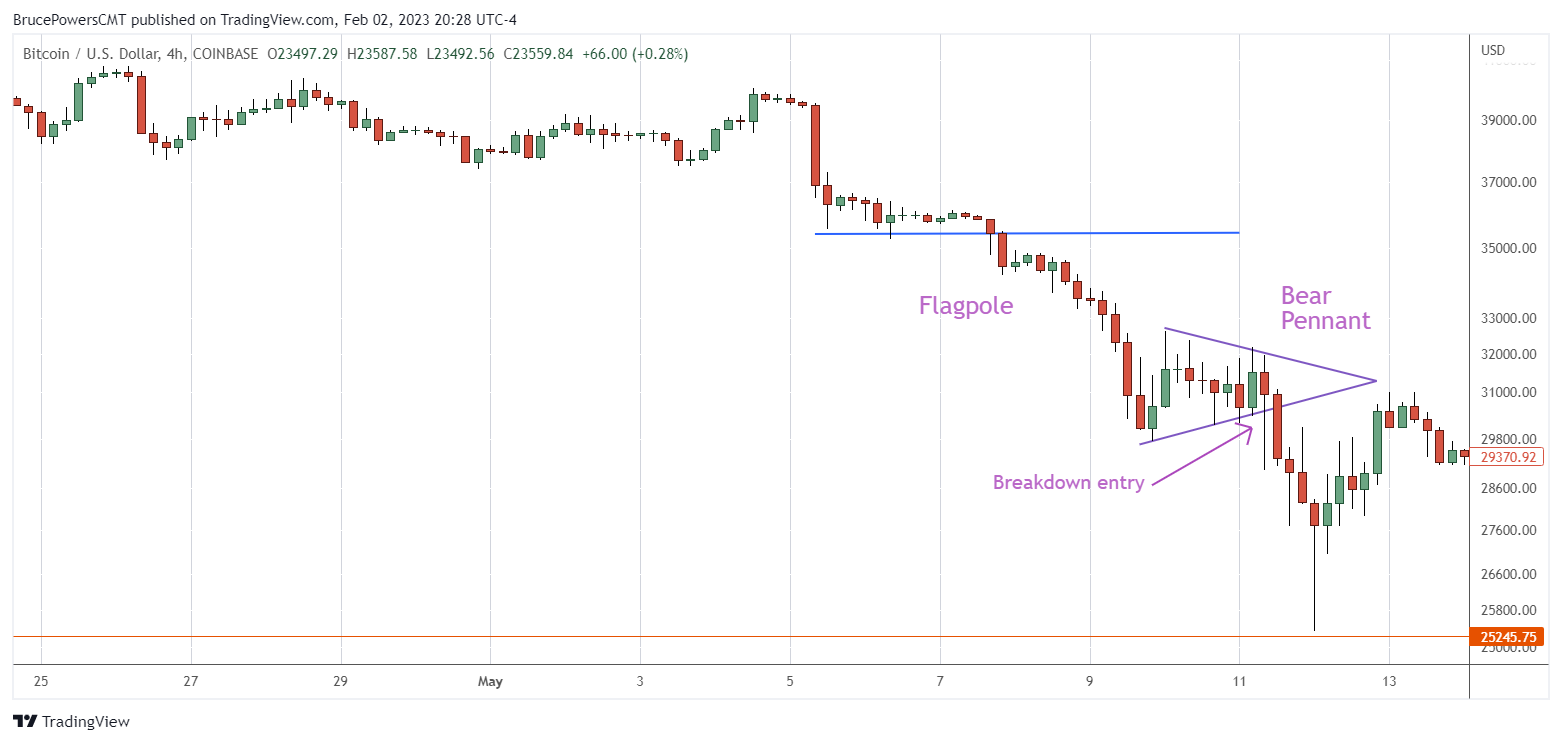
A bearish pennant is found in a downtrend and begins with a sharp, steep decline that forms the flagpole. It is followed by a short period of consolidation to form a pennant. The bearish pennant forms as price rests before it returns to its decline to lower prices. Once the price breaks below the lower boundary line, a bearish short-sell signal is triggered.
Bullish Pennant vs. Bearish Pennant
Bullish Pennant | Bearish Pennant |
Bullish trend continuation pattern. | Bearish trend continuation pattern. |
Targets higher prices. | Targets lower prices. |
Entry on upside move. | Entry on downside move. |
Flag distance is added to breakout price level. | Flag distance is subtracted from breakdown price level. |
Despite their differences, the same approach can be applied to both bullish and bearish pennant patterns when trading. The only difference is that you trade with a long bias for the bullish pennant and enter with a short trade for the bearish pennant.
The Bottom Line
The pennant pattern in technical analysis is considered to be a trend continuation pattern as it is expected that the breakout will occur in the direction of the trend. It is one of the shorter time-frame patterns as it completes within three weeks or less. Meaning, a breakout (or pattern failure) should occur before the three weeks are over. The key to success with the pennant is the quality of the trend leading up to it. You should look for a sharp and steep run before the consolidation occurs as the aggressive trading that occurs before the pennant forms is likely to continue after the breakout.
Candlestick Patterns Professional Traders Use
- Best candlestick patterns – A curated list of candlestick patterns most frequently used by traders
- How To Read Candlesticks Crypto – Learn the basics of candlestick patterns
- Crypto Chart Patterns (Chart basics: trend, neckline, wedges)
- Doji Candlestick – Basic candlestick unit
Bullish candlestick patterns
Bearish candlestick patterns
Other candlestick patterns
Harami Candlestick – Has both bullish and bearish candlestick
Hammer Candlestick – Has both bullish and bearish candlestick
Double Top and Double Bottom – Has both bullish and bearish candlestick
Spinning Top Candle – Has both bullish and bearish candlestick
Marubozu Candlestick Pattern – Has both bullish and bearish candlestick
Tweezer Bottom Pattern – Has both bullish and bearish candlestick
Continuation Patterns – Determining a continuing trend
#Bybit #TheCryptoArk