
How to Use Shooting Star Candlestick Pattern to Find Trend Reversals

The shooting star candlestick pattern is a single candle formation used by crypto traders to identify bearish reversals. Crypto traders who long the market use the shooting star pattern to identify when to exit their positions. Other crypto traders may use the pattern to identify short entries into the crypto market.
Crypto traders love this pattern because it’s easy to spot, then trade its signals. When the pattern is used in conjunction with other tools like Fibonacci retracements or other trend line resistance levels, it can create strong signals.
What Is a Shooting Star Candlestick Pattern?
A shooting star candlestick pattern occurs when an appreciating asset abruptly reverses lower, leaving behind a long upward wick. It is viewed as a bearish reversal candlestick pattern. This pattern often appears at the top of uptrends.
The psychology behind the pattern can be a little complex. First, traders see an uptrend with the continued strengthening of prices. Nervous traders on the sidelines watching the price appreciate worry that they might miss out. Due to this “FOMO,” traders then buy into the market, pushing the pricing even higher. This effectively attracts bullish traders into the market, which becomes a strong setup for a reversal.
As the market accelerates higher, the candle starts large and bullish, but a trap is set — and the market begins to decline as fast as it increased that day, closing the candlestick relatively close to where it opened.
Shooting star candlestick patterns are commonly seen in all markets, especially in crypto markets. Crypto traders are used to volatile price movements, and the shooting star candlestick pattern is a volatile bearish reversal after a long uptrend. A bearish shooting star appears and is confirmed when the candlestick’s low and close are equal.
What Does a Shooting Star Pattern Look Like?
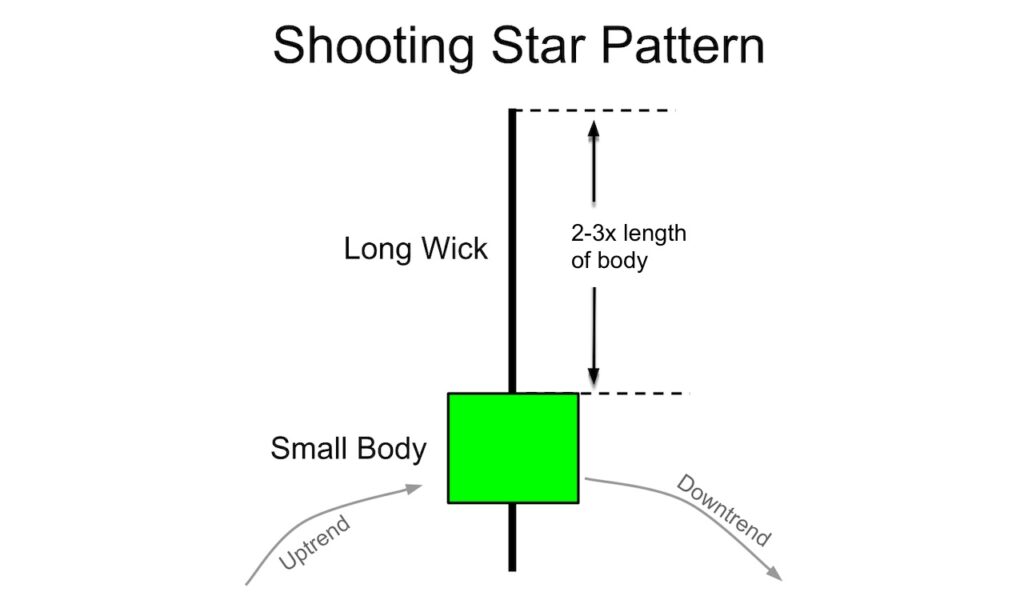
There are essentially four parts that make up the perfect shooting star pattern. We’ve illustrated them in the image below.
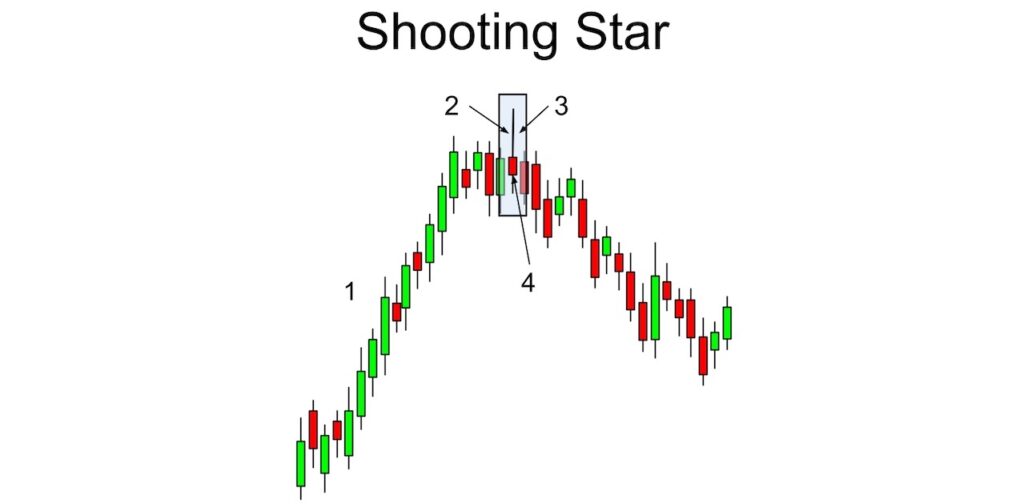
A shooting star candlestick pattern starts with a large uptrend of the price at point 1. This helps set a trap for the bullish traders, as they may experience FOMO on the trend.
The next candle in the trend is where the traders get trapped. First, the FOMO on the uptrend kicks in as more traders enter the market by the influence of an uptrend. This creates the beginning of what appears to be a large bullish candle (point 2).
Then, the uptrend abruptly reverses and begins to retrace most of the recent price gains at point 3.
The candle formation is confirmed when it closes near the opening price, leaving behind a small body at point 4. The color of the candle body does not matter, as it could be red, green, black or white.
In technical analysis, the most important aspect of the candle pattern is the very long upper shadow, a little to no lower shadow, and a relatively small real body near the day’s low. This wick needs to be very long, generally about two to three times the length of the body of the pattern.
Shooting Star vs. Inverted Hammer
At first glance, the shooting star candlestick pattern looks a lot like the inverted hammer pattern. In isolation, they are essentially the same pattern. However, the biggest differences between these patterns are where they appear and what to expect of the outcome.
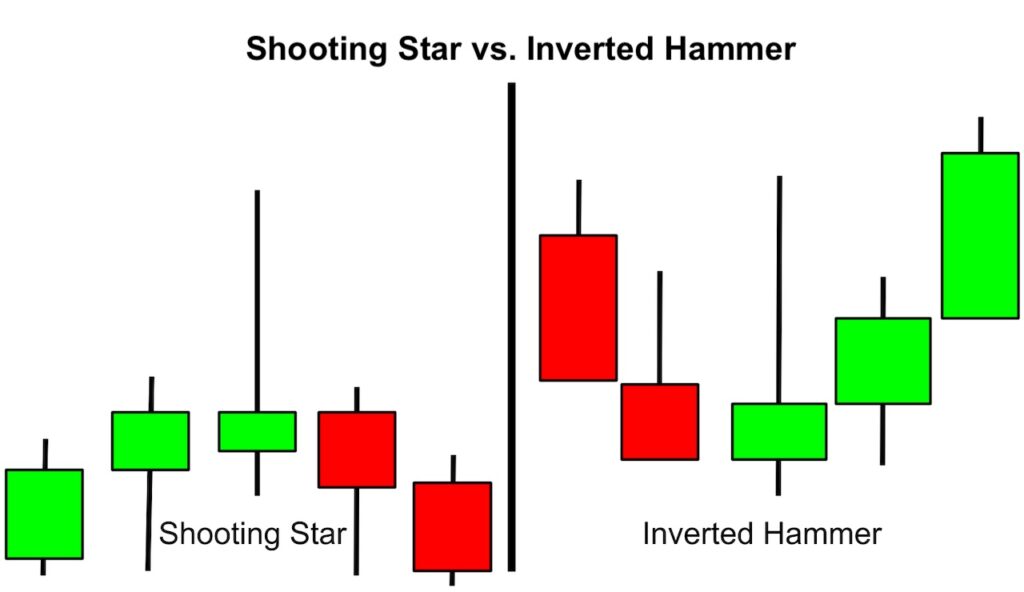
The shooting star formation appears after an extended uptrend. Once the shooting star forms, then prices correct lower to begin a new downtrend.
On the other hand, an inverted hammer occurs at the end of a downtrend. Once the downtrend exhausts, buyers try to push the market higher but are unsuccessful, and the market retreats lower, creating a large wick to the upside and a small candle body.
Once the single candle inverted hammer pattern is finished, the market will rally, creating a new uptrend. Thus, confirming a reversal pattern.
In essence, these two single candlestick patterns are identical, but their location in response to the previous trend distinguishes the shooting star from the inverted hammer.
Shooting Star vs. Hammer Pattern
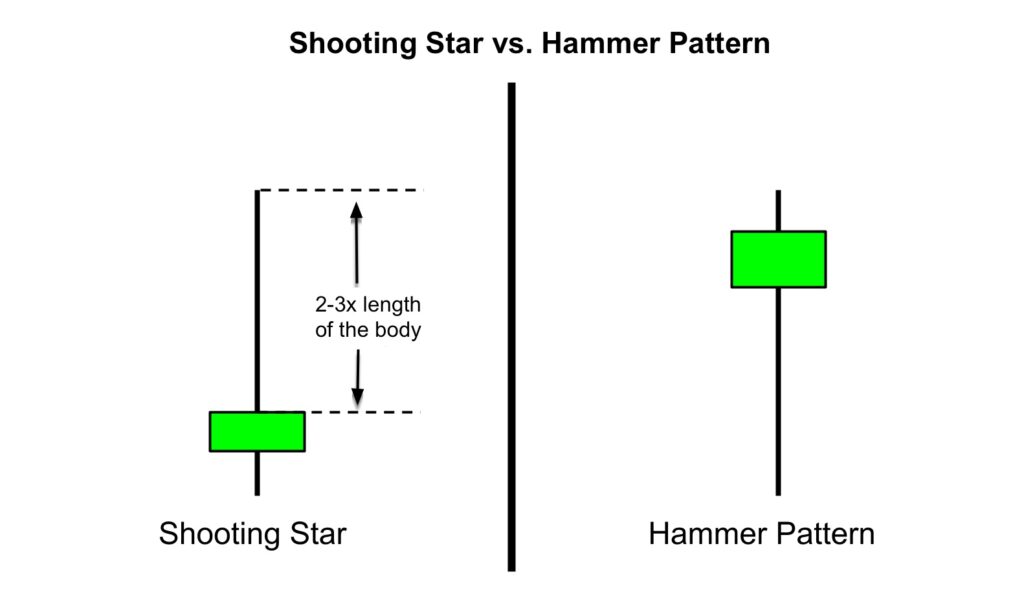
The shooting star and the hammer pattern are great technical indicators that signify the opposites. The significant difference between these two patterns is that the shooting star candlestick appears to have a long upper shadow (wick) to the upside with a small lower body. The shooting star appears at the end of an uptrend, and its presence implies that the market is about to correct lower.
The hammer candlestick pattern has a long lower shadow with a small upper body. The hammer pattern appears at the end of a downtrend, and its presence implies that the market is about to rally into a prevailing uptrend.
Identifying a Shooting Star Pattern
The essence of the shooting star pattern is a bullish trap that pulls long traders into a bullish trend as they anticipate more highs, only to see the market abruptly reverse lower. This pattern becomes even more effective when it appears near other important price levels of resistance.
Appearing near resistance applies more fuel to the pattern’s strength, as long breakout traders who are experiencing FOMO anticipate the break.
Near these resistance levels, breakout traders will push the prices higher to create a short squeeze. However, if the breakout doesn’t continue higher, then the sellers step in, forcing the market lower. As the pricing moves down, the stop losses of the breakout traders are hit, triggering additional selling pressure to the price.
This creates a false breakout higher, which leaves behind a long wick to the upside.
Therefore, the key ingredients to look for in the shooting star candlestick pattern include:
- Uptrend — a steady increase of the trend in prices
- Long wick — a swift bearish reversal creating a long wick to the upside, which is 2–3x the length of the body
- Small body — the candlestick pattern has a small body of any color
Shooting Star Pattern During an Uptrend
As we’ve seen, the shooting star pattern is a single candlestick pattern that signals a potential correction coming in the market. The signals are stronger when the pattern is spotted after an uptrend, as it alerts the trader to the potential of a new downtrend.
It is technically not a shooting star pattern when this pattern occurs in the middle of a trend or after a downtrend. If the shooting star is witnessed in a downtrend, the result of the pattern may not be a continuation of the downtrend. As a result, shooting stars in the middle of a trend or after a downtrend should be ignored.
Indicators to Confirm the Signal
A shooting star formation does not require other indicators to spot it. However, other indicators can be used to confirm and strengthen the signal the shooting star pattern presents. Two of the most common indicators are Fibonacci retracement levels and other resistance lines, such as horizontal and trend line resistance.
Fibonacci retracement levels are hidden support and resistance levels, as they may not be obvious to new or intermediate crypto traders. The Fibonacci retracement tool can be applied to a price chart, revealing levels where a market might reverse.
When a shooting star pattern appears near one of the important Fibonacci retracement levels, then the signal of the shooting star is strengthened.
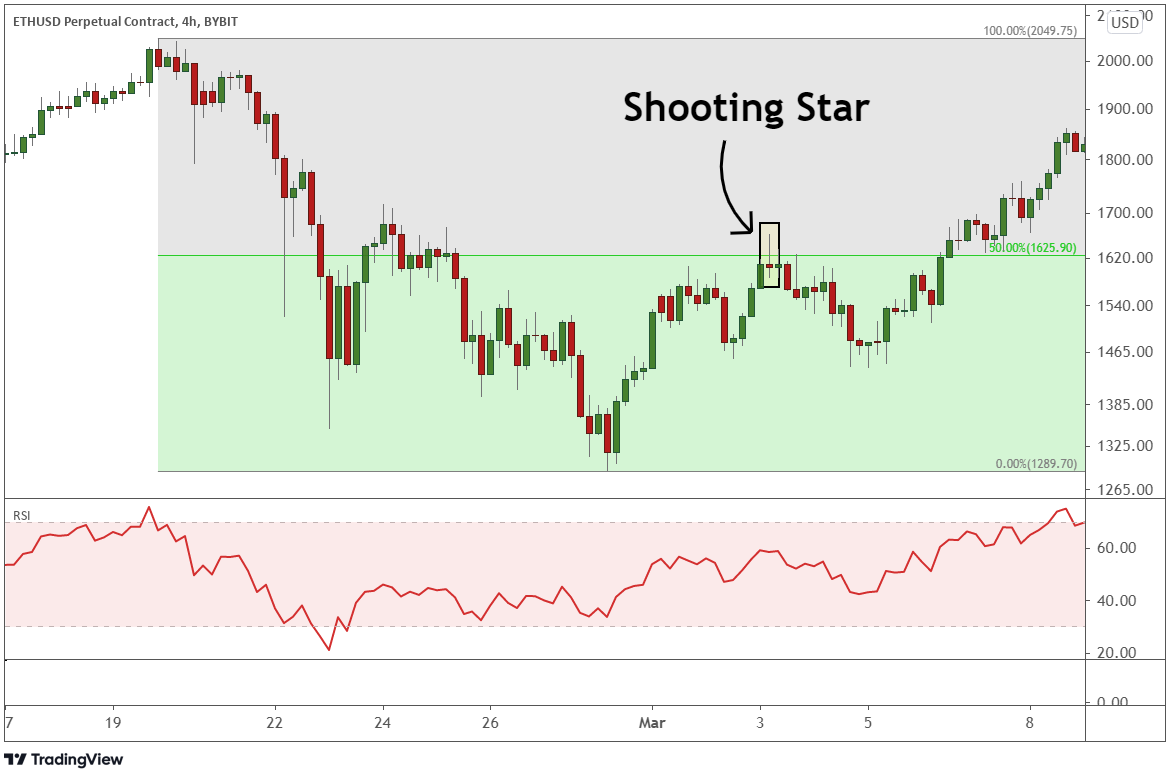
In March 2021, Ethereum rallied about 25% to reach the 50% Fibonacci retracement level. Ethereum then tried to rally above that level, only to be rejected and pushed back down. This price action left behind a long wick to the upside, which was more than three times the length of the candle body, confirming the shooting star pattern. This formation suggested that a correction may be on the horizon.
Sure enough, Ethereum fell about 13% over the next couple of days. If a shooting star pattern appears after an uptrend near a common Fibonacci retracement level, then you have a confirmation signal to the pattern.
Fibonacci retracement levels are simply hidden levels of support and resistance. Therefore, other forms of resistance are more obvious to traders, and they help strengthen the shooting star signals, too.
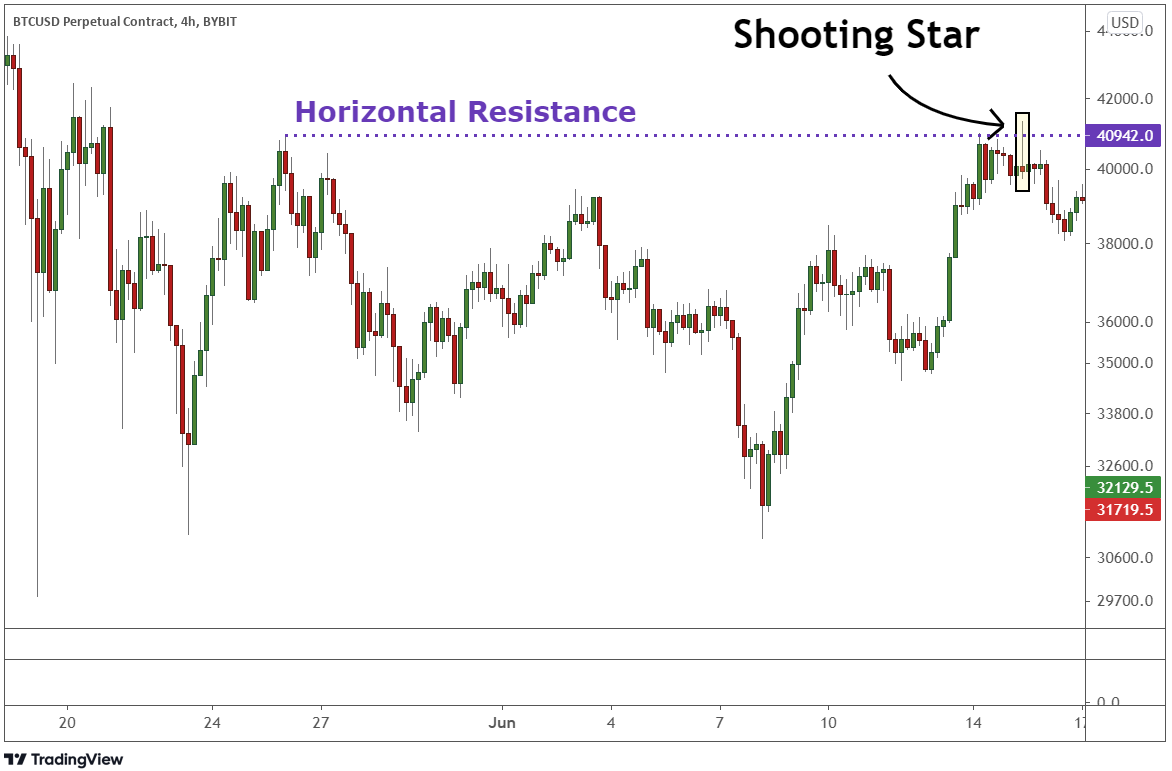
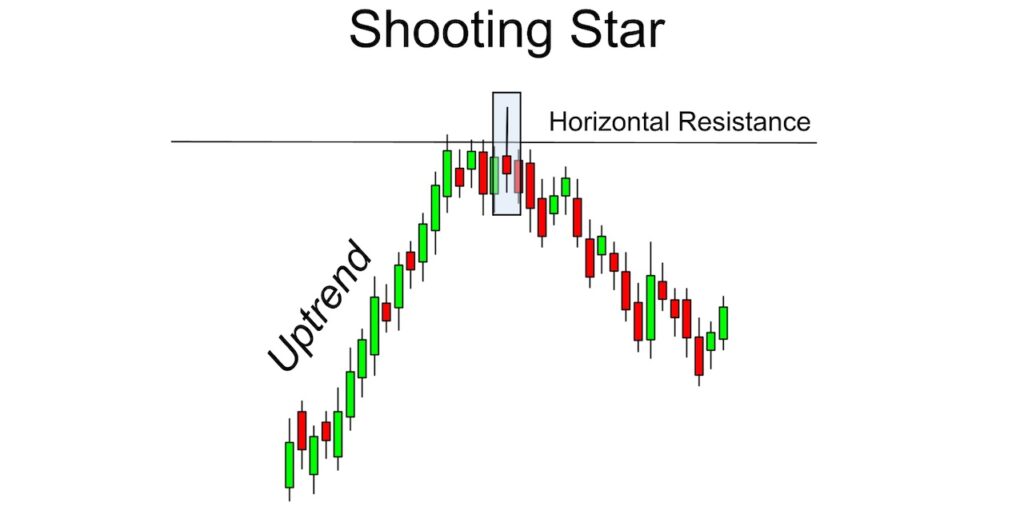
Horizontal resistance is a previous swing high extrapolated horizontally to the right on the chart. Above, we can see Bitcoin reaching a high in late May 2021, creating a horizontal resistance level. Later on, in June 2021, Bitcoin rallies to meet this horizontal resistance, and a shooting star candle pattern appears.
This pattern is most likely the result of bullish traders getting trapped into buying recent new highs. Bitcoin pushes higher slightly above the resistance level, only to see the bears take back control and push pricing lower.
This is a bearish combination that suggests a downtrend may begin. Once this pattern appears near resistance, Bitcoin prices fall nearly 30% over the next week to reach a new low just below $29K.
Using Shooting Star Candlestick Pattern to Spot a Bearish Reversal
The shooting star candlestick pattern can signal a bearish reversal. There are two ways to trade the signal, depending on whether you’re a more conservative or aggressive trader.
First, if a trader is already positioned to the long side when a shooting star candle pattern appears, then the formation may signal that it’s time to exit the trade or tighten the stop loss. The candlestick pattern provides a clue about a potential trend change, and the long trader will want to consider locking in profits before the market corrects lower.
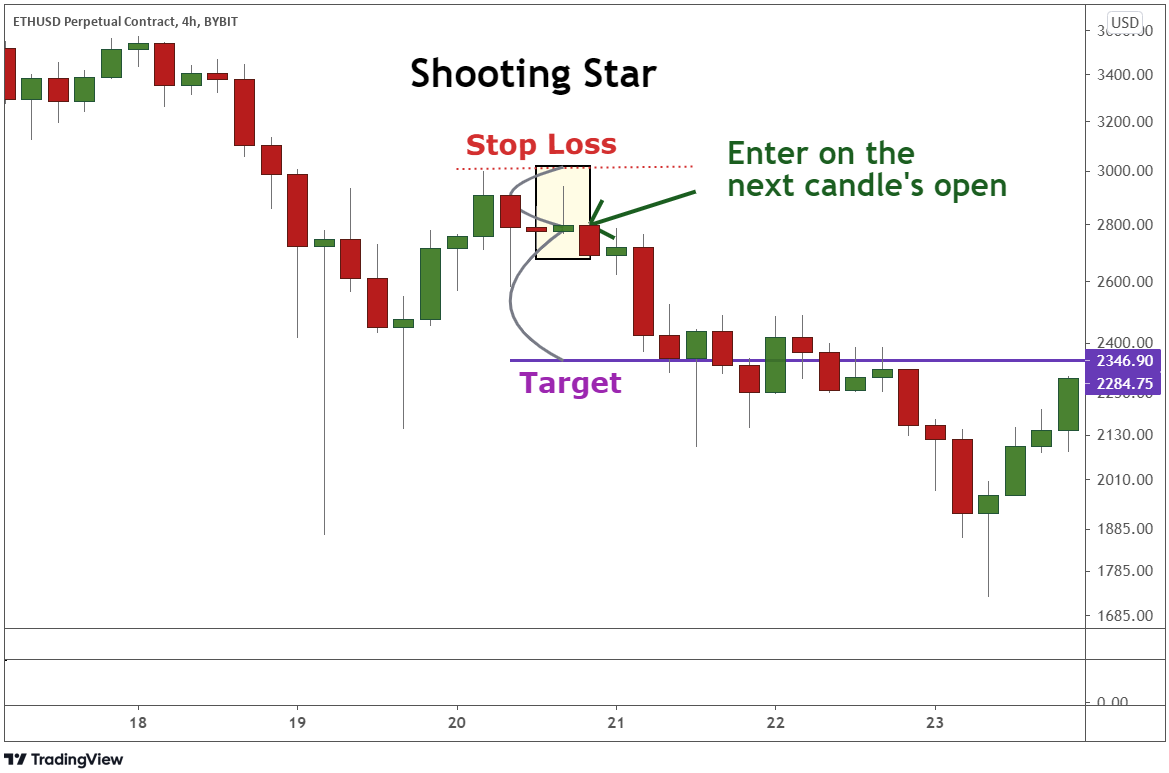
Secondly, if the trader is more aggressive, they may want to jump into a short position at the first symptom of a potential turn lower. After the pattern forms, the trader would enter short on the open of the next candle.
The stop loss would be placed just above the candlestick’s wick high. The trader would look to take profit at a distance at least twice the size of the risk.
There’s nothing wrong with identifying with this aggressive trading style, as long as you understand the additional risks. For example, this approach includes a greater chance of getting stopped out of a trade. The market could reverse against your position and rally higher to tag your stop loss, causing you to eat a losing trade.
The benefit of the aggressive style of trading is its entry price. Due to the early entry into the position, the entry would be at a better (higher) price, making it easier to reach a good risk-to-reward ratio trade.
If you want a more conservative approach to trade with the shooting star candlestick, consider using a support trend line as the trigger.
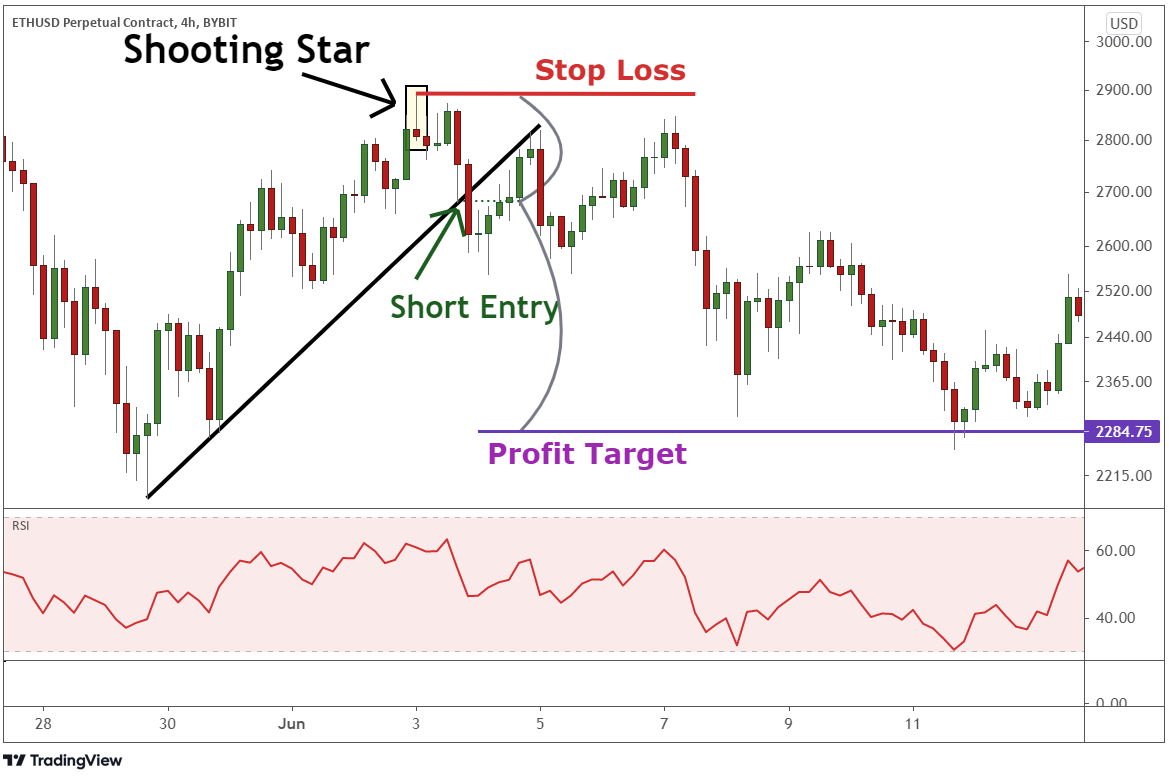
Once the shooting star pattern appears, draw an upward sloping support trend line. Then, as the price crosses below the trend line, enter short into the position. The stop loss would be placed just above the wick’s high, and the target should be at least twice the distance from the stop loss to the entry price. This way, you can maintain a positive risk-to-reward ratio on the trade.
The benefit of using the more conservative approach is that you should receive fewer false signals. The downside is that the width of your stop-loss is much wider than with the aggressive approach. This means that the market needs to travel farther for you to maintain a positive risk-to-reward ratio.
Limitations
The shooting star candlestick pattern is effective for identifying potential bearish turns in the market. However, the pattern should not be relied upon exclusively for trade signals, as it does come with limitations.
First of all, the shooting star pattern can be applied to any chart time frame — but it’s more effective on daily and weekly charts. If the pattern is spotted on a minute chart, there’s a greater possibility of it being a false signal because less trading information is going into the creation of each candle.
Secondly, the shooting star is a single candlestick pattern that inevitably requires fewer data to create relative to other patterns. For example, the bearish engulfing pattern is a two-candlestick pattern, and the evening star is a three-candlestick pattern. These patterns require more candlesticks and, thus, more data to create them.
Lastly, smaller cryptocurrencies have less trading volume taking place. Therefore, if the shooting star pattern is spotted on smaller-sized cryptocurrency charts, there’s a greater chance that a false signal is forming. Though the shooting star can be used for any cryptocurrency, it’s best used to identify bearish pivots on the larger ones.
The Bottom Line
The shooting star pattern is a single candle pattern that is effective at identifying tops on large cryptocurrencies. Traders widely use the pattern because it’s easy to spot and can be used on any chart time frame.
Other tools, like the Fibonacci retracement drawing or horizontal and trend line resistance, help confirm the shooting star pattern’s signals. However, the shooting star pattern has its limitations and should focus more on larger cryptocurrencies on hourly, daily, or weekly time frames.
Candlestick Patterns Professional Traders Use
Best candlestick patterns – A curated list of candlestick patterns most frequently used by traders
How To Read Candlesticks Crypto – Learn the basics of candlestick patterns
Crypto Chart Patterns (Chart basics: trend, neckline, wedges)
Doji Candlestick – Basic candlestick unit
Bullish candlestick patterns
- Inverted Hammer Candlestick
- Bullish Engulfing Candlestick
- Cup and Handle Patterns
- Morning Star Pattern
- Three White Soldiers Pattern
- Triple Top Pattern and Triple Bottom Pattern
- Falling Wedge Pattern
- Dragonfly Doji Candlestick
Bearish candlestick patterns
- Bear Flag Patterns
- Gravestone Doji Candlestick
- Head and Shoulders Pattern
- Dark Cloud Cover Pattern
- Rising Wedge Pattern
- Hanging Man Candlestick
- Bear Pennant Pattern
- Evening Star Pattern
- Triple Top Pattern and Triple Bottom Pattern
Other candlestick patterns
- Harami Candlestick – Has both bullish and bearish candlestick
- Hammer Candlestick – Has both bullish and bearish candlestick
- Double Top and Double Bottom – Has both bullish and bearish candlestick
- Spinning Top Candle – Has both bullish and bearish candlestick
- Marubozu Candlestick Pattern – Has both bullish and bearish candlestick
- Tweezer Bottom Pattern – Has both bullish and bearish candlestick
- Continuation Patterns – Determining a continuing trend