
How to Use a Bullish Engulfing Candle to Trade Entries

The bullish engulfing candle is a Japanese candlestick pattern that can help traders analyze the market sentiment and identify a new bull trend when it is kicking off. Meanwhile, a bearish engulfing pattern indicates a confirmation that sellers are shorting, hence signaling a potential trend reversal. Once you are familiar with the bullish and bearish engulfing pattern, it is easy to spot, providing traders with good risk-to-reward ratios.
As you read this article, we will help you understand what a bullish engulfing candle is, when and how this pattern appears, and how to trade with it. We’ll be including some tips and tricks to apply the bullish engulfing pattern to crypto trading.
What Is a Bullish Engulfing Candle?
The bullish engulfing candlestick pattern refers to a bullish trend reversal when preceded by a cluster of red or black candlesticks showing a bearish trend. It is useful for signaling the start of a new uptrend, as the bullish green or white candle body completely surrounds or engulfs the previous day’s red or black candlestick.
When bullish engulfing occurs, it means more buyers entered the market, pushing the price upward, hence resulting in a trend reversal. This candle usually occurs at the bottom of a downtrend.
Characteristics of the Candlestick Formation
The bullish engulfing candlestick pattern is a two-candle formation (candles A & B below).

The first candle (A) must be a down candle, colored red on most charting packages (or black if using a white/black color scheme). The size of the red candle can be large or small. The key to the pattern is the size of the second candle.
The second candle (B) will need to engulf or overlap the first candle. Technically, this means the opening price for the second candle must be lower than the closing price of the first candle. However, in the crypto markets, there is no opening or closing of a trading period. You can transfer coins 24 hours a day, 7 days a week.
Consequently, the second candle simply needs to overtake and engulf the first candle.
When Does a Bullish Engulfing Pattern Appear?
The bullish engulfing candlestick pattern is a bullish reversal pattern found at the end of a downtrend. When visible, this bullish pattern signals that the previous downtrend has ended and a potential reversal trend (a new uptrend) is beginning.
First, there needs to be a correction of an upward movement. From January 2021 to February 2021, Bitcoin’s uptrend resulted in a 100% price increase. Bitcoin then experienced a partial correction, trending lower to February 28, 2021.
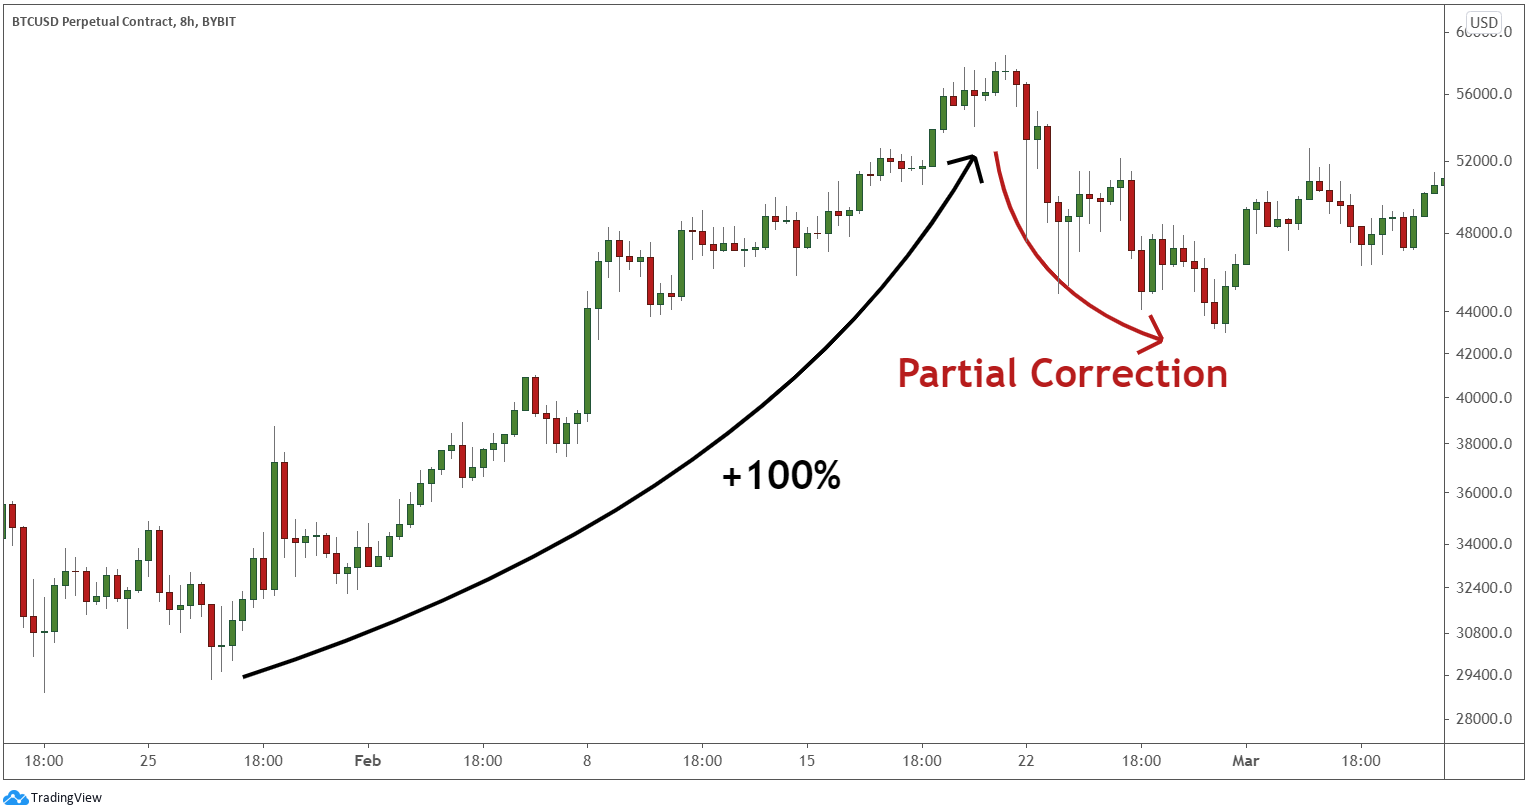
Second, there needs to be a kickoff to the resumption of the old uptrend. On February 28, 2021, Bitcoin rocketed higher after the partial retracement. The bullish candle engulfed the previous candle, signaling a bullish reversal.
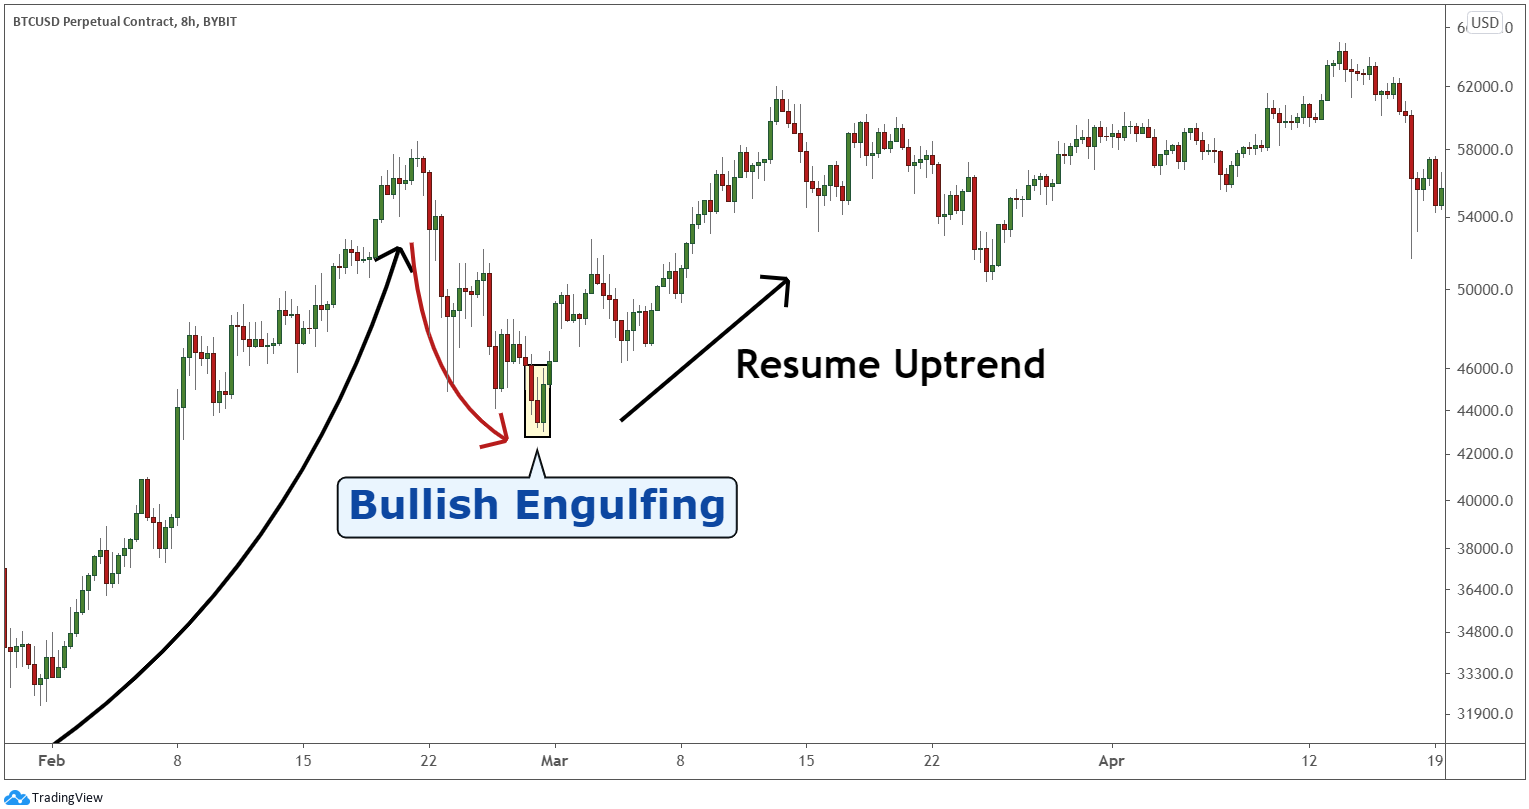
After Bitcoin carved the bullish engulfing pattern, the market extended higher by another 48%.
How to Trade Crypto with a Bullish Engulfing Pattern
A bullish engulfing pattern technically requires the second candle to open lower and reverse high enough to fully engulf the first candle. However, since the crypto market is operating 24/7, therefore, it is extremely rare to have a gap lower at the same time a new candle appears.
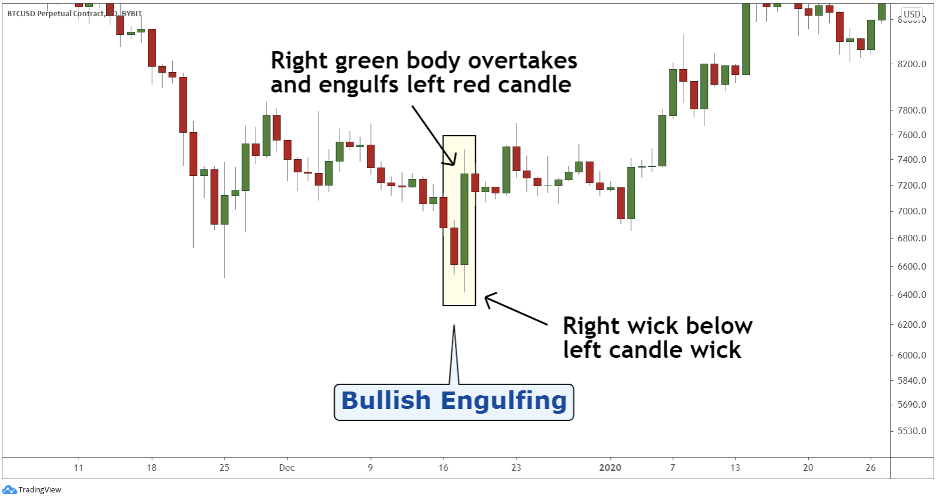
The chart above, involving Bitcoin, is a great example of what to look for in a bullish engulfing pattern.
Notice how the wick on the right (green) candle ends below the wick of the left (red) candle. This signals the market briefly traded lower before accelerating higher. This brief penetration lower, though not required, strengthens the signal for the engulfing pattern.
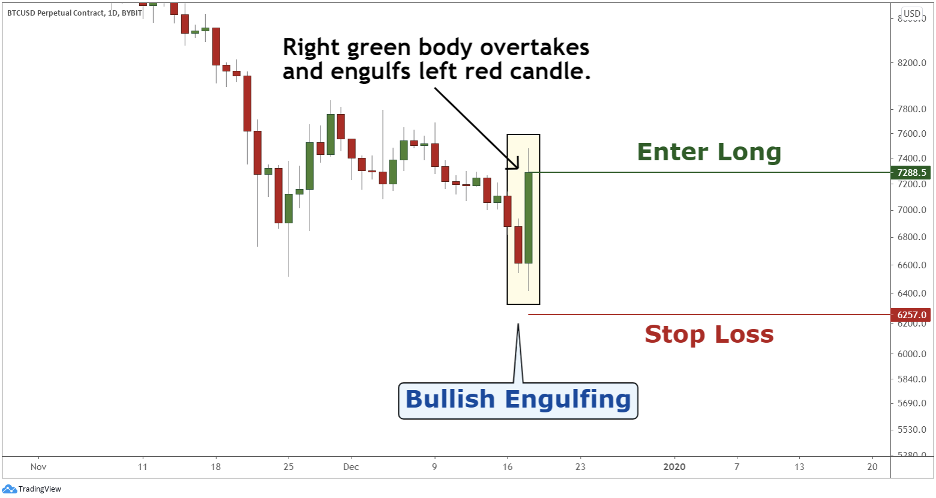
The engulfing pattern is confirmed as being completed when the second candle closes above the opening of the first candle. At that point, the trader can open a bullish position in the cryptocurrency with a stop loss just below the swing low of the engulfing pattern.

Pro Tip:
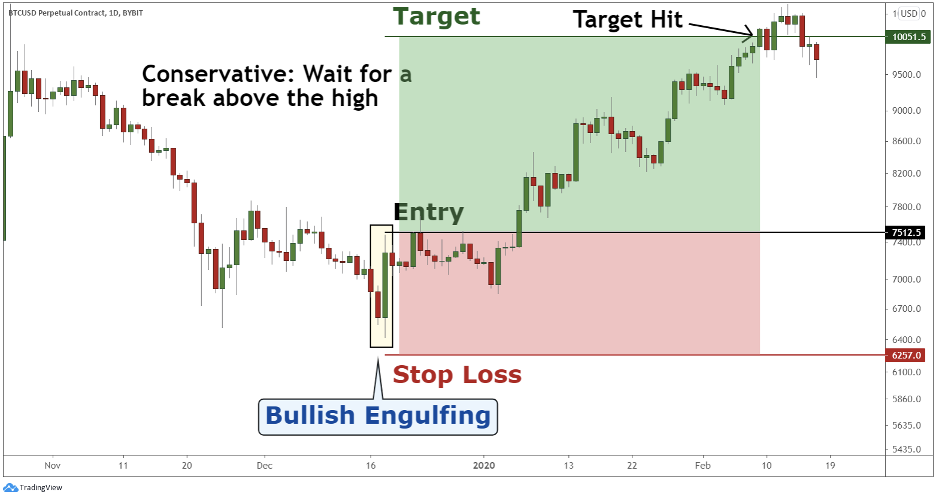
Sometimes, the market will consolidate because prices have just rocketed higher. Conservative traders may wait for a breakout above the high of the right candle to occur and then enter long into the position. A break above the high would confirm a resumption of the uptrend. The significant risk would be set at the same area, just below the swing low.
Advantages of Trading the Engulfing Pattern
The bullish engulfing pattern is followed by many traders primarily for a couple of reasons.
First, the pattern is very easy to identify. Engulfing is a two-candlestick pattern in which one of the candles produced is extremely large. As a result of the large candle, the pattern is easy to spot on a chart, once you know what to look for.
Secondly, after the engulfing pattern is confirmed as being completed, you can receive an attractive risk-to-reward ratio into the position.
The stop loss and risk level for trading can be placed at the swing low of the engulfing pattern. This makes it relatively easy for traders to target at least twice the distance of their stop loss, creating a 1:2 risk-to-reward ratio.
Pro Tip:
Th risk-to-reward ratios are important for managing trader profitability. A 1:2 risk-to-reward ratio means that even if you win on only 50% of your trades, you will still be profitable.
Bullish Engulfing Pattern Trading Tips for Crypto
As you can see, there are several advantages to trading the bullish engulfing candle pattern. However, by itself, the pattern is limited to its effectiveness. Just as multiple strands of a cord make the cord stronger, other tools can be used to complement this bullish engulfing pattern — making the engulfing pattern stronger.
Below, we’ll share three tools to help strengthen the signals.
- Horizontal support levels
- Bullish support trend lines
- Moving averages
Tip #1: Horizontal Support for the Engulfing Candlestick
If the crypto market is in a strong uptrend, then we will see a series of higher highs and higher lows on the price chart.

Each new higher high is breaking above an old high. After successfully breaking above the old high, prices tend to consolidate and correct. Within the crypto market, it is common for prices to retrace back to the old broken high.
In the example above, Bitcoin had gained 224% and needed to consolidate. It corrected about 20% and landed near $10,120, which was a previous high price back in May and June of 2020. A bullish engulfing pattern emerged, which was the start of a 500% uptrend.
If a bullish engulfing candlestick pattern appears near an old broken high, then we have a strong signal that the bullish trend is ready to resume.
Tip #2: Trend Line Support Near the Engulfing Pattern
It is quite common for the crypto market to scream higher without taking much of a break. Therefore, the old highs and broken resistance may never come into play, yet the market continues its upward trend.
Another tool to help you strengthen your engulfing signals is a bullish support trend line.

The bullish engulfing candlestick pattern provides its best signals after the market has consolidated lower. If this consolidation is terminating and reversing at a bullish trend line with a bullish engulfing candle present, then the market is giving you a strong bullish signal.
In the image above, we see LINK trying to recover from the March 2020 pandemic sell-off. As the uptrend began to take root, LINK carved a pattern of gaining, then consolidating.
An uptrend line could be created with the ending points of the corrections. Sure enough, LINK popped higher at the trend line, with a bullish engulfing pattern sending the altcoin up 25% in a couple of days — and by nearly 8x over the next 4 months.
Tip #3: Moving Average as a Bullish Engulfing Pattern Indicator
Many traders and large institutions keep a close eye on an indicator called the 200-period simple moving average, as it provides technical support to the market.
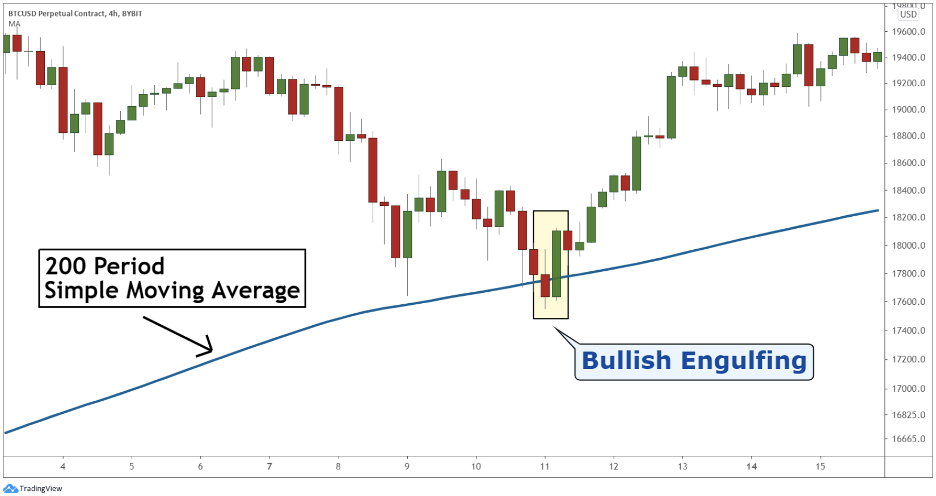
If the crypto price chart corrects down to the moving average and the engulfing pattern carves, this is a strong signal the trend may reverse higher.
In the image above, we are looking at Bitcoin on a 4-hour price chart. Bitcoin was correcting its previous uptrend and tagged the 200-period simple moving average. At that point, a bullish engulfing pattern appeared to kick off another trend of 250%.
The Bottom Line
The simplicity of spotting the bullish engulfing candlestick pattern makes it a popular choice among traders. The engulfing pattern does offer traders an attractive risk-to-reward ratio when using it to enter into crypto trades.
To receive the biggest benefit of trading the pattern, we suggest coupling the pattern with other charting tools for technical analysis support. For example, a market correcting down to horizontal support, trend line support, or a simple moving average followed by a bullish engulfing pattern is a strong signal the trend may continue higher.
Candlestick Patterns Professional Traders Use
Best candlestick patterns – A curated list of candlestick patterns most frequently used by traders
How To Read Candlesticks Crypto – Learn the basics of candlestick patterns
Crypto Chart Patterns (Chart basics: trend, neckline, wedges)
Doji Candlestick – Basic candlestick unit
Bullish candlestick patterns
- Inverted Hammer Candlestick
- Cup and Handle Patterns
- Morning Star Pattern
- Three White Soldiers Pattern
- Hammer Candlestick
- Triple Top Pattern and Triple Bottom Pattern
- Falling Wedge Pattern
- Dragonfly Doji Candlestick
Bearish candlestick patterns
- Bear Flag Patterns
- Gravestone Doji Candlestick
- Head and Shoulders Pattern
- Dark Cloud Cover Pattern
- Shooting Star Candlestick
- Rising Wedge Pattern
- Hanging Man Candlestick
- Bear Pennant Pattern
- Evening Star Pattern
- Triple Top Pattern and Triple Bottom Pattern
Other candlestick patterns
- Harami Candlestick – Has both bullish and bearish candlestick
- Hammer Candlestick – Has both bullish and bearish candlestick
- Double Top and Double Bottom – Has both bullish and bearish candlestick
- Spinning Top Candle – Has both bullish and bearish candlestick
- Marubozu Candlestick Pattern – Has both bullish and bearish candlestick
- Tweezer Bottom Pattern – Has both bullish and bearish candlestick
- Continuation Patterns – Determining a continuing trend