
Hammer Candlestick: What It Is and How to Spot Crypto Trend Reversals

The hammer candlestick is one of the most popular candlestick patterns traders use to make sense of a securities’ price action. Most price action traders use this candlestick to identify reliable price reversal points. Moreover, this candlestick works well in all financial markets, including forex, stocks, indices, and cryptocurrencies.
Trading in the financial market requires considerable knowledge of technical and fundamental analysis. The ultimate approach is to identify the price direction based on price action analysis. If done correctly, traders will make money. However, finding the price direction requires complex analysis and multiple confirmations using trading tools like candlesticks, price patterns, and trend recognition.
We’ll discuss how the hammer candlestick shows a reversal in price direction after a bearish trend, and then we’ll consider a complete hammer trading strategy.
Key Takeaways:
The hammer is a bullish reversal candlestick that appears after an extended downtrend.
Success in using the hammer trading strategy depends on the market context, candlestick location, other confirmations, and market momentum.
The biggest drawback of this pattern is that it might show a retracement of the intraday bearish trend instead of a reversal.
What Is a Hammer Candlestick?
The hammer is a bullish reversal pattern that appears after a long bearish trend. It has a petite body and long lower shadow. It is a price pattern with the opening, and closing prices remain close, indicating that bears have become active but closing the price near the opening level.
The hammer candlestick pattern shows a story about market supply and demand, easily observed by watching how the candlestick forms. A long lower shadow indicates that sellers have taken the price down, failing to hold it at the new low. Later on, buyers have joined the price from the low, successfully taking the price near the daily opening level. In general, the hammer usually appears after the price of an asset decline.
When the hammer candlestick patterns appear, it could signal that an upcoming potential reversal or market sentiment is about to turn. But, the price must show momentum following the hammer pattern as a confirmation.
There are two conditions that can affect the strength of the hammer’s signal:
- After a long downtrend, the failure of sellers and the presence of buyers from a random place are more reliable than a hammer candlestick. They signify that the price has already moved a long way, and it should correct higher. However, the downside pressure depends on which time frame you’re trading. For the daily chart, every quarter or monthly closing is a time of price reversal. Moreover, the price action can change due to fundamental releases. The trading session is necessary for the intraday chart, as institutional traders remain only on a specific trading session.
- After that, it’s crucial to understand how the price closes. If the closing price is above the opening price, the hammer is more likely to take the price up. Moreover, even if the inverted hammer has a long shadow upside, it works as strong bullish reversal patterns.
What Does a Hammer Candlestick Look Like?
The hammer pattern is a single candlestick pattern that has a small body. The body of a hammer candlestick can be either:
- Green (bullish), where the close of the candle is higher than the open,
- Or red (bearish), where the close of the candle is lower than the open.
The candlestick color doesn’t carry much weight because the hammer candlestick pattern will always show a bullish signal regardless of the candle’s body color.
The core event of a hammer candlestick happens in the lower shadow. Thus, the success rate of the candlestick depends on how long the wick is, compared to the candle’s body. Usually, a good hammer pattern should have a wick that’s two times longer than its body, whereas greater length shows more exhaustion to the price with an increased buying possibility.
Let’s have a look at the anatomy:
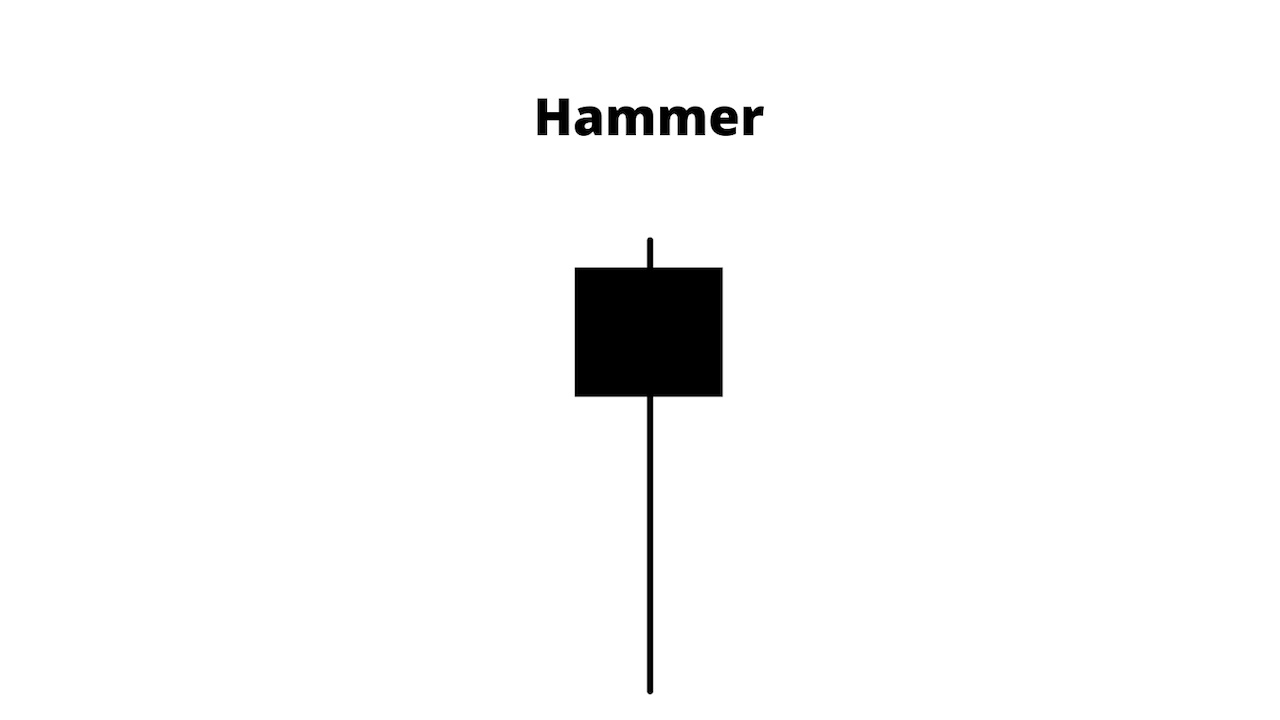
Above, we see a single candlestick with a more petite body and a long shadow. The bearish wick represents sellers’ rejection, but as a trader, we need to know more. So let’s have a look at what’s inside the hammer candlestick:
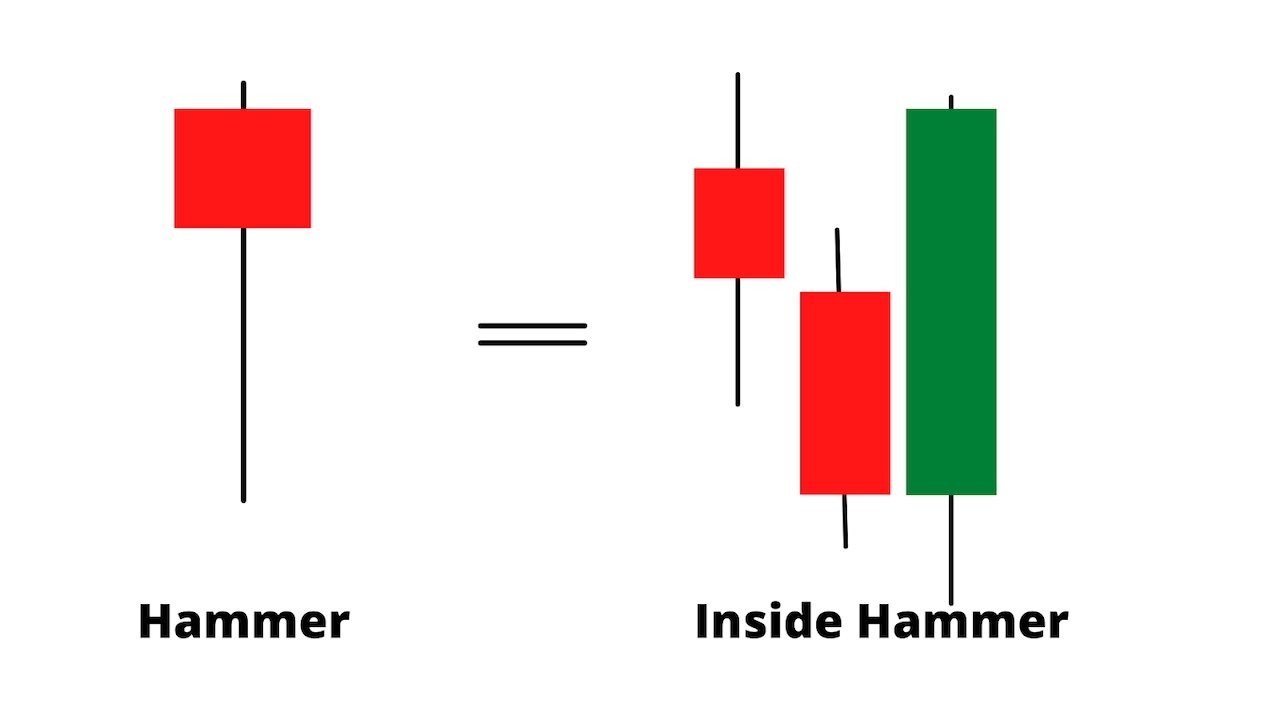
If the candlesticks in the above image were taken from a daily chart, it would represent an intraday portion showing what’s inside the hammer. Here, the H4 candles lead to a more reliable view of how sellers have joined the market and been beaten by buyers.
The Bullish Hammer
In the above section, we’ve seen that the hammer has a small body and a long wick. But what are the other conditions?
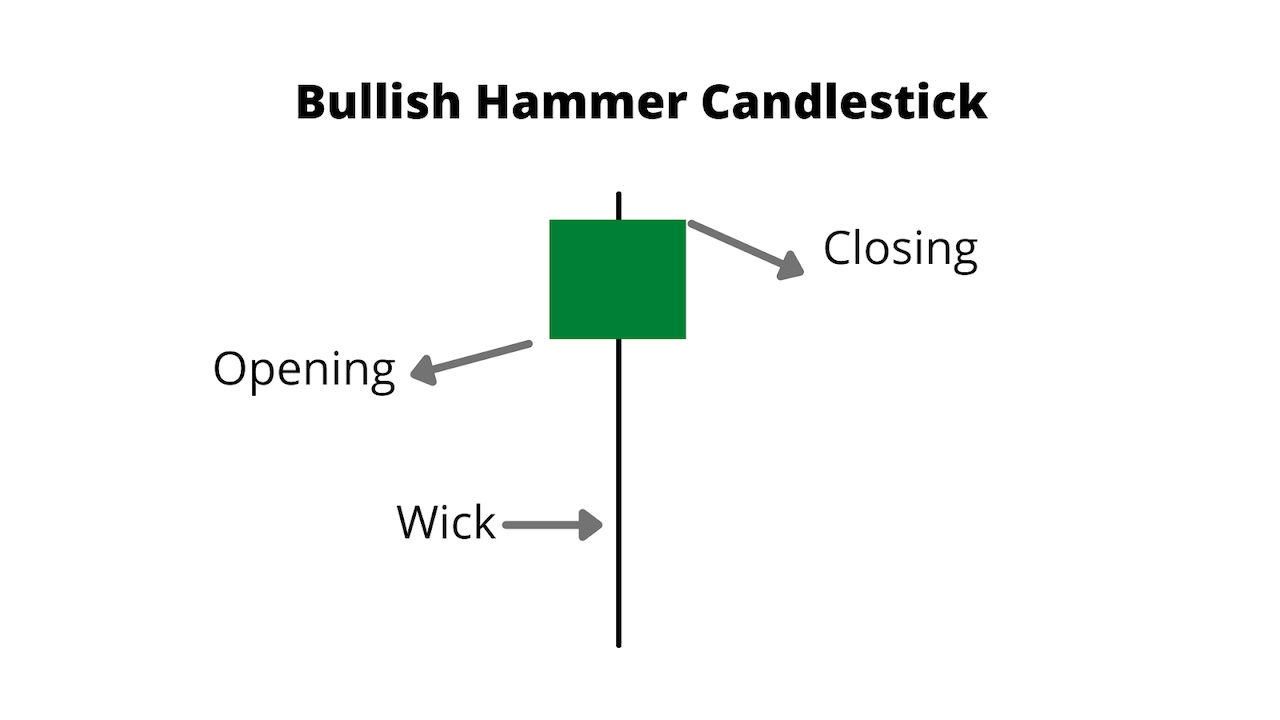
The bullish hammer forms when the closing price is above the opening price, indicating that buyers have become stronger in the market before the candle closes. The bullish hammer’s success rate depends on the closing price and leg’s length. A longer wick, combined with the closing price above the opening price, provides the most accurate trade.
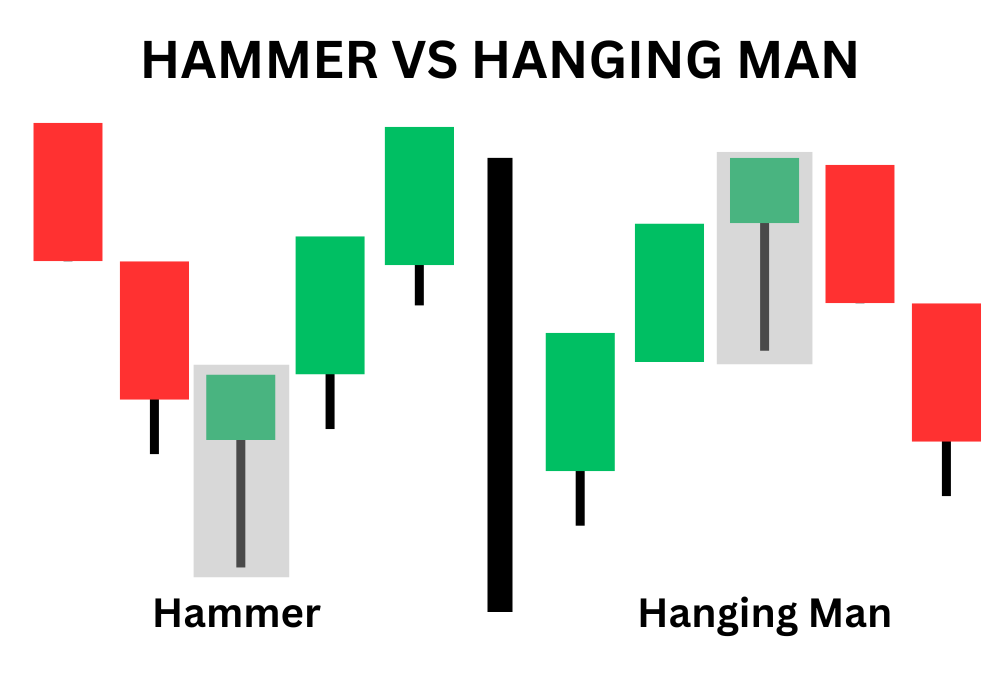
Hammer vs. Hanging Man
There are many similarities between the hammer and hanging man that might confuse traders. The similarities are striking, as these are both single candle patterns that look nearly identical.
The crucial distinction between the two patterns lies in their placement relative to the previous trend. A hammer pattern forms after an extended downtrend, and suggests that selling pressure is subsiding and buyers are rushing in. That sentiment is what generates the longer wick to the downside. Thus, the hammer serves as a bullish signal, especially if it appears near support.
While a carbon copy of the hammer, the hanging man appears after an extended uptrend. The hanging man pattern forms as prices initially push lower, then immediately rebound higher. After an uptrend, that price action suggests that buyers are losing momentum and sellers are starting to enter the trade. Thus, the hanging man is a bearish signal, particularly when it emerges near a resistance level.
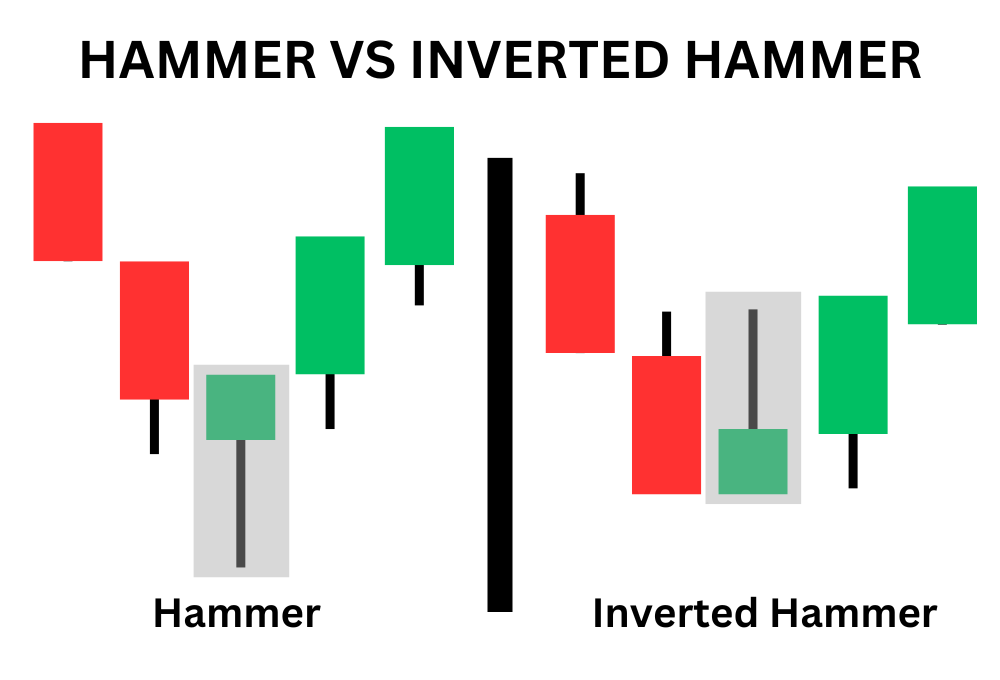
Hammer vs. Inverted Hammer
Another cousin to the hammer pattern is the inverted hammer. Both formations are bullish single-candle patterns, and price is expected to rally after they form.
The key difference between them is in their appearance. As its name suggests, the inverted hammer looks like an upside-down hammer. In the inverted hammer the price initially rises, but is promptly pushed back down. The closing price of the single candle formation is near the opening price. The candle's body (red or green) holds no significance in pattern analysis.
Both patterns emerge following a downtrend, and the signal is reinforced if the formation materializes near support.
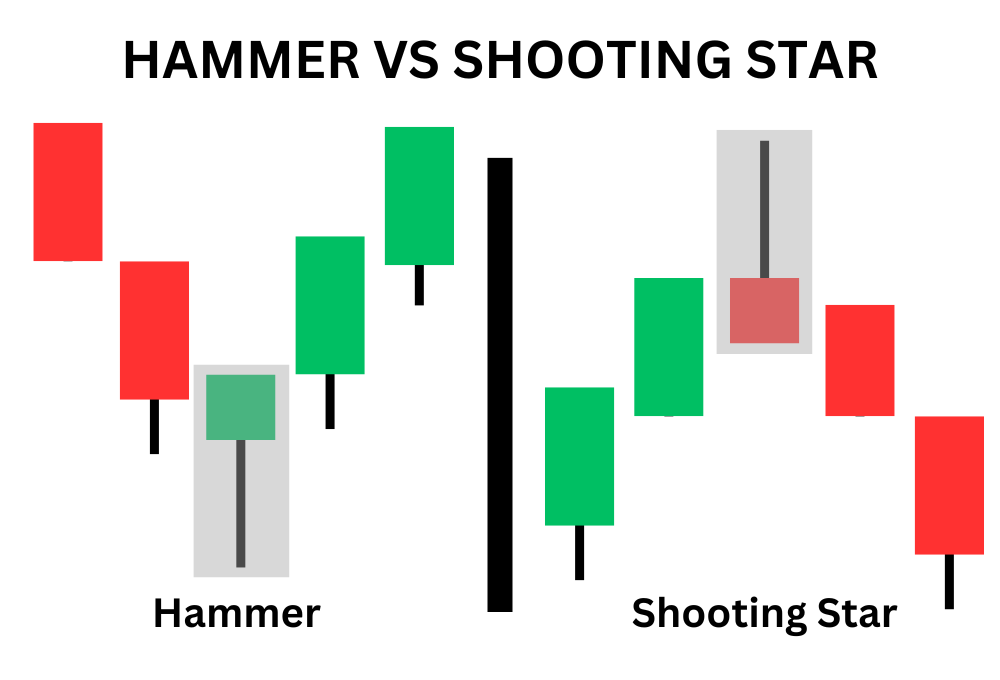
Hammer vs. Shooting Star Pattern
The shooting star is another Japanese single candlestick pattern that resembles the inverted hammer. There are a couple of distinct differences between the hammer and the shooting star.
The shooting star’s wick points out of the top side of the candle’s body. This formation loosely resembles a star falling out of the sky. On the other hand, the hammer’s wick trails from the bottom of the body.
As we’ve stated previously, the hammer appears at the end of a downtrend, whereas the shooting star is formed at the end of an uptrend. As a result, the hammer is a bullish candlestick pattern, while the shooting star is a bearish formation.
Hammer vs. Doji: The Differences
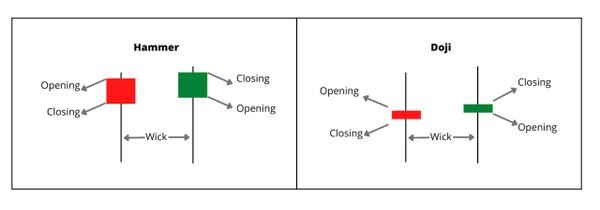
After a long downtrend, a hammer shows a buying opportunity. So does the Doji. Let’s look at some differences between hammer and Doji.
Hammer | Doji |
Has a long shadow downside with a small body | Has a long upper shadow and lower shadow with a small body |
Hammer candlestick indicates bears’ failure in the price | Doji indicates indecision about the price |
Has both red and green bodies | Doji has a petite body; the red and green bodies don’t have an impact |
Hammer indicates a potential bullish price reversal | Doji doesn’t provide enough clues about the next trend’s direction |
Hammer Candlestick Trading Strategies
Traders should understand the practical uses of the hammer pattern, along with other indicators, to make a profit. You can rely on the hammer candlestick as a primary element to formulate a trading strategy. Still, its accuracy can only be confirmed when used with other technical indicators and technical analysis tools.
We’ll look at some of the trading strategies to use with the hammer pattern.
Strategy 1: Top-Bottom Strategy with Hammer
The global financial market cycles create and change market trends. Most of the significant top-bottom results from strong fundamental news, but cryptocurrency also depends on the global economic condition, regulation conflict, crypto acceptance, and more. The first requirement of this strategy is to identify a strong downtrend that has broken all near-term lows.

In the above image, a daily ETH chart, the price moves lower, breaking below the near-term low of 1800.00.

As soon as the price makes a new low, it shows the first sign of upcoming bullish pressure with an indecision candle. Later on, bears try to take the price lower but fail and close with a bullish hammer.
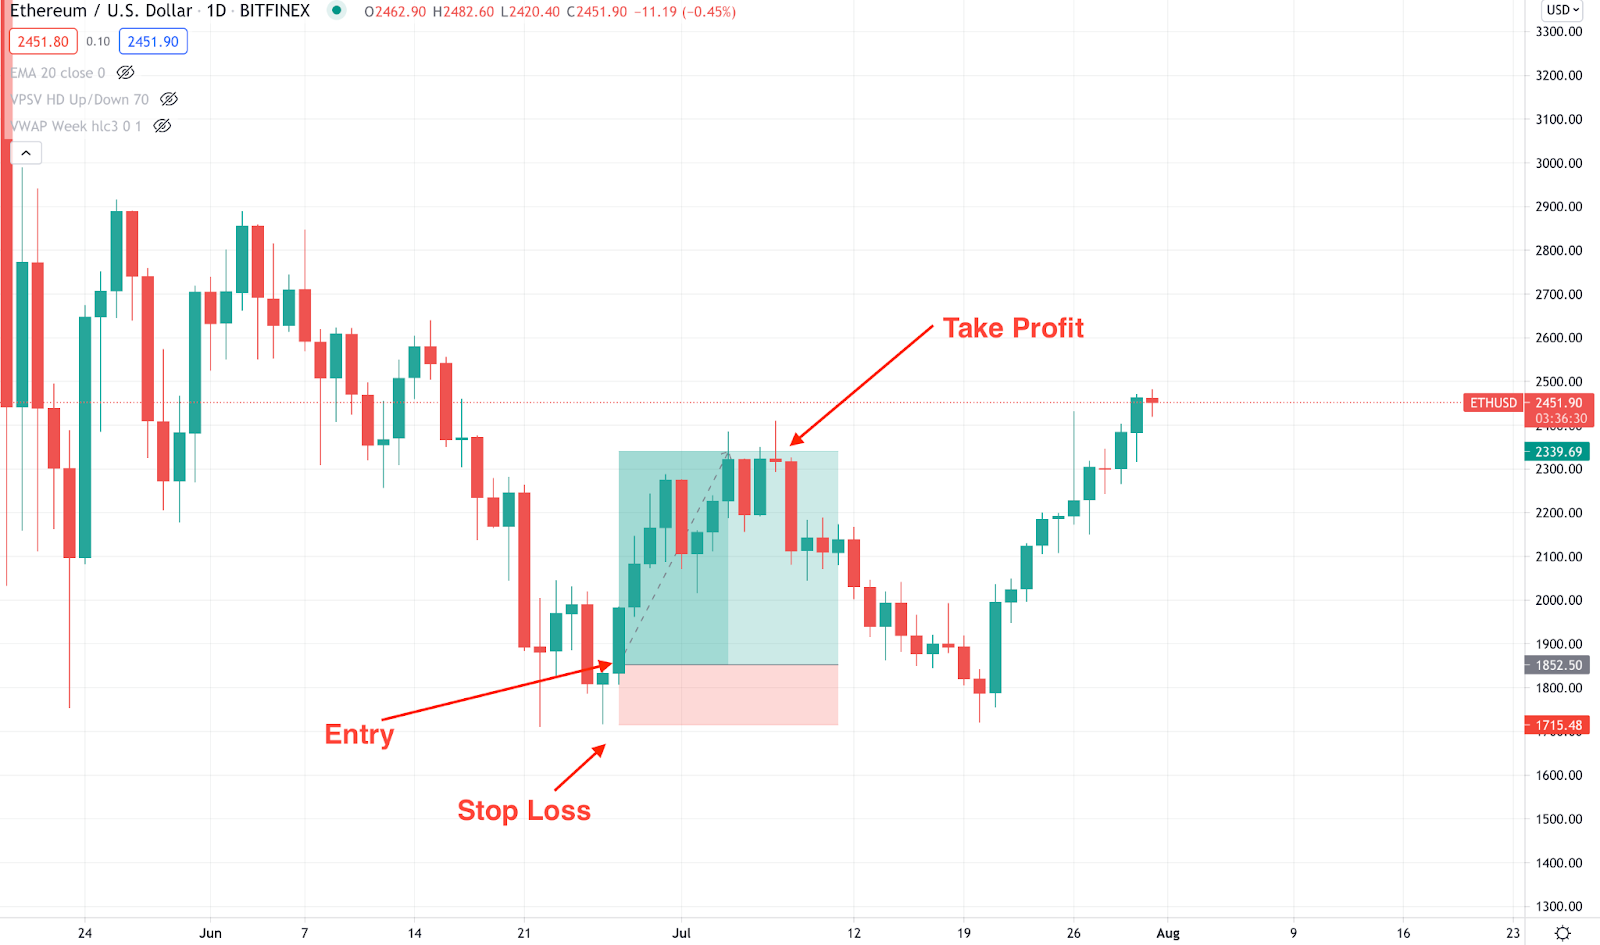
The ideal entry for this trading strategy is a buy stop order above the hammer’s high price, with a stop loss below the shadow with some buffer. In the above example, the trade closes with a 1:3.57 R:R as soon as a bearish pin bar appears at the resistance level.
Strategy 2: Support-Resistance Trading
Support and resistance levels work as a barrier to the price, and once the price breaks above or below these levels, there’s significant price movement. However, the financial market moves like a rubber band that barely breaks the support and resistance unless there is significant news to break the chain.
Therefore, we’ll define the price trend using price action, and while making the trade, we’ll use the hammer candlestick as an additional confirmation to the bullish trend.
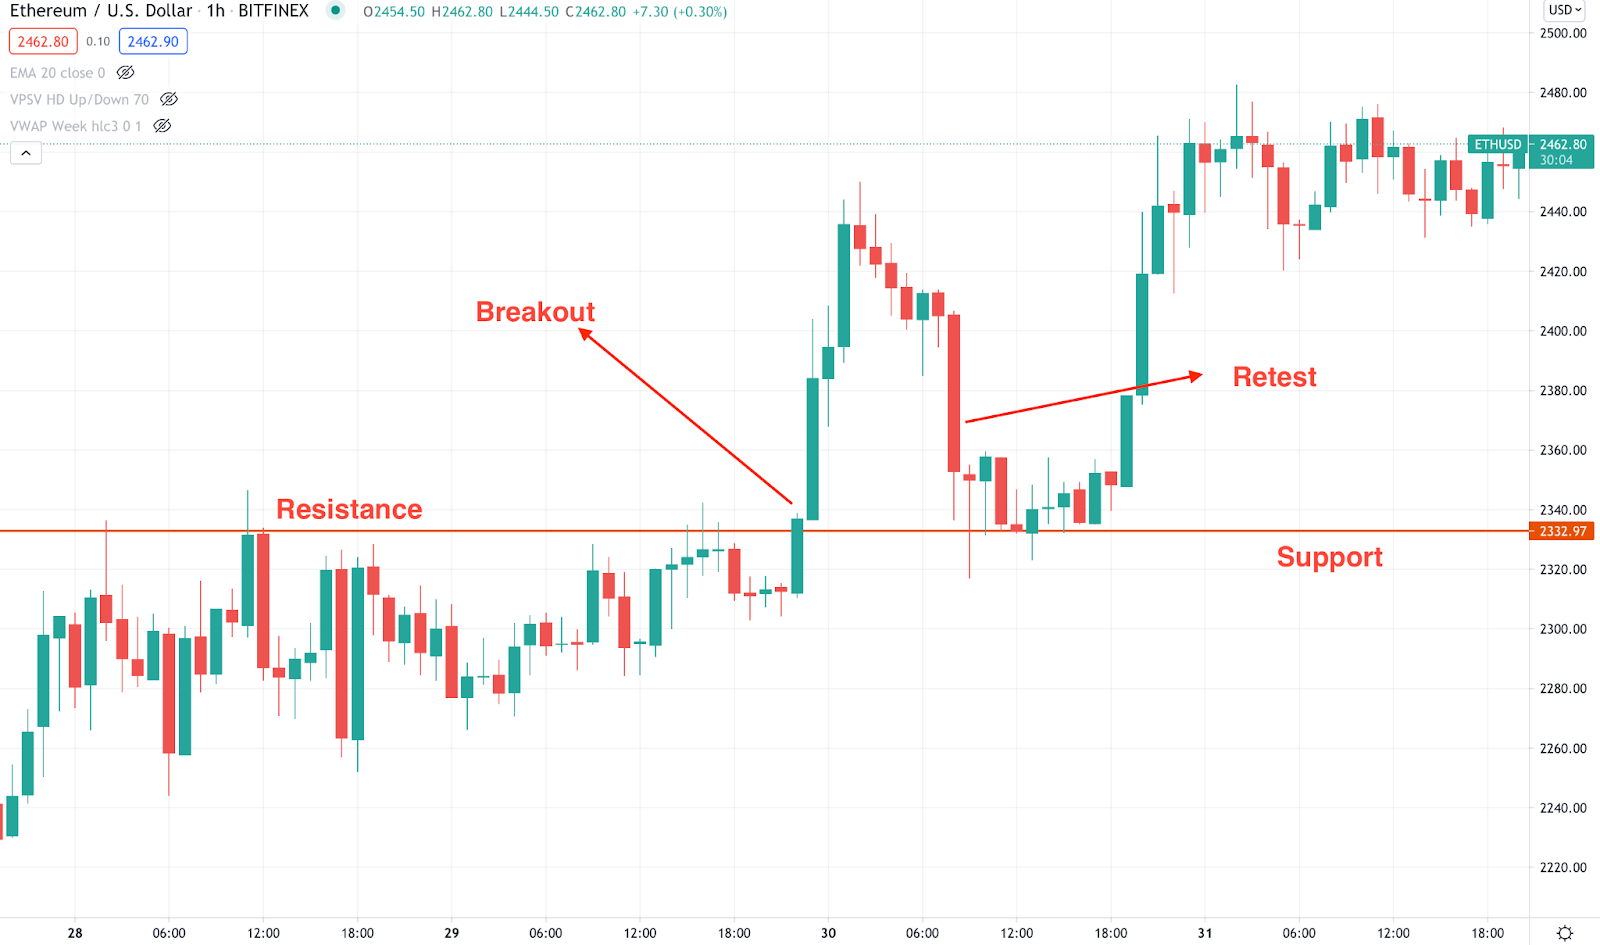
The above ETH intraday chart indicates $2,332.97 working as both support and resistance to the price. The price approaches the resistance and breaks this level with intense buying pressure. Later on, the price comes lower to the support level, where investors should wait for a confirmation to enter a buy.

The buy position becomes valid as soon as a hammer candlestick appears at the support level — the stop loss below the shadow with some buffer. In the above example, the trade closes with a 1:2 R:R as soon as a pin bar appears at the resistance level.
Strategy 3: Intraday Trading with Moving Average
This approach is straightforward and highly profitable if the price is within a trend. First, we have to identify that the overall market trend is bullish. Any bearish correction indicates sellers’ profit-taking, after which buying pressure may resume.

The above image shows that the price moves where the dynamic 20 EMA is working as minor support. In this context, the overall price direction is bullish, and any rejection from the dynamic 20 EMA is a buying possibility.
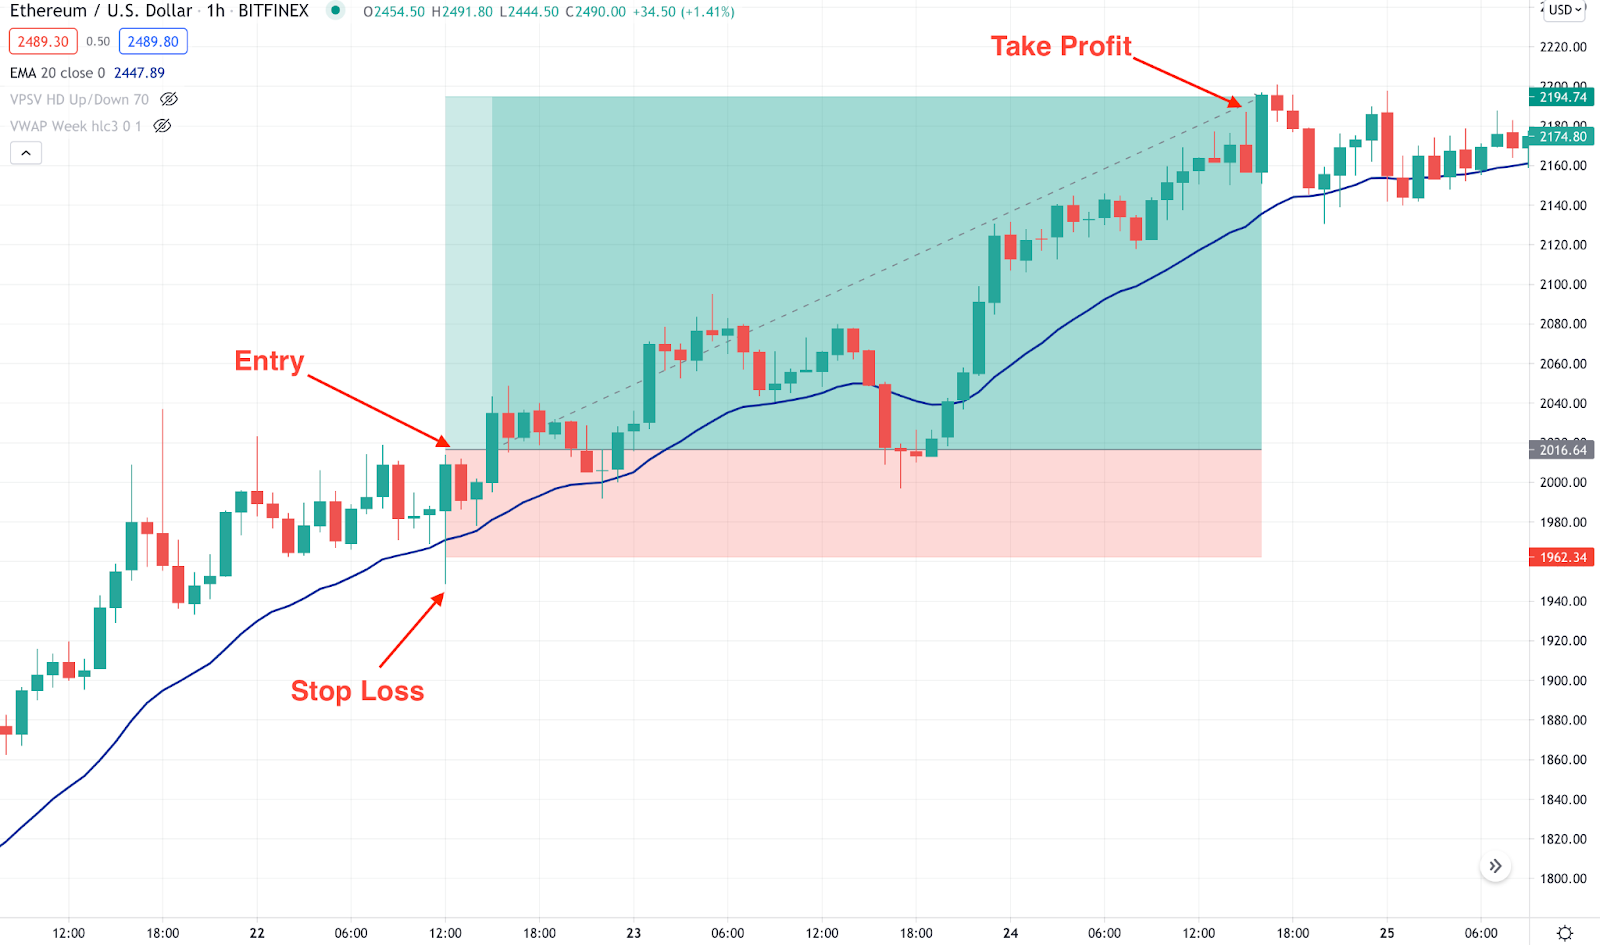
The buy position is valid from the hammer candlestick high, where the stop loss is below the shadow with some buffer. In the above example, the trade closes with a 1:2 R:R as soon as a pin bar appears at the resistance level.
The Pros and Cons of a Hammer Candlestick
Every candlestick has some strengths and weaknesses. No trading tool can guarantee you a 100% profit within any financial market. The hammer is a single candlestick pattern that needs additional confirmation to confirm its validity. Let’s look at its pros and cons.
Pros
- The hammer pattern can show a reliable price trend in all financial markets, including forex, cryptocurrencies, stocks, and indices.
- The hammer perfectly complements other price action tools, such as moving average, support resistance and trend direction.
- Traders can use the hammer as both a trend continuation and reversal pattern.
- After a long bearish trend, the hammer has a higher possibility of showing a solid market reversal.
- The hammer can have either a red or green body, which makes it easier for you to spot reversals.
Cons
- Even if the candlestick appears after a long bearish trend, the price may move down.
- Traders cannot rely solely on a hammer to obtain a strong price direction.
The Limitations of the Hammer Candlestick
Although the hammer is a profitable indicator, it has some limitations that a trader should know before using it.
The hammer candlestick indicates buyers regaining the momentum after an asset makes a new low. However, the buyers’ strength at the end of the day might be a sellers’ retracement. Look at the image below.

Here we see a large sell candle appearing, after which the price moves up with a correction. Therefore, when using the hammer trading strategy, monitor the speed of the retracement. A quick rebound is a sign of reversal, while a correction may lead to more selling pressure on the next day.
The placement of the hammer candlestick is also essential. If you’re a price action trader and want to make a buy trade from every hammer pattern you see in the chart, you might make incorrect decisions. A hammer is solid if found at the bottom of a trend. However, finding a bottom is not an easy task. You can spot it by looking at the price chart. Moreover, you can use other indicators, like the RSI or stochastic oscillator. If these indicators support the hammer, you can consider its indication reliable.
Sign up & earn up to $600 reward bonusesThe Bottom Line
In this trading guide, we’ve learned:
- The hammer is a bullish reversal candlestick that appears after an extended downtrend.
- Success in using the hammer trading strategy depends on the market context, candlestick location, other confirmations, and market momentum.
- Even if you trade a strong hammer candlestick, there is a possibility of taking losses.
- Hammer trading strategies include both swing and day trading.
- The biggest drawback of this pattern is that it might show a retracement of the intraday bearish trend instead of a reversal.
If you’re a cryptocurrency trader, always follow strong money management rules and use other indicators while using the hammer. A good understanding of the market context is important to create an optimal trading strategy. Make sure to build a trading strategy using multiple trading tools that have good track records. Of course, there are plenty of candlestick patterns, always find the best that suits you the most.
Candlestick Patterns Professional Traders Use
Best candlestick patterns – A curated list of candlestick patterns most frequently used by traders
How To Read Candlesticks Crypto – Learn the basics of candlestick patterns
Crypto Chart Patterns (Chart basics: trend, neckline, wedges)
Doji Candlestick – Basic candlestick unit
Bullish candlestick patterns
- Inverted Hammer Candlestick
- Bullish Engulfing Candlestick
- Cup and Handle Patterns
- Morning Star Pattern
- Three White Soldiers Pattern
- Triple Top Pattern and Triple Bottom Pattern
- Falling Wedge Pattern
- Dragonfly Doji Candlestick
Bearish candlestick patterns
- Bear Flag Patterns
- Gravestone Doji Candlestick
- Head and Shoulders Pattern
- Dark Cloud Cover Pattern
- Shooting Star Candlestick
- Rising Wedge Pattern
- Hanging Man Candlestick
- Bear Pennant Pattern
- Evening Star Pattern
- Triple Top Pattern and Triple Bottom Pattern
Other candlestick patterns
- Harami Candlestick – Has both bullish and bearish candlestick
- Double Top and Double Bottom – Has both bullish and bearish candlestick
- Spinning Top Candle – Has both bullish and bearish candlestick
- Marubozu Candlestick Pattern – Has both bullish and bearish candlestick
- Tweezer Bottom Pattern – Has both bullish and bearish candlestick
- Continuation Patterns – Determining a continuing trend
#Bybit #TheCryptoArk