Crypto Chart Patterns and Price Targets Explained
Chart patterns are a key component of technical analysis as they help traders determine future price direction and potential targets. They can be looked at across all time frames and can be applied to various trading strategies from swing trading to scalping. Chart patterns are an excellent tool for traders who are trying to identify continuation or reversals. Let’s take a look at some common crypto chart patterns.
Price Continuation Patterns
Continuation patterns are expected to continue the current price trend and are typically characterized by an impulse move and a consolidation period. Some of the most common continuation patterns ares flags, pennants, and wedges.
Here are some examples of price continuation patterns:

Continuation patterns
Price Reversal Patterns
Reversal patterns are opposite to continuation patterns. They typically reverse the current price trend and cause price to move in the opposite direction. Some of the most common reversal patterns are double tops
Here are some examples of price reversal patterns:

Reversal patterns(Wedges can signal reversals too.)
Neutral Patterns
Neutral patterns are ones that induce a price move, but the direction is unclear. The most common neutral triangle patterns are the Ascending Triangle, Descending Triangle, Symmetrical Triangle, and Symmetrical Expanding Triangle.
See examples below
Neutral patterns
Chart Pattern Price Targets
Let’s focus on flags, pennants, and the head & shoulders patterns to start.
Flags & Pennants
Checklist
- Break: For a bullish flag or pennant, a break above resistance signals that the previous advance has resumed. For a bearish flag or pennant, a break below support signals that the previous decline has resumed.
- Volume: Volume should be heavy during the advance or decline that forms the flagpole. Heavy volume provides legitimacy for the sudden and sharp move that creates the flagpole. An expansion of volume on the resistance (support) break lends credence to the validity of the formation and the likelihood of continuation.
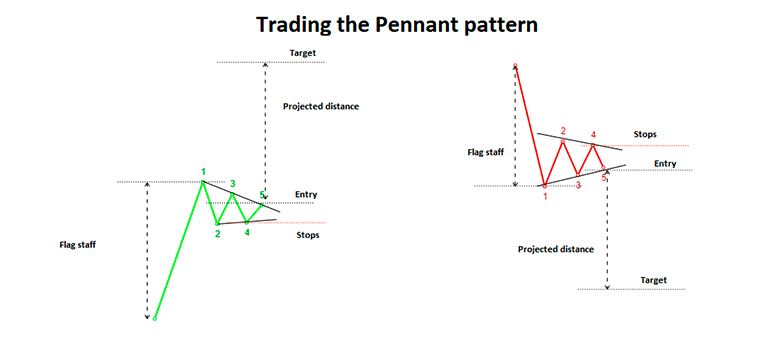
- Targets: The length of the flagpole can be applied to the resistance break or support break of the flag/pennant to estimate the advance or decline.
Here is an example of setting up a trade for both a bullish and bearish pennant (a flag is the same concept just the shape of the consolidation is a rectangle versus a triangle as seen in the examples above).
Head and Shoulders
(Same guidelines are applied to the inverse pattern)
Checklist
Trend recognition: It is important to establish the prior uptrend for this to be a reversal pattern. Without a prior uptrend to reverse, there cannot be a head & shoulders reversal pattern.
Left shoulder: When price is in an uptrend, the left shoulder forms a peak that marks the high point of the current trend. After peaking, a decline begins to complete the formation of the shoulder. The low of the decline usually remains above the trend line, keeping the uptrend intact.
Head: From the low point of the left shoulder, an uptrend begins that exceeds the previous high and marks the top of the head. After peaking, the low of the subsequent decline marks the second point of the neckline. The low of the decline typically breaks the uptrend line, putting the uptrend in jeopardy.
Right Shoulder: The advance from the low of the head forms the right shoulder. This peak is lower than the head (a lower high) and usually in line with the high of the left shoulder. While symmetry is preferred, sometimes the shoulders can be imperfect. The decline from the peak of the right shoulder should break the neckline.
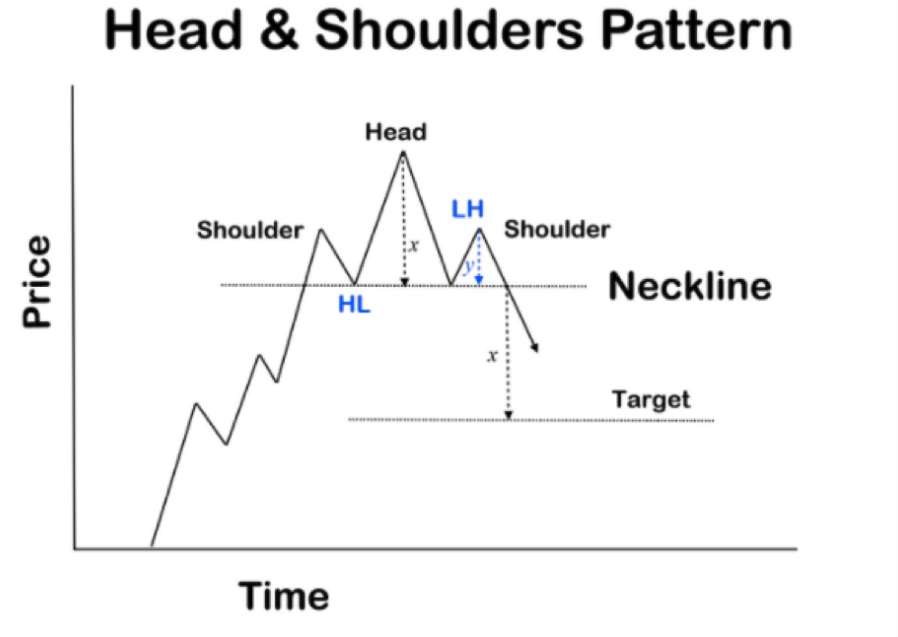
Neckline: The neckline forms by connecting the two low points.The first low marks the end of the left shoulder and the start of the head. The second low marks the end of the head and the start of the right shoulder. Depending on the relationship between the two lows, the neckline can slope up, slope down or be horizontal. The slope of the neckline will affect the pattern’s degree of bearishness — a downward slope is more bearish than an upward slope.
Volume: As the Head and Shoulders pattern unfolds, volume plays an important role in confirmation. Volume can be measured as an indicator (OBV, Chaikin Money Flow) or simply by analyzing volume levels. Ideally, but not always, volume during the advance of the left shoulder should be higher than during the advance of the head. Together, the decrease in volume and the new high of the head serve as a signal. The next signal sign comes when volume increases on the decline from the peak of the head, then decreases during the advance of the right shoulder. Final confirmation comes when volume further increases during the decline of the right shoulder.
Neckline Break: The head and shoulders pattern is not complete and the uptrend is not reversed until neckline support is broken. Ideally, this should also occur in a convincing manner, with an expansion in volume.
Price Target: After breaking neckline support, the projected price decline is found by measuring the distance from the neckline to the top of the head. This distance is then subtracted from the neckline to reach a price target.
See detailed example below.
The same can be applied to an inverse head & shoulders which is a bullish reversal pattern. See below for trade setup examples.
Wedges, Head & Shoulders, Bottoms,& Tops
Here are examples of setting up a trade for wedges, head & shoulders, bottoms & tops.

Candlestick Patterns Professional Traders Use
Best candlestick patterns – A curated list of candlestick patterns most frequently used by traders
How To Read Candlesticks Crypto – Learn the basics of candlestick patterns
Doji Candlestick – Basic candlestick unit
Bullish candlestick patterns
- Inverted Hammer Candlestick
- Bullish Engulfing Candlestick
- Cup and Handle Patterns
- Morning Star Pattern
- Three White Soldiers Pattern
- Hammer Candlestick
- Triple Top Pattern and Triple Bottom Pattern
- Falling Wedge Pattern
- Dragonfly Doji Candlestick
Bearish candlestick patterns
- Bear Flag Patterns
- Gravestone Doji Candlestick
- Head and Shoulders Pattern
- Dark Cloud Cover Pattern
- Shooting Star Candlestick
- Rising Wedge Pattern
- Hanging Man Candlestick
- Bear Pennant Pattern
- Evening Star Pattern
- Triple Top Pattern and Triple Bottom Pattern
Other candlestick patterns
- Harami Candlestick – Has both bullish and bearish candlestick
- Hammer Candlestick – Has both bullish and bearish candlestick
- Double Top and Double Bottom – Has both bullish and bearish candlestick
- Spinning Top Candle – Has both bullish and bearish candlestick
- Marubozu Candlestick Pattern – Has both bullish and bearish candlestick
- Tweezer Bottom Pattern – Has both bullish and bearish candlestick
- Continuation Patterns – Determining a continuing trend
* This content does not represent the views of Bybit. As such, it should be not be seen as trading and financial advice, it is merely an opinion. Trading is done at your own risk.


