Ascending Triangle Pattern: What Is It & How to Use It For Crypto Trading
The ascending triangle, also known as the rising triangle, is a continuation pattern that occurs within a trend. It is a continuation pattern as it typically triggers a breakout from the trend.
In this article, we’ll review what an ascending triangle pattern is, what it looks like and how to trade the pattern, along with the advantages and limitations of using this chart pattern.
Introduction to Triangle Patterns
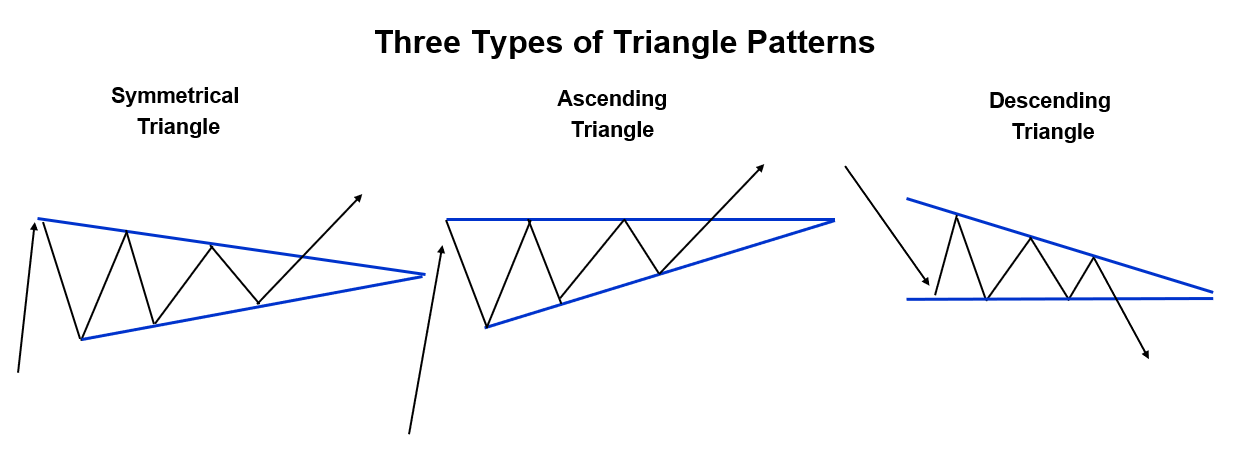
In technical analysis, there are three types of triangle patterns – symmetrical triangle, descending triangle and ascending triangle. These patterns can be used to establish trade setups for trading breakouts. Each is a consolidation pattern that is looked for within a trend.
The symmetrical triangle is a neutral chart formation although it is generally looked at as a trend continuation pattern. An ascending triangle is bullish and is primarily watched for in uptrends, while a descending triangle is a bearish trend continuation pattern. As with any price pattern, traders also anticipate an opportunity in pattern failures. In other words, sometimes the failure of a consolidation breakout can also lead to trading opportunities for more aggressive traders.
What Is an Ascending Triangle?
Given that the ascending triangle pattern is a bullish trend continuation pattern in technical analysis, it forms as price moves into consolidation following a clear advance or uptrend. During this consolidation phase, uncertainty among market participants increases, creating choppy price action as the prices rise and fall relatively rapidly.
This pattern is identified on a chart with a horizontal trendline across the top of the pattern and a rising line along the bottom, forming a right-angle triangle. At least two matching price highs are needed to draw the horizontal line. Usually, a horizontal line is valid by connecting only one high, whereas in an ascending triangle, there should be at least two to ensure a valid horizontal top.
What the price action is showing during pattern formation is that buyers are getting more aggressive than sellers over time as they step up to pay higher prices rather than waiting for the price to fall to prior support within the pattern. This trader behavior creates the uptrend line. If the ascending triangle performs as anticipated, eventually the buying pressure will push the price up above the horizontal price line and trigger a breakout with a pickup in momentum.
Breakouts in Ascending Triangles
As with all consolidation patterns, a breakout should be accompanied by a higher volume. If not, the potential for failure increases. A pattern is not a valid pattern until a breakout occurs, rather it is a potential pattern. A decisive close above the breakout level will eventually complete the pattern.
The volume should be declining as the pattern forms, reflecting less interest from traders over time. Also, the point at which the price is relative to the apex (intersection of the two lines) of the triangle tells us something about when a breakout might occur. A breakout should occur before filling more than 75% of the pattern, if not, the potential for failure increases. And as a consolidation pattern, the ascending triangle may also evolve into larger or different patterns.
False Breakouts and Pattern Failures
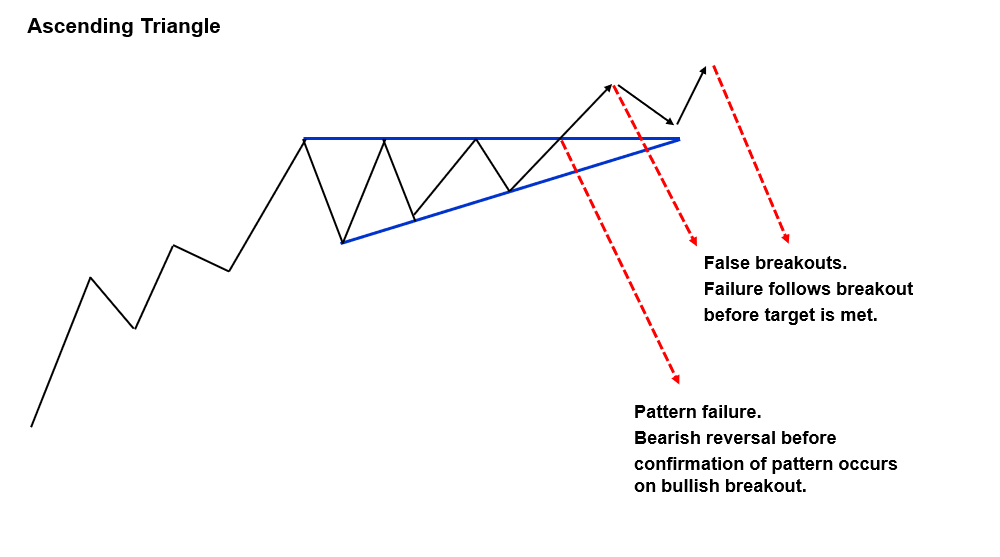
Although this pattern is used for bullish signals, there is also the possibility of a false breakout or pattern failure. Over the years, as technical analysis knowledge and tools have become more widespread, traders seem to also be using trend continuation patterns like ascending triangles for signs of failure and bearish reversals more often than their traditional directional use.
A false breakout occurs when the pattern fails to follow through as anticipated after the breakout. It loses momentum, and subsequently falls back into the price area represented by the triangle or even lower.
Alternatively, a pattern failure may occur before there is a breakout signal. Once a pattern failure occurs, the pattern is either evolving into a larger or different consolidation pattern, or a bearish reversal is occurring. The classic entry for a pattern failure occurs on a decisive drop below the rising line or below the more significant swing low at the beginning of the uptrend line.
Measuring the Profit Target for an Ascending Triangle
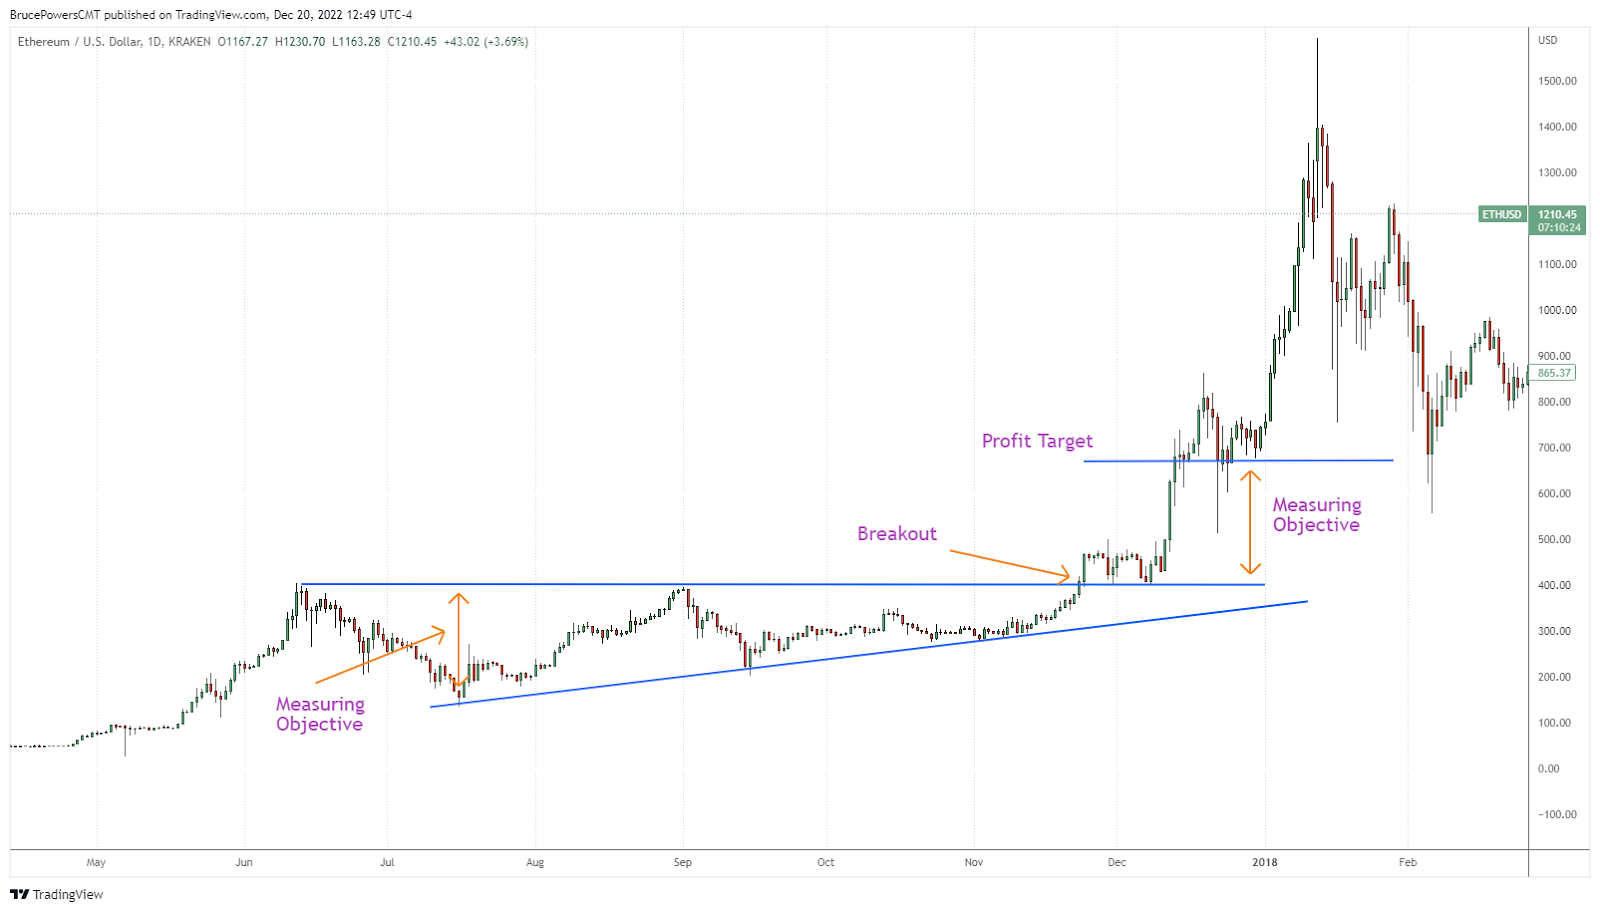
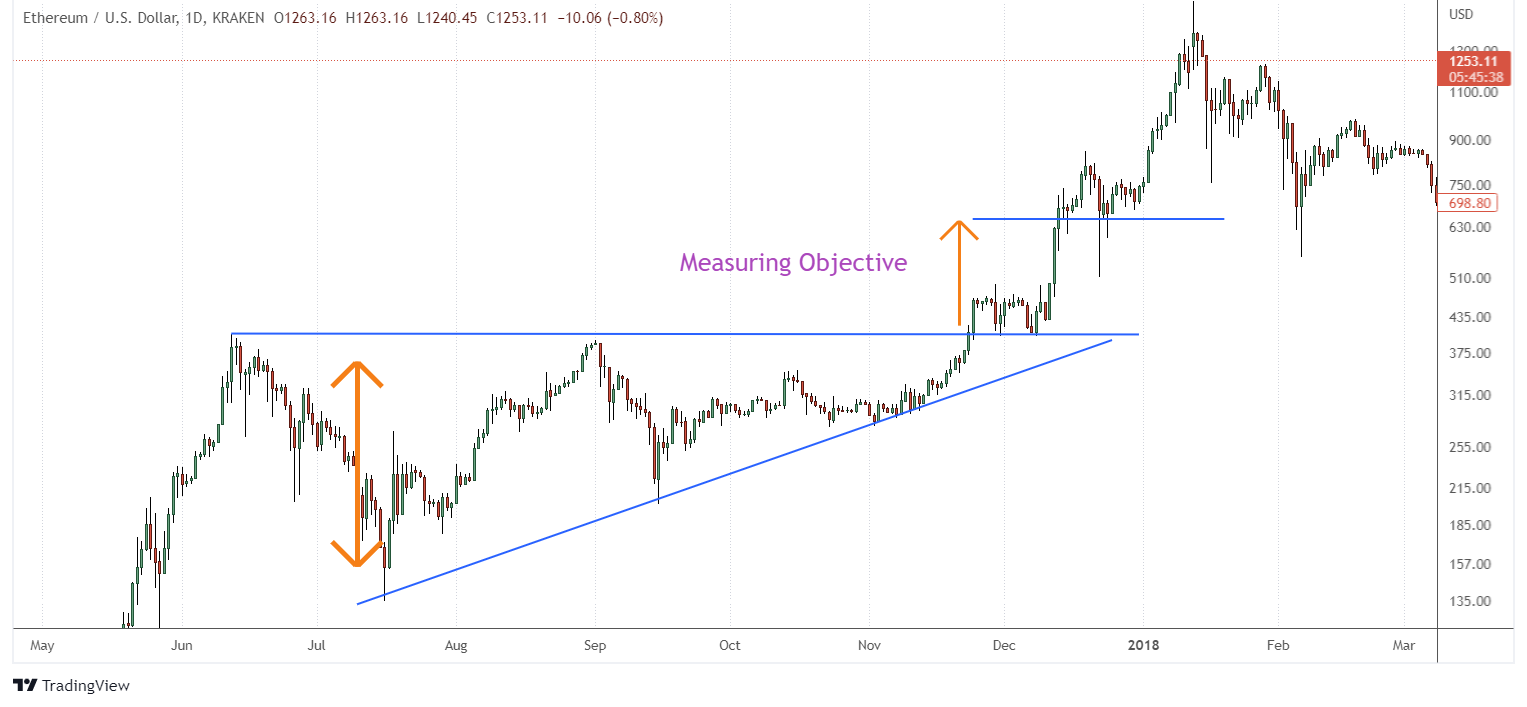
A measuring objective is calculated from the range of the pattern to identify the minimum profit target based on the pattern. Take the high to low price at the points in which the pattern begins to form. In this case, the points are where both lines exist and where the lower line begins. That price range then gets added to the breakout level to determine the initial profit target.
How to Spot an Ascending Triangle Chart Pattern
To find ascending triangles, you need to first find rising price trends. Then, look for consolidation to see if the criteria for drawing two lines holds for the pattern you are studying.
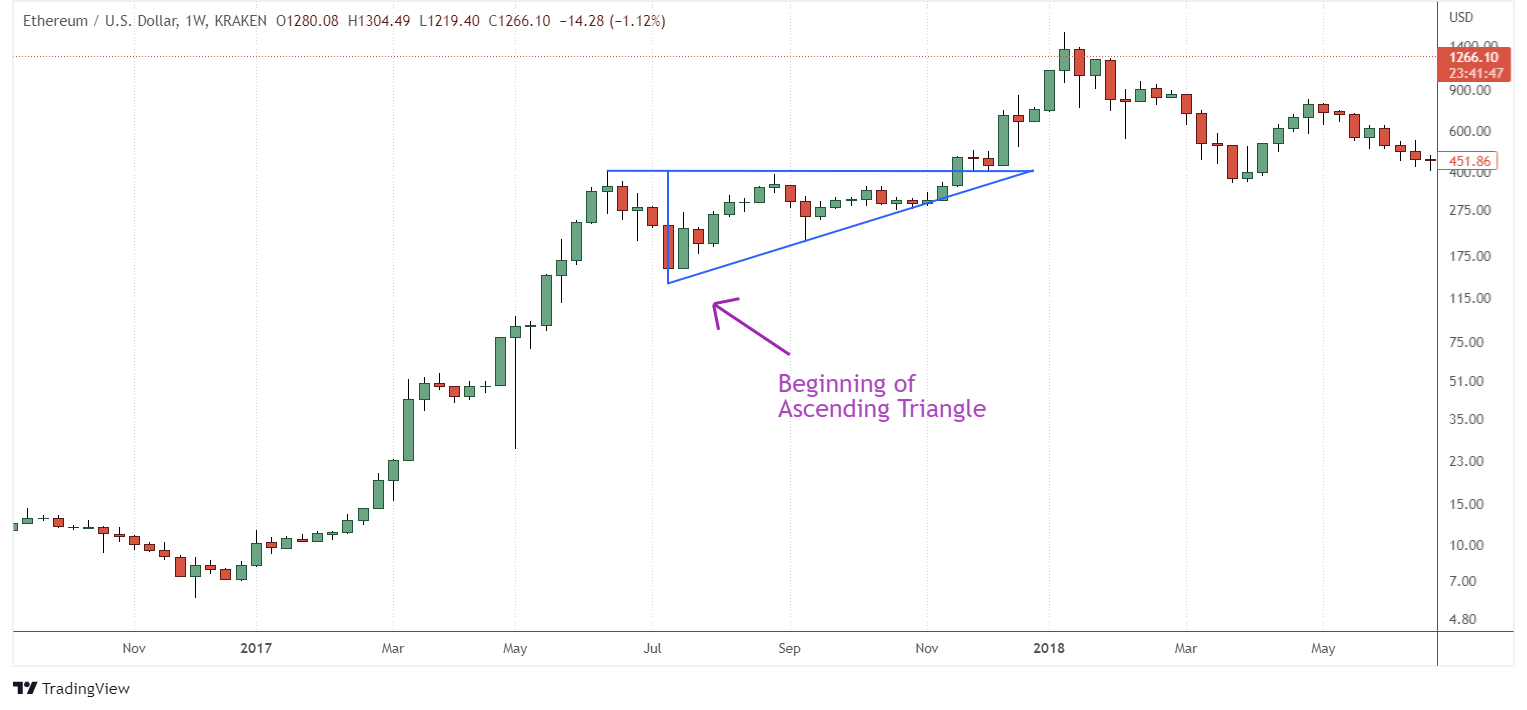
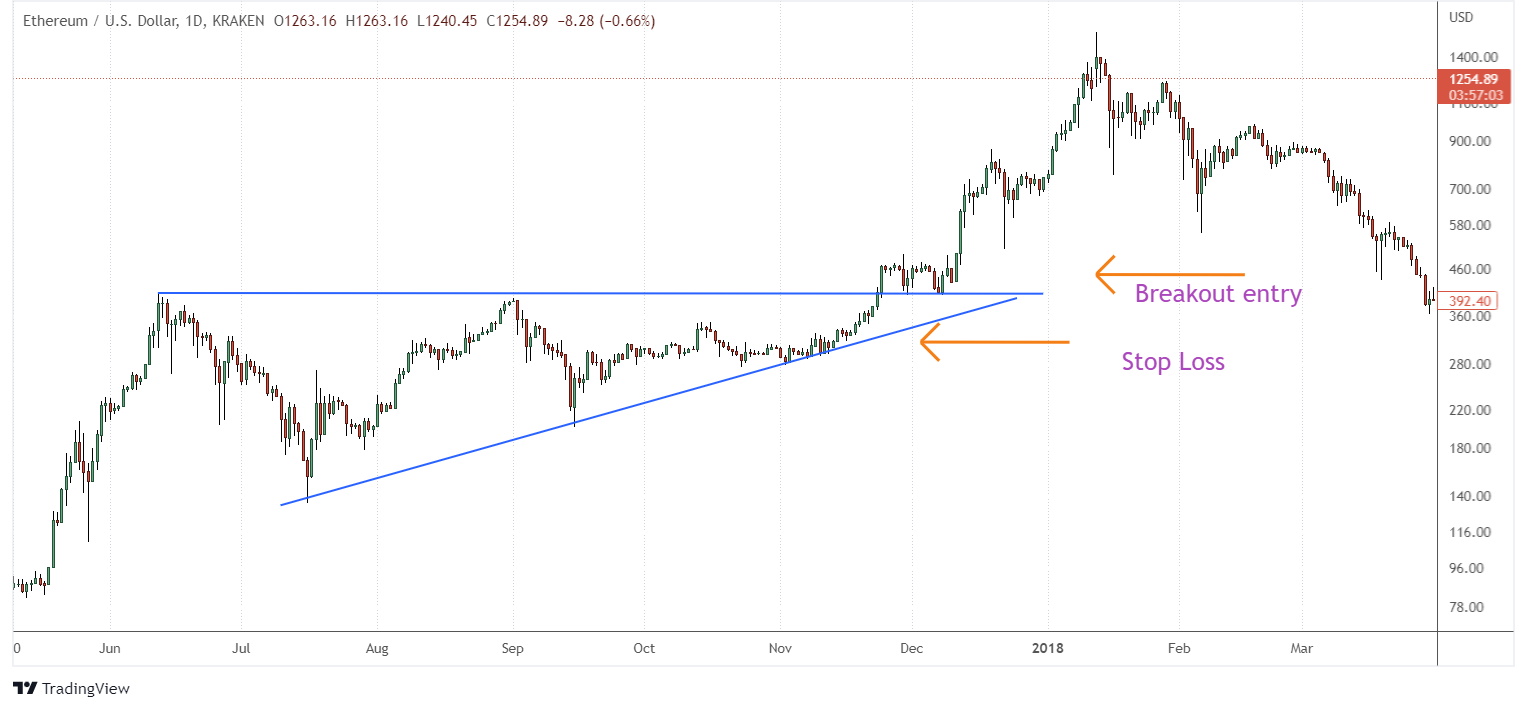
Below is a weekly chart of ETH/USD, showing the price moving into consolidation following a sustained advance of lower prices. The pattern of consolidation can be recognized by drawing the two lines on the pattern perimeter. In this case, the upside breakout occurred as expected.
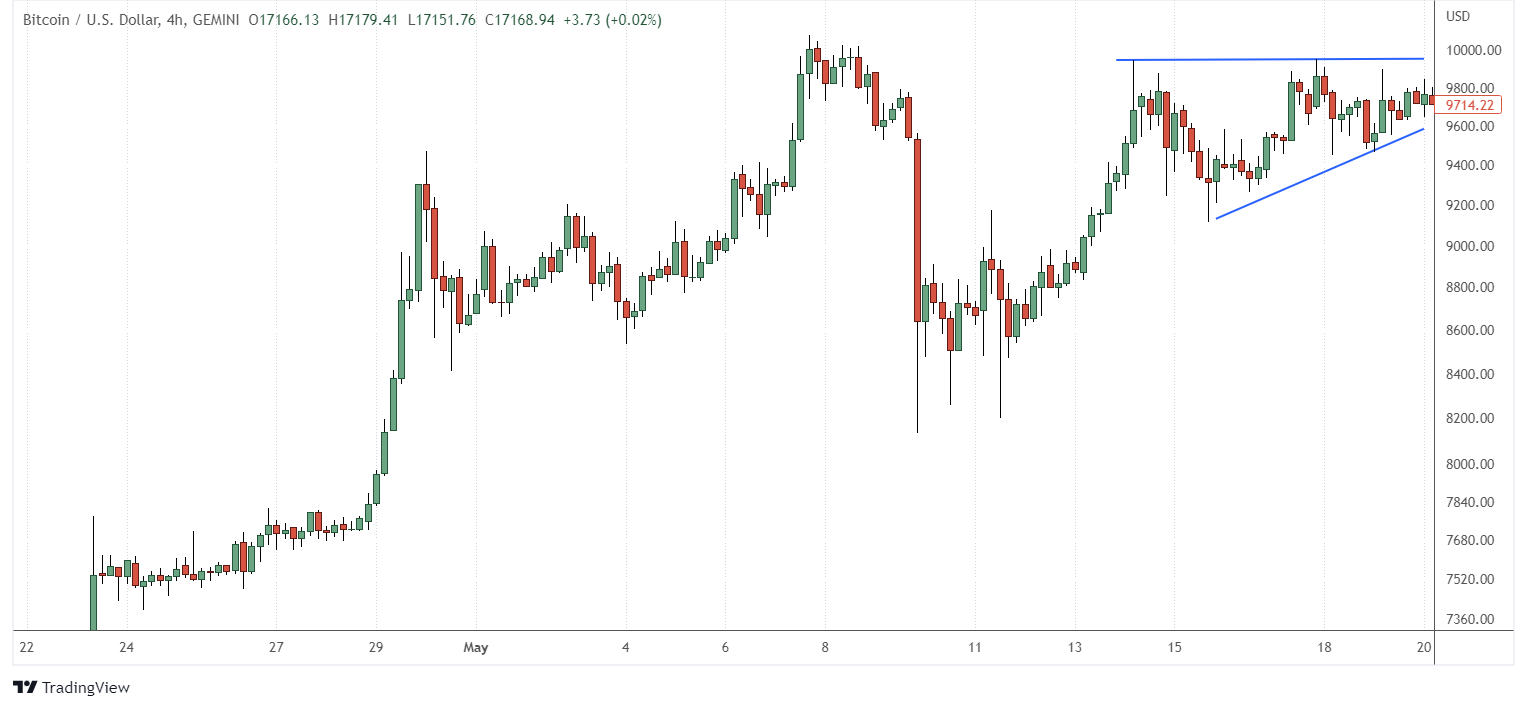
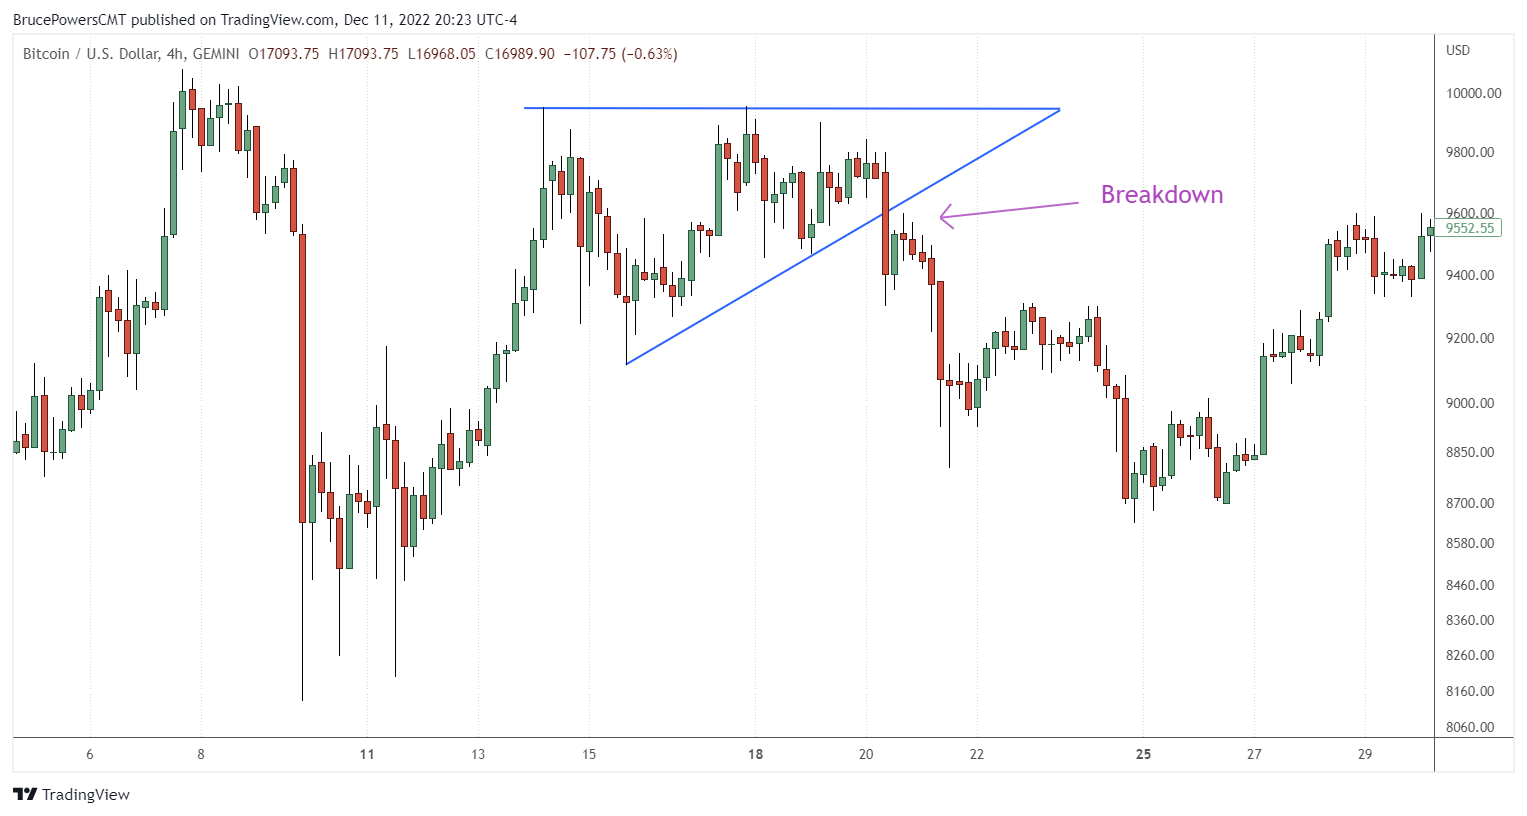
In the second chart below, there is a potential ascending triangle identified in a 4-hour chart of BTC/USD. Confirmation of the pattern occurs on a breakout trigger above the horizontal line. So far, we don’t see such a breakout and the pattern is still evolving. It is not yet a valid ascending triangle as a breakout above the horizontal line has not yet occurred.
Situation analysis:
- BTC/USD is in an overall uptrend.
- Two highs create the horizontal line and two lows create the rising line.
- Price is moving closer to the apex of the triangle and everything looks good.
- Nevertheless, the bullish pattern fails as the price drops below the upward slanting trend line of the ascending triangle.
- Therefore, this shows that a pattern is not valid until the price breaks out of the pattern.
How to Trade With Ascending Triangle
As with all consolidation patterns, the ascending triangle can be used to build a specific trade plan by only using the parameters of the pattern. The classic entry would be on a breakout above the high of the pattern, which is marked by the horizontal line.
For better assurance that the breakout is real and has the potential to keep going, most traders would look to buy around $0.08 to $0.15 above the horizontal line. Nevertheless, nothing is for sure, so you should always be prepared by using a stop-loss to help with risk management.
Let’s now look at one of the strategies to establish a trade plan by only using the ascending triangle pattern. The same triangle setup on the weekly chart of ETH/USD above will be used for this example.
Trade plan components:
- Setup
- Trigger
- Size
- Initial Stop-Loss
- Target
Setup: Ascending Triangle
Through the rising trend, you can see the ascending triangle forming with its series of highs and lows. The price is getting closer to the apex of the triangle and therefore, a breakout or failure should occur soon.
Entry Trigger: $405.09
Enter on breakout above horizontal pattern high. Enter at $405.09, which is $0.10 above the high of the pattern at $404.99.
Size: Based on trader-specific risk management strategies.
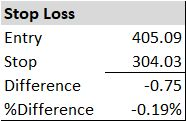
Stop-Loss: $304.03
Aim to exit at $0.10 below the support of the pattern. Since the bottom of the ascending triangle is upward-sloping, the rising trendline identifies the support. Therefore, a drop below it is a sign of failure. The price of $304.13 will be used as an estimate for the price at the line and $304.03 as the exit trigger.
Target: $506.15, +66.7%
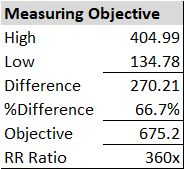
The measuring objective is calculated from the range of the pattern to identify a minimum target. The high of $404.99 less the low of $134.78 gives us a price distance of $270.21. That distance is then added to the high, giving us a profit target of $506.15. This objective is used for the trade target.
Reward vs. Risk Ratio (RR): 360x
Is this trade worth the risk? The standard minimum RR ratio that most traders look for is 3 to 1 (3:1) — risking $1 to make $3. To calculate the RR ratio for this ETH/USD trade, take the profit at objective divided by the potential loss: 270.21/0.75 = 360x. This is a very high reward-to-risk ratio given that it is ETH/USD in 2017, during which the trade is risking $1 to make $360, assuming the objective is reached. However, the objective is not always reached, especially given the volatility of cryptocurrency. Therefore, you should tighten your risk with trailing stops as your trade moves further into profits.
DISCLAIMER: Examples presented are for educational purposes only. It is not a recommendation to trade with real money. There is significant risk when trading crypto assets and readers should consult with an investment advisor before making investment decisions.
Advantages and Limitations of an Ascending Triangle
Advantages | Limitations |
|
|
Some risks lie within the limitations as well, so let’s take a quick look at how we might mitigate the impact. As with any trade, the chance for failure exists. Therefore, you will need to use a stop-loss to control your potential loss. The quality of an ascending triangle pattern will also vary between patterns. As you get more knowledgeable, you will be better able to pick one ascending triangle over another. Further, the location of the pattern within the larger pattern can provide additional insight. Finally, additional technical analysis tools, such as multiple time frame analysis and Fibonacci ratio analysis can be used to provide greater context for the pattern setup, allowing a trader to pick the best setups among a group of possibilities.
Ascending Triangle vs. Rising Wedge
Both the ascending triangle and rising wedge are consolidation patterns with rising bottoms, but the top lines are different with varying interpretations. An ascending triangle is a bullish continuation pattern as buyers work to push the price higher above the horizontal line. While the rising wedge may sound like a bullish pattern, it is actually bearish as it reflects the exhaustion of buyers over time. A wedge is also different in that it will be bearish in both a downtrend and an uptrend. For the rising wedge, both lines will head upward and eventually cross each other.
Ascending Triangle vs. Symmetrical Triangle
The symmetrical triangle pattern is generally looked at as a continuation pattern but its symmetrical nature makes it prone to a breakout in either direction. Converging lines are drawn across the top and bottom of the pattern, highlighting the bullish and bearish natures of the pattern respectively. This shows that the symmetrical triangle is conflicted as both buyers and sellers are getting more aggressive during the consolidation.
Ascending Triangle vs. Descending Triangle
An ascending triangle is bullish while the descending triangle consolidation pattern is bearish. Both are trend continuation patterns. A descending triangle is used primarily in bear trends. It is drawn with a horizontal line across the bottom of the pattern and a falling line across the top. Rallies off the horizontal area of the pattern are met with more aggressive sellers over time as reflected in the falling trendline. That selling pressure kicks in on a decisive drop below the horizontal price level, which is used for a bear trigger.
The Bottom Line
The ascending triangle is a bullish trend continuation pattern looked for in rising trends. It occurs when the price of an asset fluctuates between a horizontal upper trendline and an upward-sloping lower trendline. The upward-sloping line is indicating that buyers are getting more aggressive over time as the pattern develops. That aggressiveness is expected to show up as a burst of price momentum once an upside breakout occurs. All the information needed to establish a trading strategy is contained within the pattern, making it easy to use for both beginners and experienced traders.
Candlestick Patterns Professional Traders Use
- Best candlestick patterns – A curated list of candlestick patterns most frequently used by traders
- How To Read Candlesticks Crypto – Learn the basics of candlestick patterns
- Crypto Chart Patterns (Chart basics: trend, neckline, wedges)
- Doji Candlestick – Basic candlestick unit
- Bullish candlestick patterns
Bearish candlestick patterns
Other candlestick patterns
Harami Candlestick – Has both bullish and bearish candlestick
Hammer Candlestick – Has both bullish and bearish candlestick
Double Top and Double Bottom – Has both bullish and bearish candlestick
Spinning Top Candle – Has both bullish and bearish candlestick
Marubozu Candlestick Pattern – Has both bullish and bearish candlestick
Tweezer Bottom Pattern – Has both bullish and bearish candlestick
Continuation Patterns – Determining a continuing trend
