Learn From Smart Money: Observing Market Sentiment From Derivatives Data
Derivatives trading has been an important part of the broader crypto economy and the most important price discovery venue for cryptocurrency, especially for blue chips like BTC, ETH and SOL. Professional traders and institutions have been using futures and options as part of their portfolios to hedge their positions, improve the execution of their strategies and potentially increase the profitability of their portfolios.
Most participants in the cryptocurrency derivatives markets are professional traders (or as some may call them, smart money) who are often at the forefront of crypto trading.. Observing the derivatives markets by constantly examining the relevant data could provide valuable insights into how these professional traders see the market.
In this article, we’ll provide a practical overview of derivatives trading data and explain how an everyday trader can extract actionable information from this data. By discussing how this data can help us make more informed trades, we aim to equip traders with the tools they need to navigate the market effectively.
Mastering Open Interest
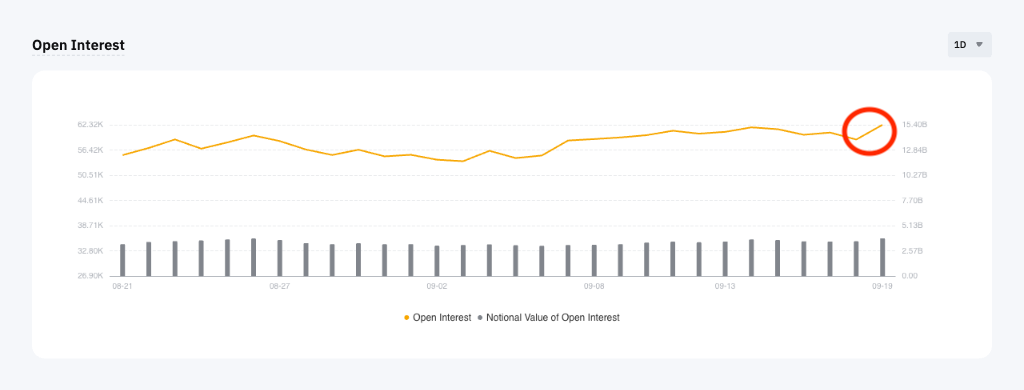
Open interest (OI) is one of the most common metrics in crypto derivatives trading. It refers to the number of outstanding unsettled (opened) contracts — whether perpetual, futures or options — that market participants hold at any given time.
Figure 1: BTCUSDT Perpetual open interest on Bybit
Source: Bybit
OI is essential because it essentially tracks the number of active market participants and, to some extent, is able to reflect the level of willingness of these professional traders to make trades at a specific time.
For example, Figure 1 shows the total BTCUSDT Perpetual OI on Bybit. There was a clear spike in OI on September 19, 2024, when the United States Federal Reserve delivered its 50 bps rate cut. This surge in OI could mean traders have been more willing to bet on BTC prices after confirmation of the cut.
It’s important for general traders to know how active the market is. If the market is active, it could give asset prices stronger momentum. In contrast, a less active market with a continuing lower OI could mean that traders are in a wait-and-see mode.
Trendspotting With Long/Short Ratio
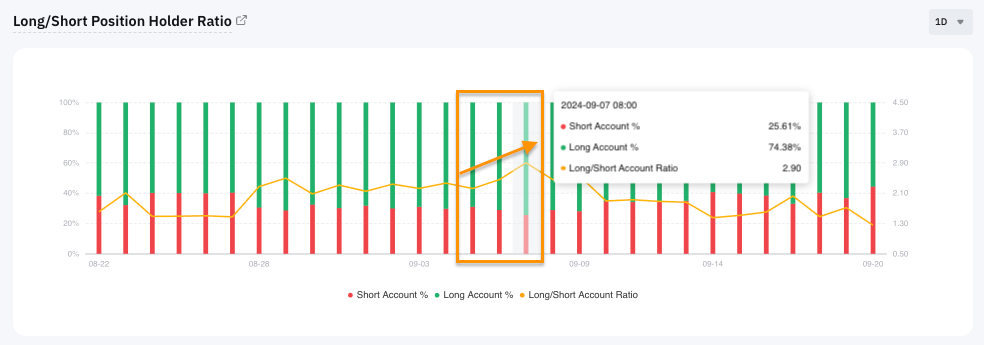
The long/short ratio is another derivatives trading indicator from which we can extract important information. It essentially gives you a glimpse of oversold sentiment among professional traders. As the name suggests, the long/short ratio expresses the net long and net short positions as percentages of all position holders within a specific period.
Figure 2: Bybit’s BTCUSDT Perpetual daily long/short ratio.
Source: Bybit
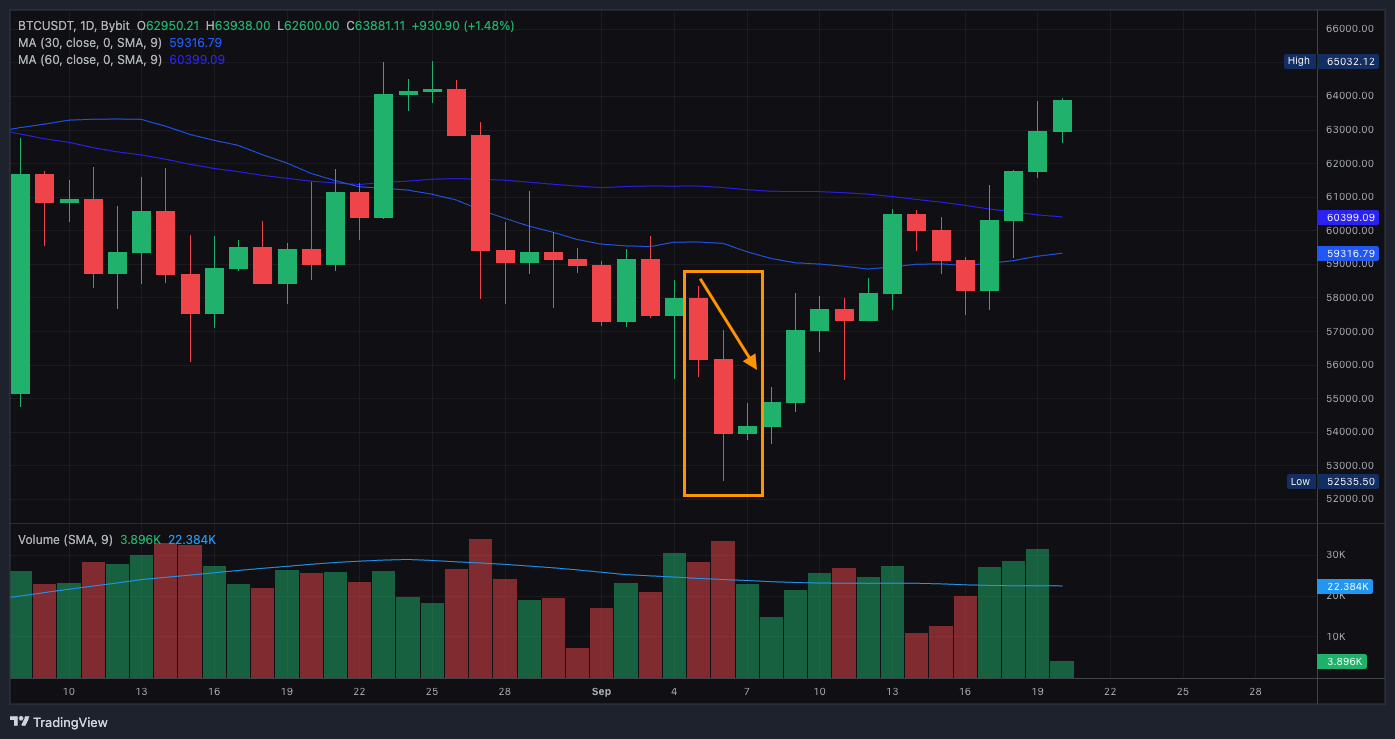
Examining the changes in the long/short ratio could also give general traders more confidence to spot trends. For example, in early September 2024, BTC prices saw noticeable fluctuations, from around $64,000 in late August to near $52,000 in early September.
Figure 2 shows the daily long/short ratio of BTCUSDT on Bybit. During the sell-off, the long-short account ratio increased for three consecutive days and reached 2.9 on September 7, 2024, the highest level in a recent month.
Figure 3: BTCUSDT daily chart
Source: Bybit
Interestingly, as Figure 3 suggests, the price of BTC decreased during the highlighted period while the number of long accounts accumulated. This divergence could imply that derivatives traders have been gearing up for a potential trend reversal, thereby opening more long positions.
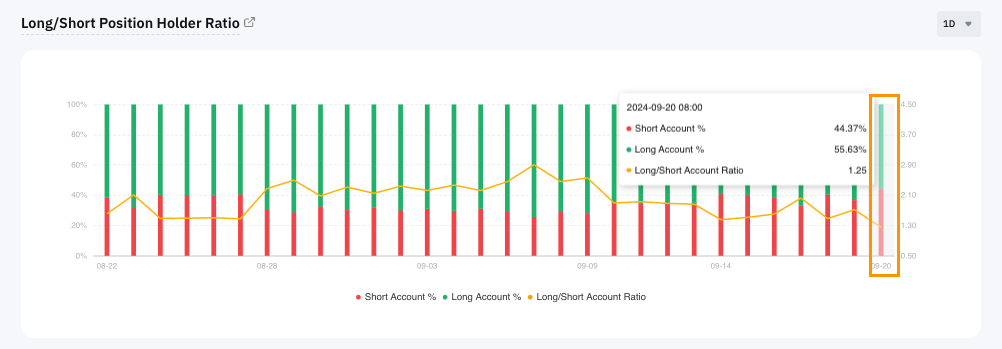
Let's look at the recent BTCUSDT perpetual long/short ratio. Figure 4 shows the ratio dropping from 1.71 on Sep 19, 2024 to 1.25 on September 20, one day after the Fed's rate cut. Despite the market seeming to react positively after the cut is delivered, the long/short ratio shows that short accounts have actually increased.
This increase could be interpreted as traders taking a relatively conservative stance, choosing not to increase their long positions and to hedge with additional short positions as BTC’s price increases. It would be instructive to look at readings for the next few days to reach a clear conclusion.
Figure 4: Bybit’s BTCUSDT Perpetual daily long/short ratio
Source: Bybit
It's worth noting that the long/short ratio can also be categorized by trader profile, such as the top 100 largest position holders. It can also be viewed under a different time frame, such as one hour or 30 minutes. Each of these parameters may provide different information. We highly recommend users reference multiple data points from different categories to get a more complete picture.
Visit Bybit Learn for more information about trading Perpetual contracts. We also recommend the following reading:
- Bybit Pre-Market Perpetuals: Secure Early Gains and Hedge Effectively
- What Is Bybit Unified Trading Account and How Does It Work?
Examining Options Trading Data
Options have been one of the most favorite trading products for professionals, especially institutional traders. The flexibility and composability of options enable traders to use complex position setups and strategies. Looking into options trading data may give us a peek at how these professional participants have been setting up their trades.
Understanding OI by Expiration & Strike Price
As with perpetual contracts, open interest in options refers to the number of opened contracts within a specific time frame. Options contracts also have many more parameters than perpetual contracts, and open interest alone can be filtered by types of options, expiration dates, strike prices and much more. Let's take a look at the below examples.
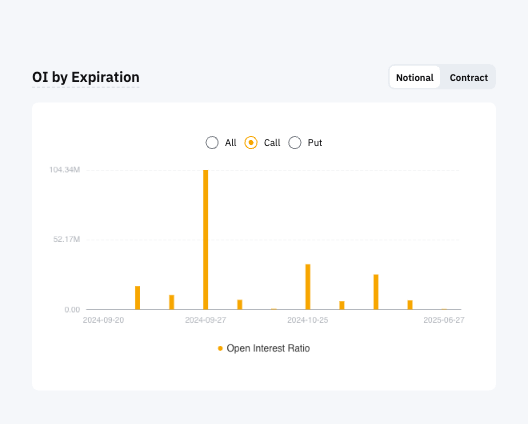
Figure 5a: BTC call options OI by expiration.
Source: Bybit
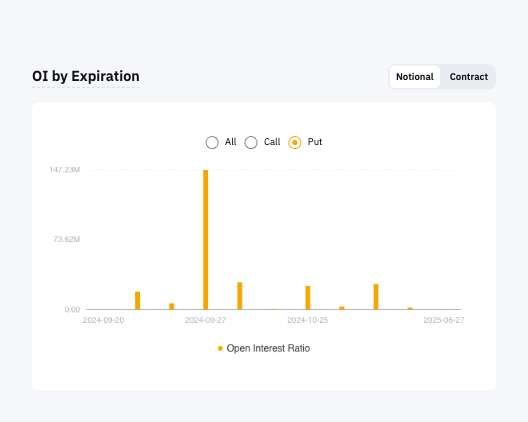
Figure 5b: BTC put options OI by expiration.
Source: Bybit
Figures 5a and 5b (above) show the OI of BTC call and put options by expiration dates. In September 2024, most of the OI, both call and put, was on the contract with a Sep 27, 2024 expiration. Traders seem to have been betting on where BTC will go by the end of the month.
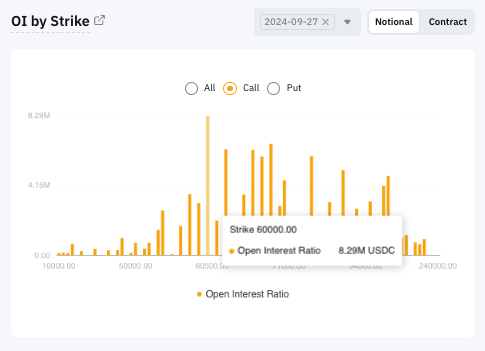
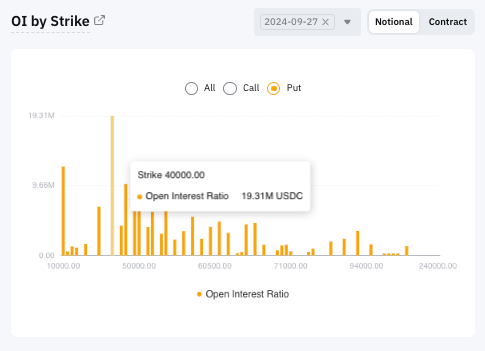
Now, let's look at the strike prices among the OI with the Sep 27, 2024 expiration date. Figure 6a suggests that most of the OI for BTC calls was at $60,000, while Figure 6b indicates that the $40,000 put has the most OI.
This gives us a price range as a reference, which could mean that options traders who are betting on BTC prices to rise by the end of the month seem to believe that by the expiration date (September 27), BTC will have a chance to hit $60,000 or above.
In addition, traders have been using relatively out-of-the-money (OTM) and less expensive put options to protect their long positions. This could explain why $40,000 has most of the OI.
Figure 6a: BTC call options OI by strike price.
Source: Bybit
Figure 6b: BTC put options OI by strike price
Source: Bybit
So, how can this information be interpreted? At the time of this writing, BTC was trading at around $62,000. A $60,000 call option is in-the-money; if someone has a stronger bias toward a positive price action in the short or medium term, they would certainly buy in BTC calls with high strike prices. If there's a noticeable shift of the OI toward high strike prices' call options, that could mean that the positive sentiment of the post-rate cut could still be somewhat sustaining. Otherwise, it could be interpreted as a conservative setup.
To sum up, based on the above-mentioned data, BTC derivatives traders seem to have remained somewhat bullish after the Fed’s rate cut. However, it seems that most participants were cautiously optimistic, without over-leveraging, and perhaps wanted to see more confirmation of a trend reversal before making additional trades. The Bybit Contract Data page offers comprehensive information on perpetual, futures and options trading data. During WSOT 2024, the Bybit Learn team will produce articles and analyses based on the contract data to provide additional insight so that users can make more informed trades.
Conclusion
In some ways, exploring derivatives data is similar to walking in the dark: perhaps you’ll be able to see the road just in front of you, but you certainly won't see too far. It’s also like a puzzle in that each piece of data can give you a little information, but you certainly can't see the complete picture with just one piece. Besides, there are many ways to interpret this data, and everyone may have a different interpretation. We encourage users to study derivatives trading in general, and to become familiar with this data.
While learning about derivatives trading (and using data) can be a powerful approach, it also has limitations, and is usually more applicable to blue chip cryptocurrencies.
The Bybit Contract Data page offers comprehensive information on perpetual, futures and options trading data. During WSOT 2024, the Bybit Learn team will produce articles and analyses based on the contract data to provide additional insight so that users can make more informed trades.
