Learn From Smart Money: ETH’s Rally May Need a Break, but Upside Risk Remains Intact
The price of ETH caught up to BTC and SOL over the weekend and gained about 2% on the back of thin liquidity. While speculators may be betting on a price breakthrough for ETH, derivatives trading data shows that traders can expect the rally of the second-largest market cap crypto to pause here before another attempt to break higher. This article will dive into the trading data of ETH derivatives on Bybit, and provide some trade ideas for WSOT 2024.
Open Interest in ETH Derivatives at High Levels
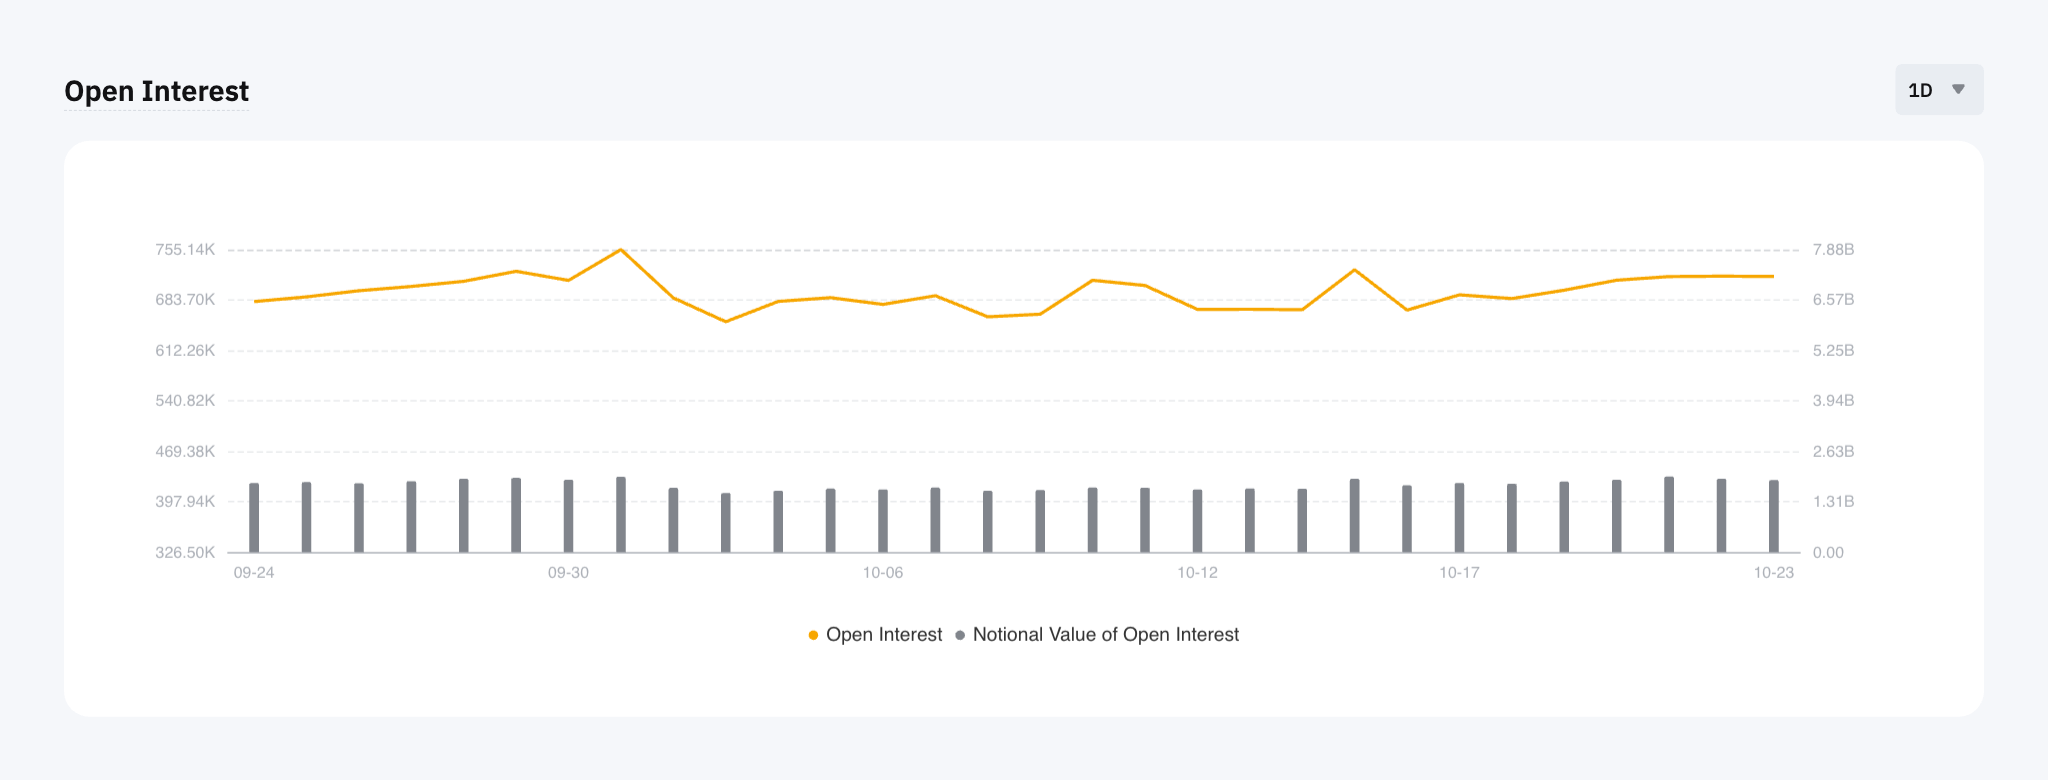
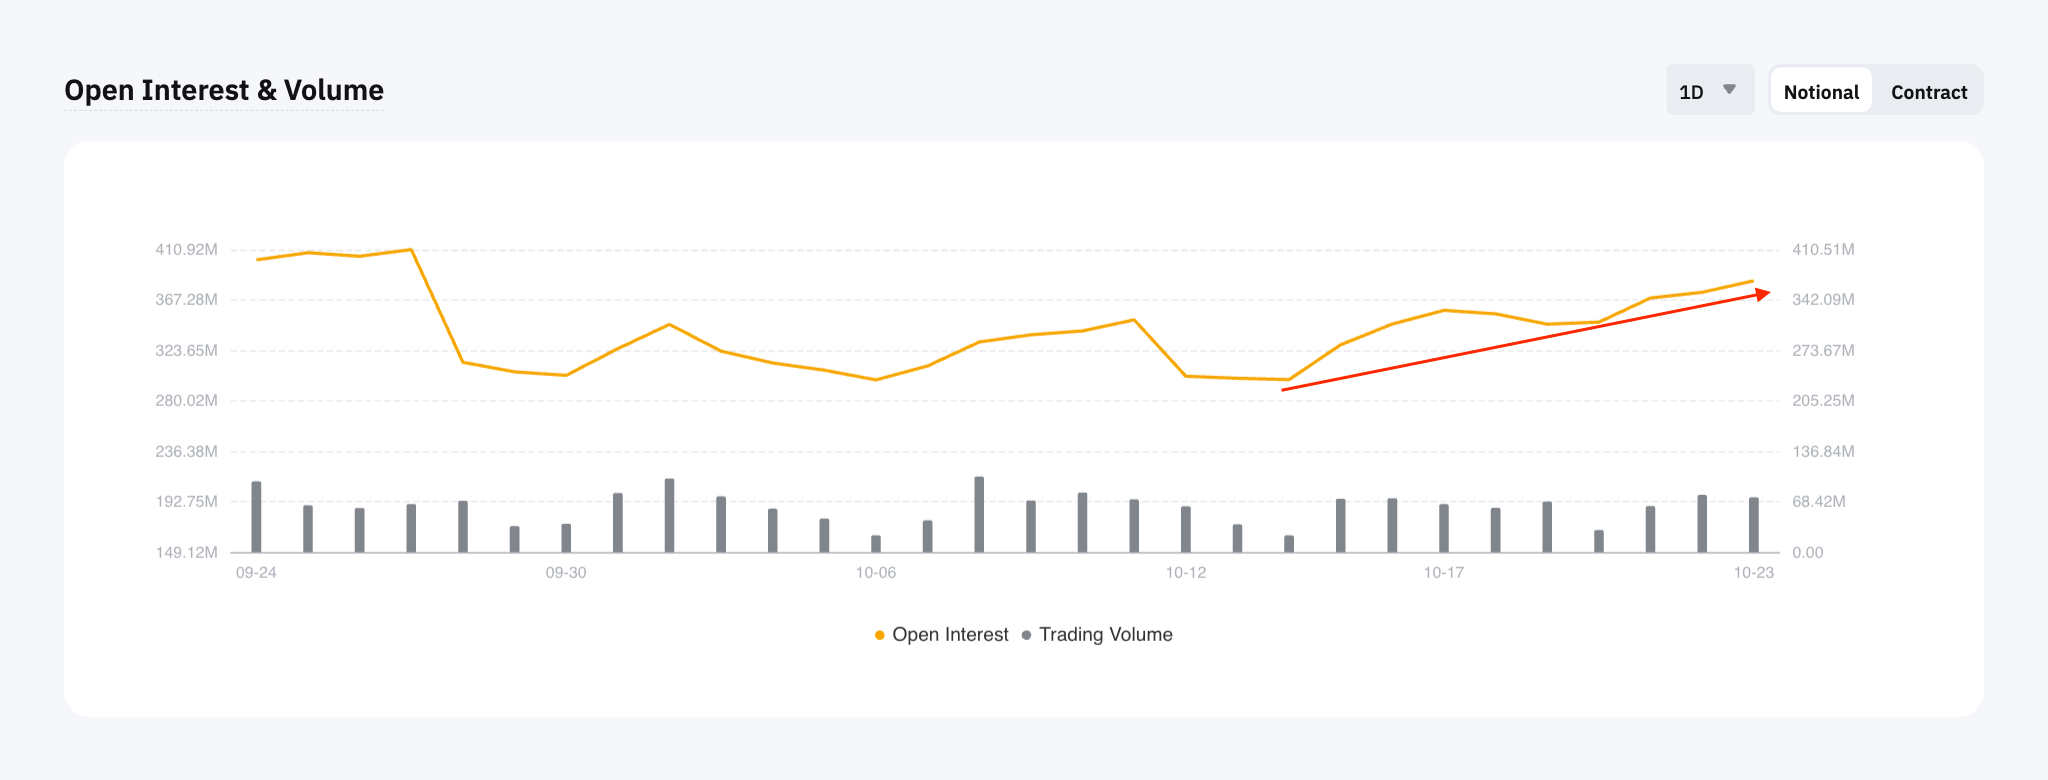
ETH has received much attention, as the weekend rally may have caught some traders by surprise. Derivatives traders have been showing interest in betting the price movement of ETH with perpetual and options contracts even before the weekend rally. Data from Bybit shows that daily open interest has been increasing on ETH perpetual and options contracts for several consecutive days.
Figure 1: ETHUSDT Perpetual open interest on Bybit. Source: Bybit
Figure 2: ETH options open interest on Bybit. Source: Bybit
As we highlighted in our previous publication, open interest is an important indicator because it tracks the number of active market participants and, to some extent, reflects the level of willingness of these professional traders to make trades at a specific time.
Long/Short Ratio Points to a Pause
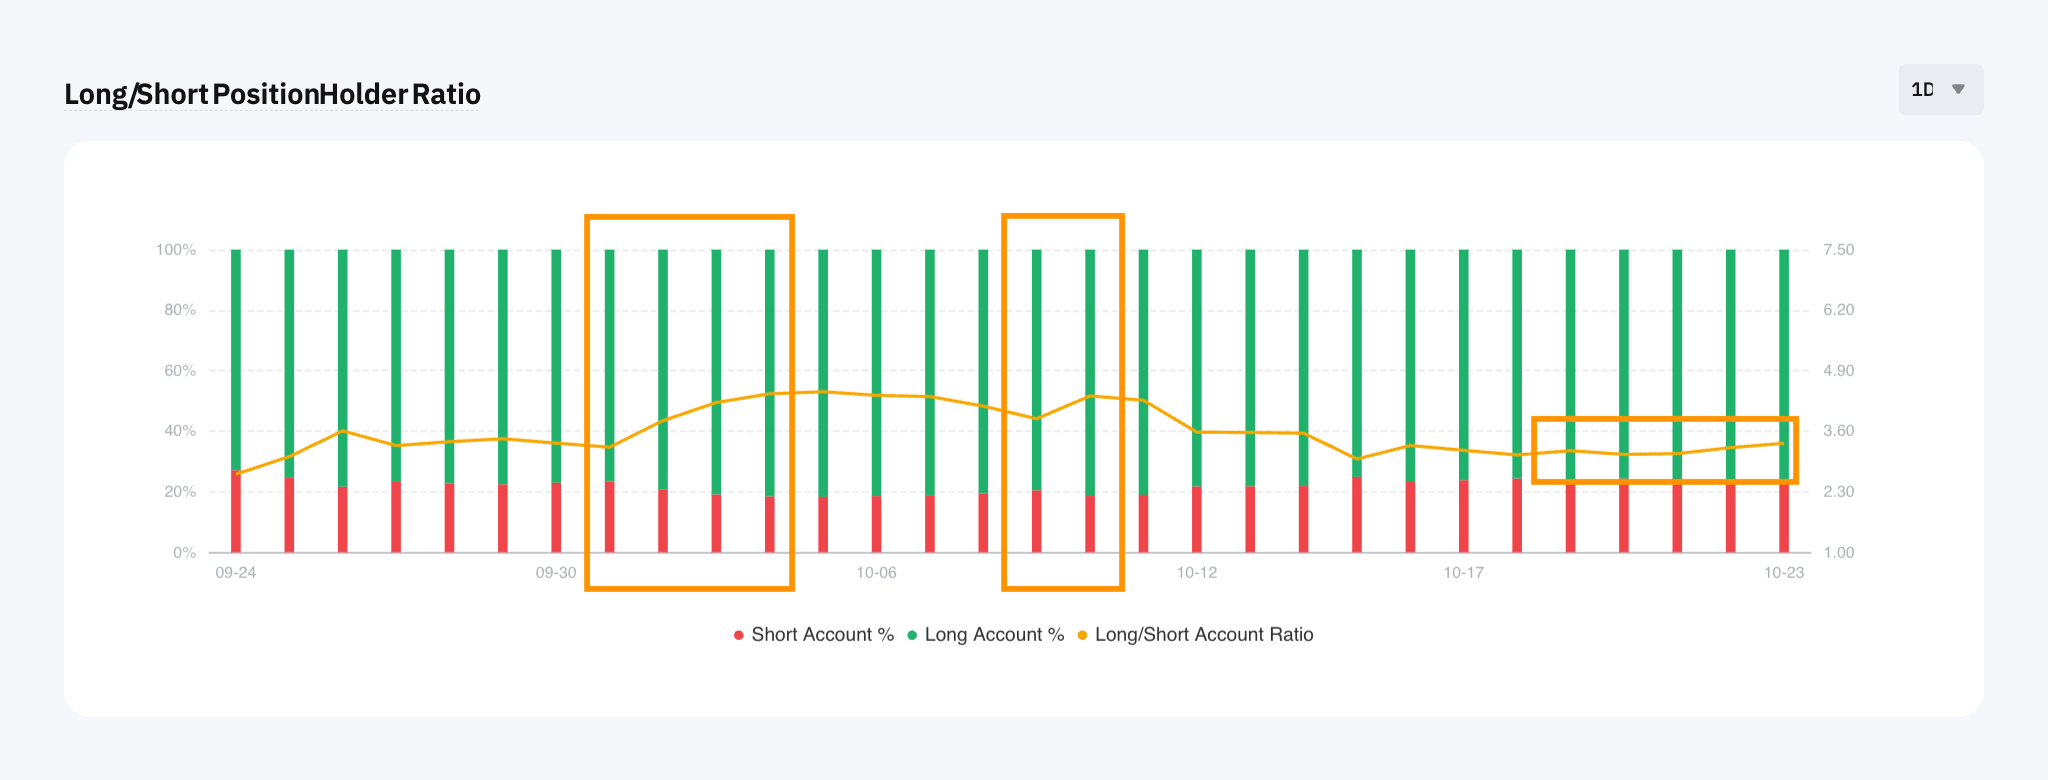
Despite traders' increasing interest in speculating on the price of ETH, the perpetual long/short ratio may indicate a rather neutral stance with a downside bias.
When we look at the past performance of the ETHUSDT perpetual daily long/short ratio, especially in early October and mid-October 2024 (highlighted in Figure 3 below), there were two clear spikes in the long/short ratio during the highlighted periods, indicating a higher percentage of long accounts over short accounts.
Figure 3: ETHUSDT perpetual daily long/short ratio on Bybit. Source: Bybit
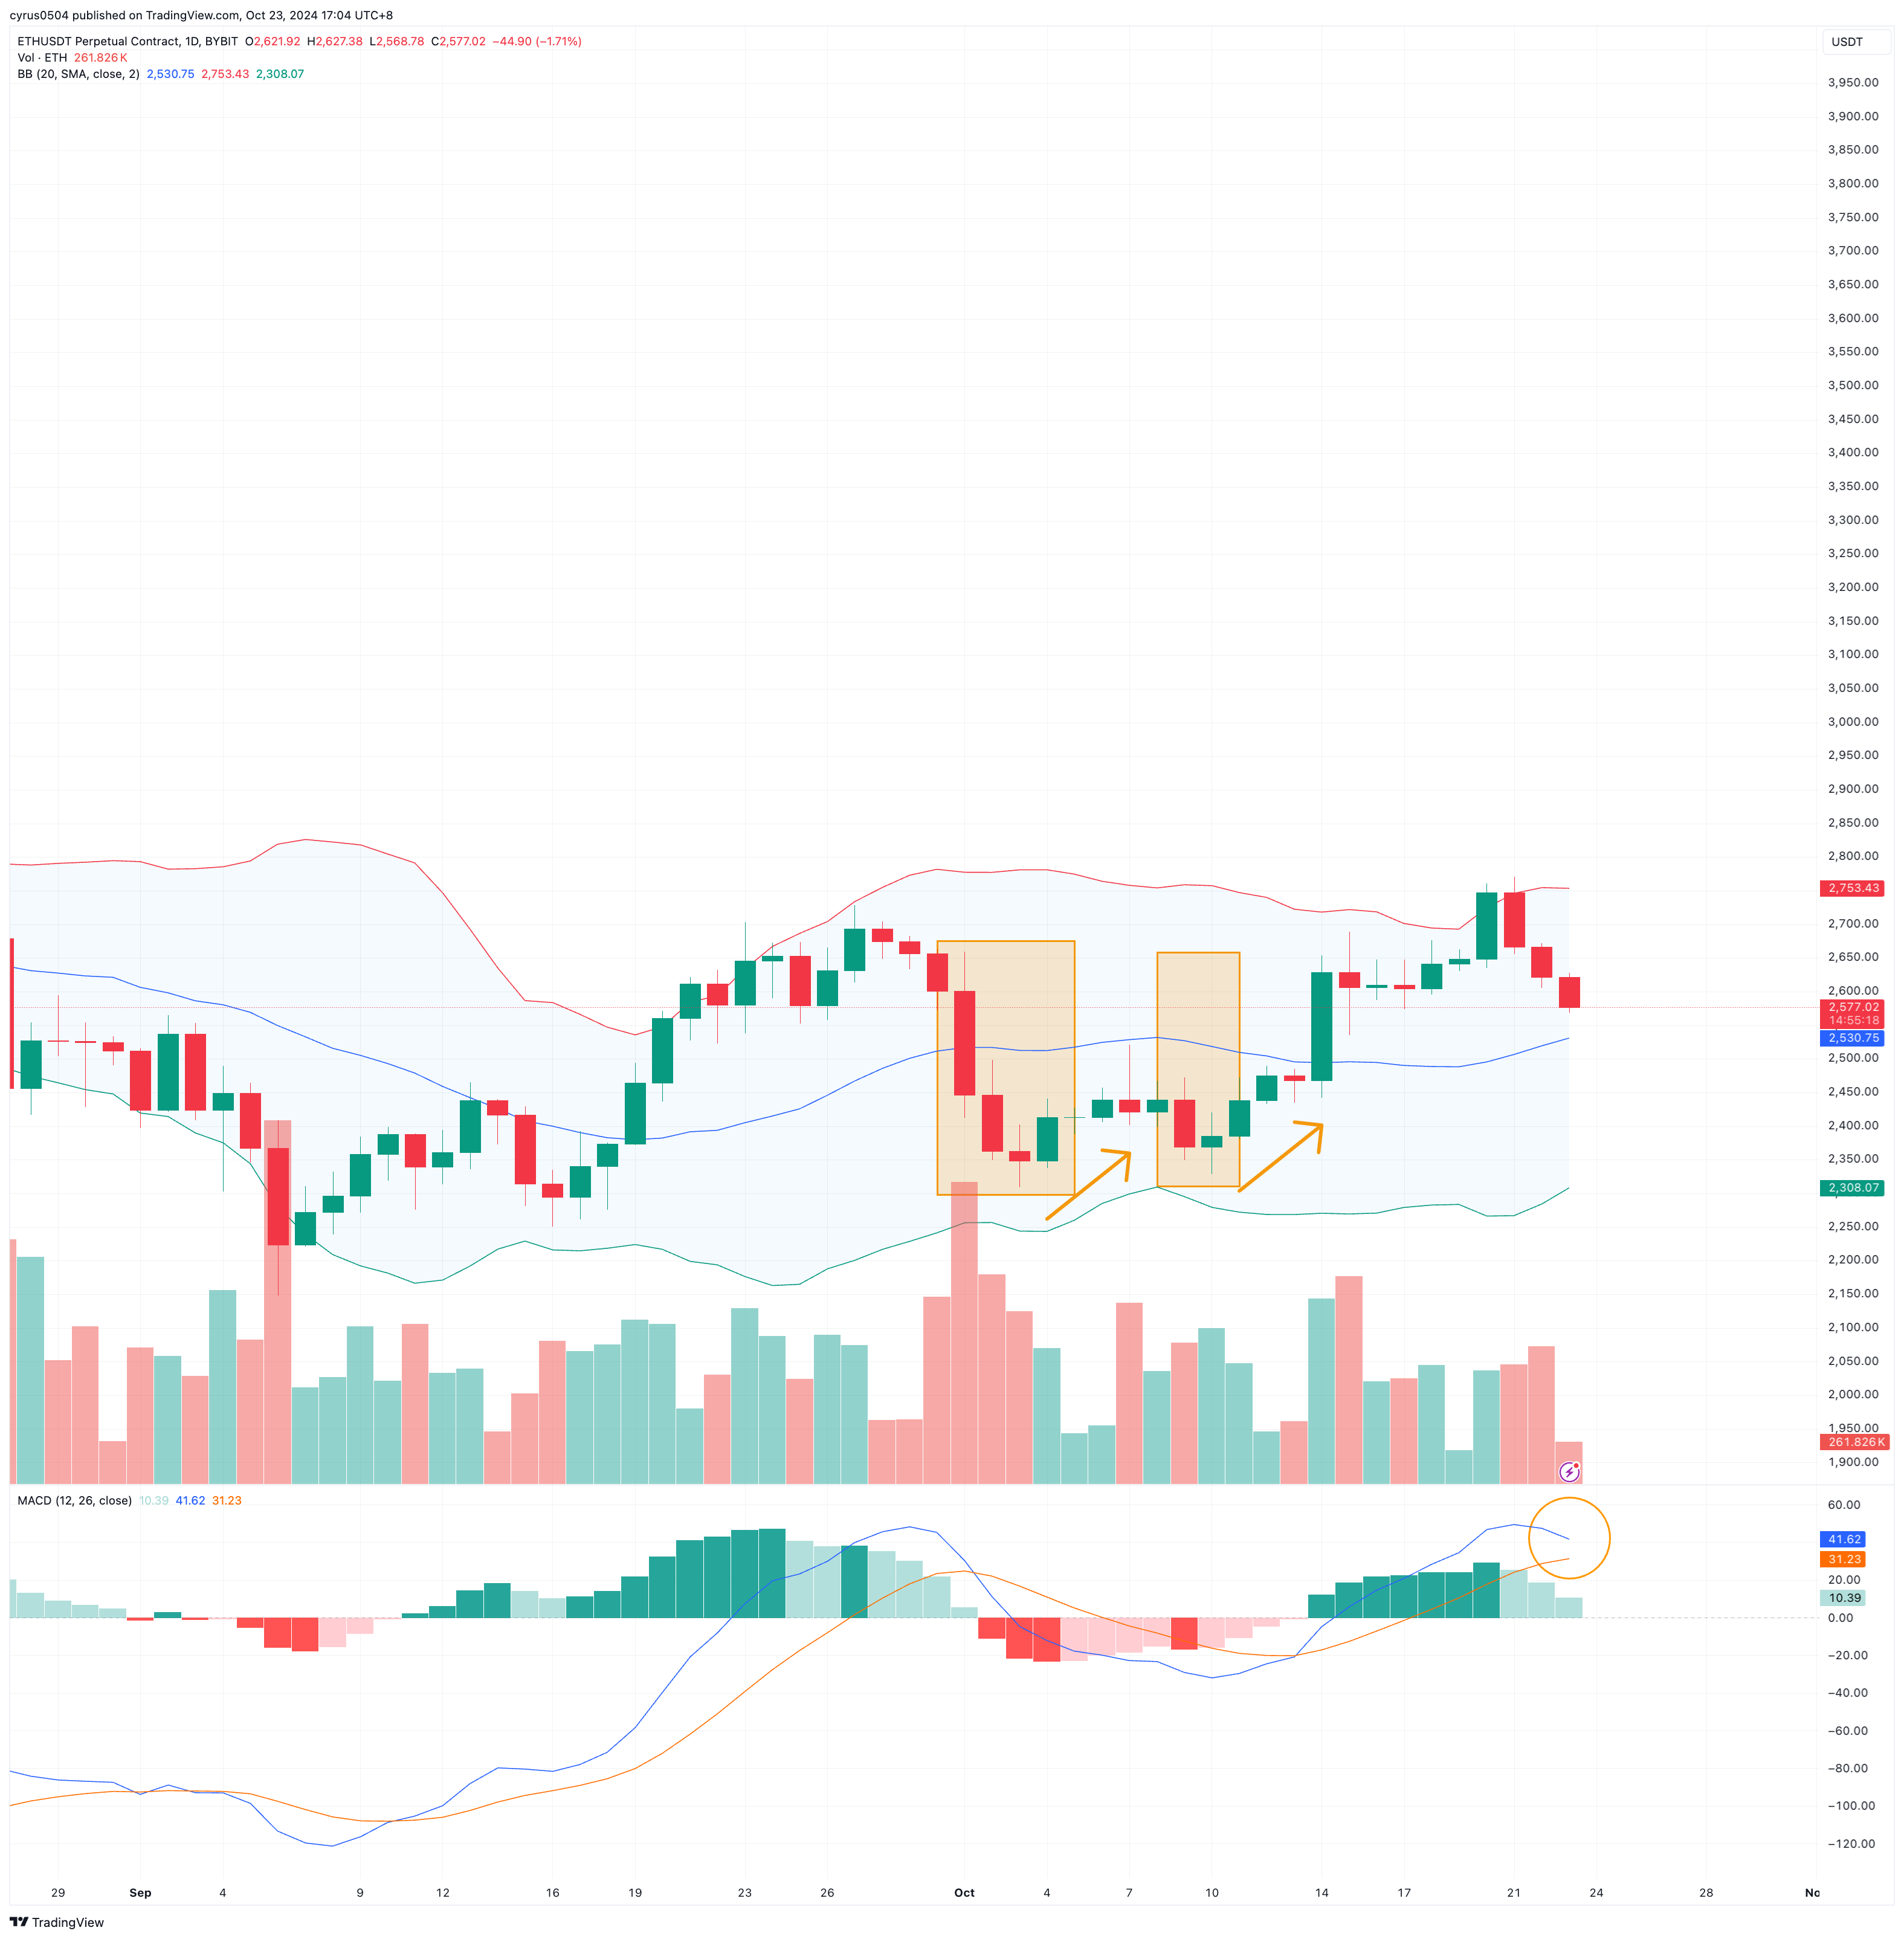
Now, look at the price of the ETHUSDT Perpetual contract on Bybit (shown in Figure 4 below). When the long/short ratio shows a confirmed uptrend, the price seems to follow suit shortly after. However, the recent daily long/short ratio has been relatively flat and has yet to produce any trends. This may indicate that the upside momentum has been slowing down, and the rally may need a break.
Figure 4: ETHUSDT Perpetual daily chart. Sources: Bybit; TradingView
Technical indicators also support this assumption. After the price hits the upper band of the Bollinger Bands®, which technicians consider an overbought signal, the daily MACD line has been moving toward the signal line and potentially moving under it (highlighted in the circle), which also suggests the rally may need a break.
Options Data Hands Silver Lining
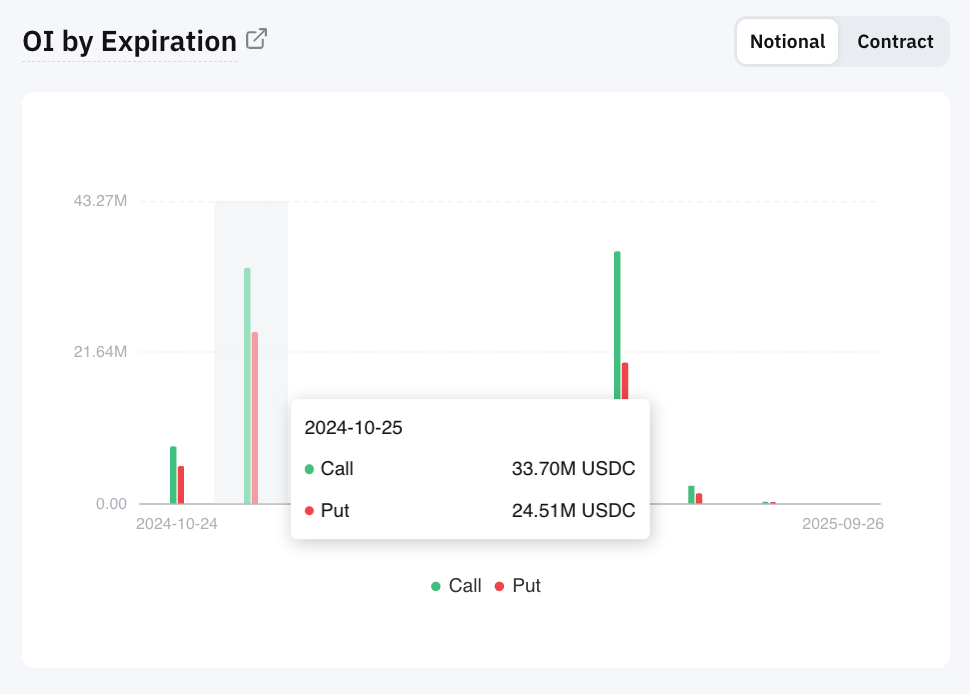
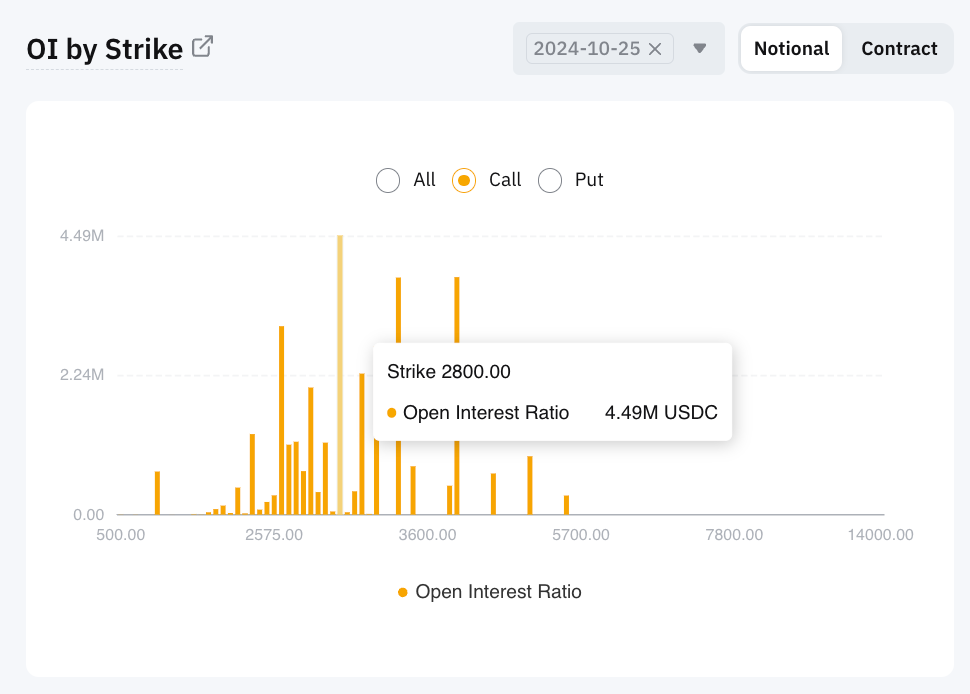
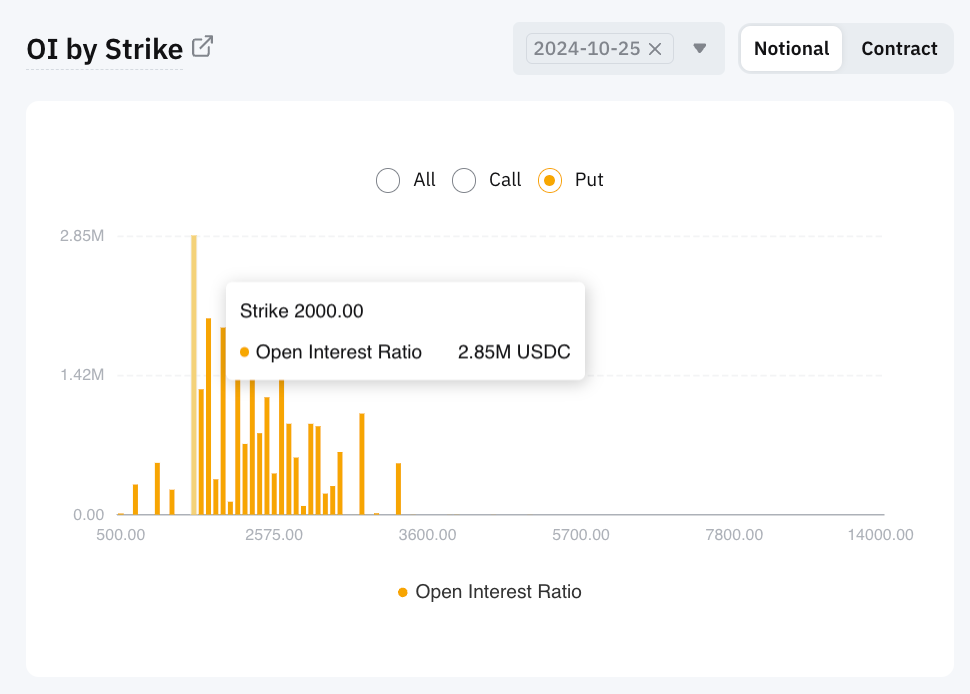
Although there may be a short-term downside bias from the perpetuals data and the technical perspective, some of the options trading data may be able to give a different view. Data from Bybit shows that most ETH options traders have a month-end setup, with most open interest focused on contracts with an October 25, 2024 expiration. Among calls, most of the open interest has focused on the $2,800 strike, and the $2,000 strike has been the most popular among puts.
Figure 5: ETH options open interest by expiration on Bybit. Source: Bybit
Figure 6: ETH call options open interest by strike on Bybit. Source: Bybit
Figure 7: ETH put options open interest by strike on Bybit. Source: Bybit
At the time of this writing (Oct 23, 2024), ETH has been changing hands at around $2,500. When looking at the ETHUSDT daily chart, it’s hard not to notice that $2,800 has been the recent resistance level for ETH. Given that the U.S. elections are less than two weeks away and momentum seems to remain strong in equity, the possibility of a breakout from that resistance level can’t be completely ruled out.
Besides, the max pain of ETH options may also support the case of a short-term correction, rather than a trend reversal. Data from CoinGlass shows that the October 25, 2024 max pain for ETH options remains at $2,600.
Figure 8: Max pain for ETH options. Source: CoinGlass
In options trading, “max pain” refers to a specific strike price at which most options contract holders (calls and puts) would have the most significant financial loss when the contract expires. It’s the point where option owners (buyers) feel the most pain, while option sellers enjoy the maximum profit. In the traditional finance (TradFi) world, max pain has been an essential piece of information for options traders to adjust their positions and strategy strategically. The same theory also applies to crypto options trading.
The max pain theory suggests that the price of the underlying asset, ETH in this case, has a tendency to move toward the max pain point when options contracts expire. A $2,600 max pain point for ETH is slightly higher than its current price. In other words, derivatives traders seem to expect a capped downside risk for ETH at the current level, while there could be a chance to retest the recent resistance.
Conclusion
Derivatives trading, especially options, can be highly sophisticated and involve complicated strategies. By studying different derivatives trading data, market participants may be able to get a glimpse of what professional traders are thinking about. However, each piece of data provides only one piece of information. Seeing the bigger picture often requires assessing other data in parallel.
#BybitOpinion #LearnWithBybit
Disclaimer: Investing in cryptocurrencies and their derivatives involves substantial risk of loss, and isn’t suitable for every investor. This article provides facts for educational purposes only, and does not represent any financial advice. Prior to making any investment decisions, please ensure you fully understand the risks involved and seek independent advice if necessary. Our customer support team is available to assist you with any inquiries.
